
Democracy, Corruption and Economic Growth Post-Arab Spring in Tunisia and Libya
-
Abdalla Muktad


Abstract
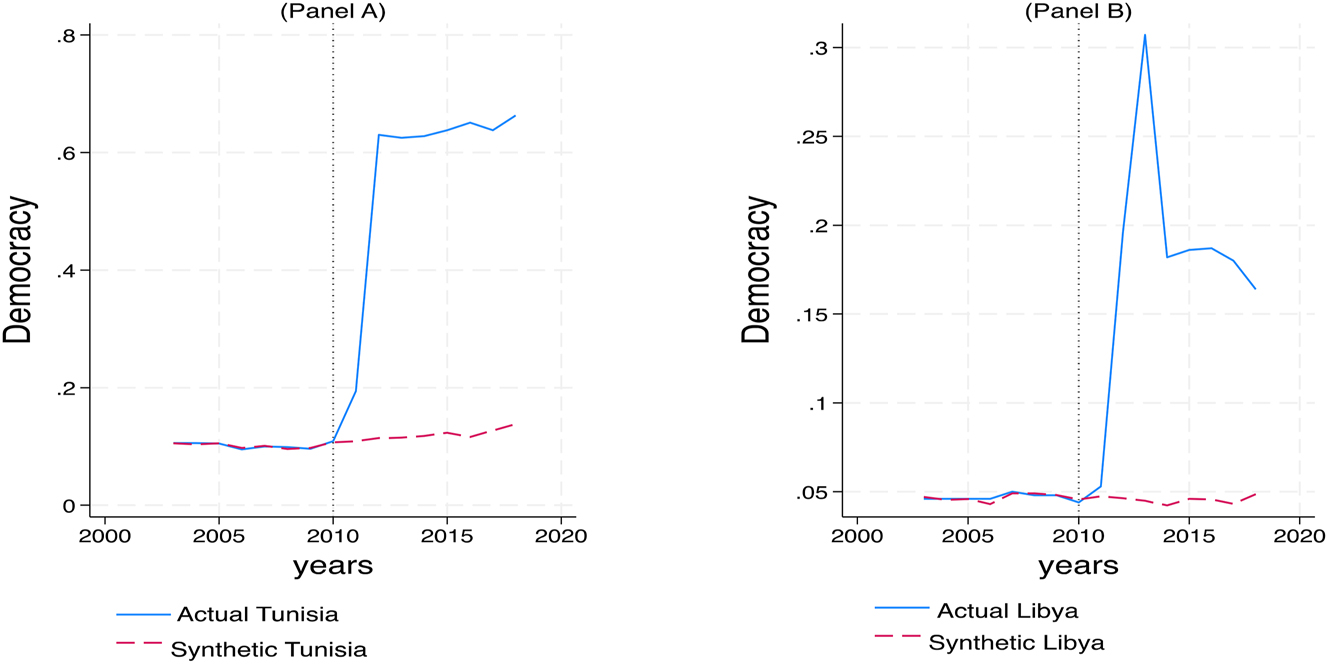
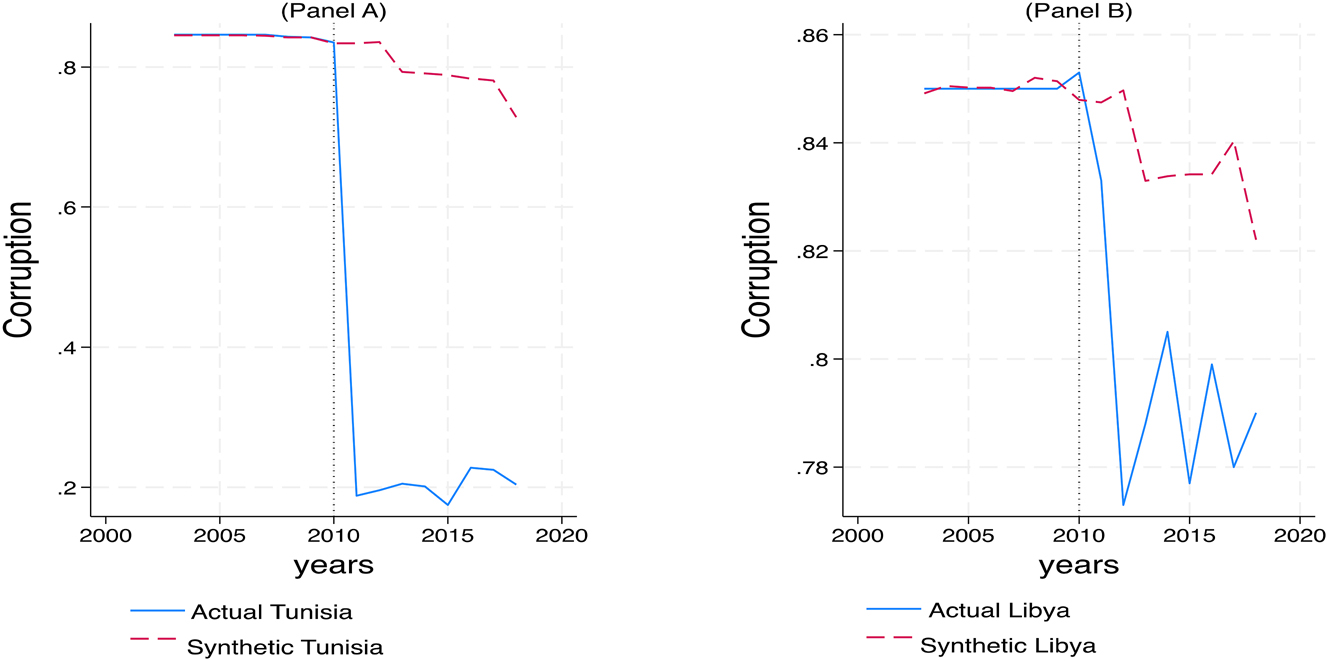
This paper uses the synthetic control method to analyze the repercussions of the Arab Spring on the economic growth, corruption levels, and democracy of Tunisia and Libya. The study covered the years 2003–2018, and I utilized panel data from Tunisia, Libya, and 56 developing countries that were unaffected by the Arab revolution. I excluded countries with incomplete data, those directly impacted by the Arab Spring, and countries affected by external shocks like natural disasters or conflicts. All the data used in this analysis was obtained from the World Bank Open Data and the Varieties of Democracy (V-Dem) project. The findings indicate that the Arab Spring had adverse effects on economic growth in both Tunisia and Libya, in comparison to what would have been expected based on their synthetic control counterparts. On the other hand, the results demonstrate a significant increase in democracy and anti-corruption in both countries following the Arab Spring.
Country weights of economic growth in the synthetic Tunisia.
| Country | Weight | Country | Weight | Country | Weight | Country | Weight |
|---|---|---|---|---|---|---|---|
| Angola | 0 | Colombia | 0 | Madagascar | 0 | Saudi Arabia | 0.003 |
| Albania | 0 | Costa Rica | 0 | Mexico | 0 | Senegal | 0 |
| United Arab Emirates | 0 | Ecuador | 0 | Mozambique | 0 | Sierra Leone | 0 |
| Argentina | 0 | Gabon | 0 | Malawi | 0 | El Salvador | 0 |
| Armenia | 0 | Ghana | 0 | Malaysia | 0.153 | Turkey | 0 |
| Azerbaijan | 0 | Guatemala | 0 | Namibia | 0 | Tanzania | 0 |
| Bangladesh | 0 | Croatia | 0 | Nigeria | 0 | Uganda | 0 |
| Bulgaria | 0 | Hungary | 0 | Nicaragua | 0.283 | Uruguay | 0 |
| Belarus | 0 | Indonesia | 0 | Oman | 0.235 | Vietnam | 0 |
| Bolivia | 0 | India | 0.172 | Panama | 0 | South Africa | 0 |
| Brazil | 0 | Jamaica | 0 | Peru | 0 | Zimbabwe | 0 |
| Botswana | 0 | Kazakhstan | 0 | Poland | 0 | ||
| Chile | 0 | Kenya | 0 | Paraguay | 0 | ||
| China | 0.155 | Kuwait | 0 | Qatar | 0 | ||
| Cote d’Ivoire | 0 | Moldova | 0 | Romania | 0 |
Country weights of economic growth in the synthetic Libya.
| Country | Weight | Country | Weight | Country | Weight | Country | Weight |
|---|---|---|---|---|---|---|---|
| Angola | 0 | Colombia | 0 | Madagascar | 0 | Saudi Arabia | 0.534 |
| Albania | 0 | Costa Rica | 0 | Mexico | 0 | Senegal | 0 |
| United Arab Emirates | 0 | Ecuador | 0 | Mozambique | 0 | Sierra Leone | 0 |
| Argentina | 0 | Gabon | 0 | Malawi | 0 | El Salvador | 0 |
| Armenia | 0.035 | Ghana | 0 | Malaysia | 0 | Turkey | 0 |
| Azerbaijan | 0.199 | Guatemala | 0 | Namibia | 0 | Tanzania | 0 |
| Bangladesh | 0.019 | Croatia | 0 | Nigeria | 0 | Uganda | 0 |
| Bulgaria | 0 | Hungary | 0 | Nicaragua | 0 | Uruguay | 0 |
| Belarus | 0 | Indonesia | 0 | Oman | 0 | Vietnam | 0.014 |
| Bolivia | 0 | India | 0 | Panama | 0 | South Africa | 0 |
| Brazil | 0 | Jamaica | 0 | Peru | 0 | Zimbabwe | 0.114 |
| Botswana | 0 | Kazakhstan | 0 | Poland | 0 | ||
| Chile | 0 | Kenya | 0 | Paraguay | 0 | ||
| China | 0 | Kuwait | 0.085 | Qatar | 0 | ||
| Cote d’Ivoire | 0 | Moldova | 0 | Romania | 0 |
Democracy predictor means before the Arab Spring.
| Predictors | Tunisia | Synthetic Tunisia | Libya | Synthetic Libya |
|---|---|---|---|---|
| Real GDP per capita | 9.11 | 9.84 | 9.93 | 10.07 |
| Life expectancy | 4.31 | 4.29 | 4.28 | 4.29 |
| Government expenditure % of GDP | 0.17 | 0.17 | 0.14 | 0.18 |
| Female to labor | 0.26 | 0.27 | 0.33 | 0.26 |
| Rule of law | 0.04 | −0.13 | −0.94 | −0.21 |
| Urban | 0.66 | 0.65 | 0.77 | 0.69 |
| Region | 1.00 | 0.61 | 1.00 | 0.65 |
| Open | 0.96 | 0.95 | 0.99 | 0.86 |
| Population growth | 0.93 | 1.98 | 1.42 | 2.21 |
| Democracy (2007) | 0.10 | 0.10 | 0.04 | 0.05 |
| Democracy (2005) | 0.11 | 0.11 | 0.05 | 0.05 |
| Democracy (2003) | 0.11 | 0.10 | 0.05 | 0.05 |
Country weights of democracy in the synthetic Tunisia.
| Country | Weight | Country | Weight | Country | Weight | Country | Weight |
|---|---|---|---|---|---|---|---|
| Angola | 0 | Colombia | 0 | Madagascar | 0 | Saudi Arabia | 0.526 |
| Albania | 0 | Costa Rica | 0 | Mexico | 0 | Senegal | 0 |
| United Arab Emirates | 0 | Ecuador | 0 | Mozambique | 0 | Sierra Leone | 0 |
| Argentina | 0 | Gabon | 0 | Malawi | 0 | El Salvador | 0 |
| Armenia | 0.088 | Ghana | 0 | Malaysia | 0 | Turkey | 0 |
| Azerbaijan | 0 | Guatemala | 0 | Namibia | 0 | Tanzania | 0 |
| Bangladesh | 0.020 | Croatia | 0 | Nigeria | 0 | Uganda | 0 |
| Bulgaria | 0.003 | Hungary | 0 | Nicaragua | 0.044 | Uruguay | 0 |
| Belarus | 0 | Indonesia | 0 | Oman | 0.087 | Vietnam | 0.180 |
| Bolivia | 0 | India | 0 | Panama | 0 | South Africa | 0 |
| Brazil | 0 | Jamaica | 0 | Peru | 0 | Zimbabwe | 0 |
| Botswana | 0 | Kazakhstan | 0 | Poland | 0 | ||
| Chile | 0 | Kenya | 0 | Paraguay | 0 | ||
| China | 0 | Kuwait | 0 | Qatar | 0 | ||
| Cote d’Ivoire | 0 | Moldova | 0.050 | Romania | 0 |
Country weights of democracy in the synthetic Libya.
| Country | Weight | Country | Weight | Country | Weight | Country | Weight |
|---|---|---|---|---|---|---|---|
| Angola | 0 | Colombia | 0 | Madagascar | 0 | Saudi Arabia | 0.649 |
| Albania | 0 | Costa Rica | 0 | Mexico | 0 | Senegal | 0 |
| United Arab Emirates | 0 | Ecuador | 0 | Mozambique | 0 | Sierra Leone | 0 |
| Argentina | 0 | Gabon | 0 | Malawi | 0 | El Salvador | 0 |
| Armenia | 0 | Ghana | 0 | Malaysia | 0 | Turkey | 0 |
| Azerbaijan | 0.198 | Guatemala | 0 | Namibia | 0 | Tanzania | 0 |
| Bangladesh | 0 | Croatia | 0 | Nigeria | 0 | Uganda | 0 |
| Bulgaria | 0 | Hungary | 0 | Nicaragua | 0 | Uruguay | 0 |
| Belarus | 0 | Indonesia | 0 | Oman | 0 | Vietnam | 0.032 |
| Bolivia | 0 | India | 0 | Panama | 0 | South Africa | 0 |
| Brazil | 0 | Jamaica | 0 | Peru | 0 | Zimbabwe | 0 |
| Botswana | 0 | Kazakhstan | 0 | Poland | 0 | ||
| Chile | 0 | Kenya | 0 | Paraguay | 0 | ||
| China | 0.121 | Kuwait | 0 | Qatar | 0 | ||
| Cote d’Ivoire | 0 | Moldova | 0 | Romania | 0 |
Corruption predictor means before the Arab Spring.
| Predictors | Tunisia | Synthetic Tunisia | Libya | Synthetic Libya |
|---|---|---|---|---|
| Real GDP per capita | 9.11 | 9.26 | 9.93 | 9.44 |
| Life expectancy | 4.31 | 4.22 | 4.28 | 4.25 |
| Government expenditure % of GDP | 0.17 | 0.13 | 0.14 | 0.13 |
| Female to labor | 0.26 | 0.43 | 0.33 | 0.41 |
| Rule of law | 0.04 | −0.50 | −0.95 | −0.66 |
| Urban | 0.66 | 0.65 | 0.77 | 0.58 |
| Region | 1.00 | 0.08 | 1.00 | 0.20 |
| Open | 0.96 | 0.82 | 0.99 | 0.94 |
| Population growth | 0.93 | 0.99 | 1.42 | 1.47 |
| Corruption (2007) | 0.85 | 0.85 | 0.85 | 0.85 |
| Corruption (2005) | 0.85 | 0.85 | 0.85 | 0.85 |
| Corruption (2003) | 0.85 | 0.85 | 0.85 | 0.85 |
Country weights of corruption in the synthetic Tunisia.
| Country | Weight | Country | Weight | Country | Weight | Country | Weight |
|---|---|---|---|---|---|---|---|
| Angola | 0 | Colombia | 0 | Madagascar | 0.028 | Saudi Arabia | 0.082 |
| Albania | 0 | Costa Rica | 0 | Mexico | 0 | Senegal | 0 |
| United Arab Emirates | 0 | Ecuador | 0 | Mozambique | 0 | Sierra Leone | 0 |
| Argentina | 0 | Gabon | 0.242 | Malawi | 0 | El Salvador | 0 |
| Armenia | 0.380 | Ghana | 0 | Malaysia | 0 | Turkey | 0 |
| Azerbaijan | 0.171 | Guatemala | 0 | Namibia | 0 | Tanzania | 0 |
| Bangladesh | 0.005 | Croatia | 0 | Nigeria | 0 | Uganda | 0 |
| Bulgaria | 0 | Hungary | 0 | Nicaragua | 0 | Uruguay | 0 |
| Belarus | 0 | Indonesia | 0 | Oman | 0 | Vietnam | 0 |
| Bolivia | 0.012 | India | 0 | Panama | 0 | South Africa | 0 |
| Brazil | 0 | Jamaica | 0 | Peru | 0 | Zimbabwe | 0 |
| Botswana | 0 | Kazakhstan | 0 | Poland | 0 | 0 | |
| Chile | 0 | Kenya | 0 | Paraguay | 0 | ||
| China | 0 | Kuwait | 0 | Qatar | 0 | ||
| Cote d’Ivoire | 0 | Moldova | 0.080 | Romania | 0 |
Country weights of corruption in the synthetic Libya.
| Country | Weight | Country | Weight | Country | Weight | Country | Weight |
|---|---|---|---|---|---|---|---|
| Angola | 0 | Colombia | 0 | Madagascar | 0 | Saudi Arabia | 0.197 |
| Albania | 0.065 | Costa Rica | 0 | Mexico | 0 | Senegal | 0 |
| United Arab Emirates | 0 | Ecuador | 0 | Mozambique | 0 | Sierra Leone | 0 |
| Argentina | 0 | Gabon | 0 | Malawi | 0 | El Salvador | 0 |
| Armenia | 0 | Ghana | 0 | Malaysia | 0 | Turkey | 0 |
| Azerbaijan | 0.737 | Guatemala | 0 | Namibia | 0 | Tanzania | 0 |
| Bangladesh | 0 | Croatia | 0 | Nigeria | 0 | Uganda | 0 |
| Bulgaria | 0 | Hungary | 0 | Nicaragua | 0 | Uruguay | 0 |
| Belarus | 0 | Indonesia | 0 | Oman | 0 | Vietnam | 0 |
| Bolivia | 0 | India | 0 | Panama | 0 | South Africa | 0 |
| Brazil | 0 | Jamaica | 0 | Peru | 0 | Zimbabwe | 0 |
| Botswana | 0 | Kazakhstan | 0 | Poland | 0 | ||
| Chile | 0 | Kenya | 0 | Paraguay | 0 | ||
| China | 0 | Kuwait | 0 | Qatar | 0 | ||
| Cote d’Ivoire | 0 | Moldova | 0 | Romania | 0 |
GDP predictor means before the Arab Spring with additional control variables.
| Predictors | Tunisia | Synthetic Tunisia | Libya | Synthetic Libya |
|---|---|---|---|---|
| Life expectancy | 4.31 | 4.21 | 4.28 | 4.20 |
| Government expenditure % of GDP | 0.17 | 0.16 | 0.14 | 0.16 |
| Natural resource % of GDP | 0.05 | 0.06 | 0.58 | 0.39 |
| Female to labor | 0.26 | 0.40 | 0.33 | 0.32 |
| Rule of law | 0.04 | 0.04 | −0.94 | −0.38 |
| Urban | 0.66 | 0.52 | 0.77 | 0.75 |
| Region | 1.00 | 0.10 | 1.00 | 0.40 |
| Open | 0.96 | 0.76 | 0.99 | 0.89 |
| Population growth | 0.93 | 1.21 | 1.42 | 2.55 |
| Mean years of education | 6.03 | 7.29 | 6.70 | 8.16 |
| Oil rent % of GDP | 3.96 | 3.91 | 56.72 | 36.62 |
| Unemployment rate | 13.16 | 12.40 | 19.47 | 9.96 |
| Income inequality | 3.04 | 4.34 | 2.79 | 4.16 |
| Real GDP per capita (2007) | 9.15 | 9.14 | 9.99 | 10.00 |
| Real GDP per capita (2005) | 9.05 | 9.05 | 9.90 | 9.88 |
| Real GDP per capita (2003) | 8.97 | 8.97 | 9.77 | 9.78 |
Democracy predictor means before the Arab Spring with additional control variables.
| Predictors | Tunisia | Synthetic Tunisia | Libya | Synthetic Libya |
|---|---|---|---|---|
| Real GDP per capita | 9.11 | 9.26 | 9.93 | 10.29 |
| Life expectancy | 4.31 | 4.14 | 4.28 | 4.28 |
| Government expenditure % of GDP | 0.17 | 0.16 | 0.14 | 0.19 |
| Natural resource % of GDP | 0.05 | 0.26 | 0.58 | 0.43 |
| Female to labor | 0.26 | 0.32 | 0.33 | 0.23 |
| Rule of law | 0.04 | −0.62 | −0.94 | −0.17 |
| Urban | 0.66 | 0.60 | 0.77 | 0.74 |
| Region | 1.00 | 0.48 | 1.00 | 0.74 |
| Open | 0.96 | 0.77 | 0.99 | 0.88 |
| Population growth | 0.93 | 1.77 | 1.42 | 2.47 |
| Mean years of education | 6.03 | 7.73 | 6.70 | 8.62 |
| Oil rent % of GDP | 3.96 | 21.19 | 56.72 | 40.94 |
| Unemployment rate | 13.16 | 5.74 | 19.47 | 5.94 |
| Income inequality | 3.04 | 4.68 | 2.79 | 4.75 |
| Democracy (2003) | 0.11 | 0.11 | 0.05 | 0.05 |
| Democracy (2005) | 0.11 | 0.11 | 0.05 | 0.05 |
| Democracy (2007) | 0.10 | 0.10 | 0.05 | 0.05 |
Corruption predictor means before the Arab Spring with additional control variables.
| Predictors | Tunisia | Synthetic Tunisia | Libya | Synthetic Libya |
|---|---|---|---|---|
| Real GDP per capita | 9.11 | 9.11 | 9.93 | 9.54 |
| Life expectancy | 4.31 | 4.22 | 4.28 | 4.24 |
| Government expenditure % of GDP | 0.17 | 0.12 | 0.14 | 0.13 |
| Natural resource % of GDP | 0.05 | 0.11 | 0.58 | 0.35 |
| Female to labor | 0.26 | 0.42 | 0.33 | 0.41 |
| Rule of law | 0.04 | −0.54 | −0.94 | −0.59 |
| Urban | 0.66 | 0.66 | 0.77 | 0.63 |
| Region | 1 | 0.02 | 1.00 | 0.20 |
| Open | 0.96 | 0.71 | 0.99 | 0.93 |
| Population growth | 0.93 | 0.87 | 1.42 | 1.78 |
| Mean years of education | 6.03 | 8.32 | 6.70 | 9.40 |
| Oil rent % of GDP | 3.96 | 8.85 | 56.72 | 32.62 |
| Unemployment rate | 13.16 | 10.85 | 19.47 | 8.14 |
| Income inequality | 3.04 | 3.60 | 2.79 | 2.93 |
| Real GDP per capita (2003) | 0.85 | 0.85 | 0.85 | 0.85 |
| Real GDP per capita (2005) | 0.85 | 0.85 | 0.85 | 0.85 |
| Real GDP per capita (2007) | 0.85 | 0.85 | 0.85 | 0.85 |
In-space placebo test for democracy in Tunisia and Libya.
In-space placebo test for corruption in Tunisia and Libya.
References
Abadie, A., A. Diamond, and J. Hainmueller. 2010. “Synthetic Control Methods for Comparative Case Studies: Estimating the Effect of California’s Tobacco Control Program.” Journal of the American Statistical Association 105 (490): 493–505. https://doi.org/10.1198/jasa.2009.ap08746.Search in Google Scholar
Abadie, A., A. Diamond, and J. Hainmueller. 2015. “Comparative Politics and the Synthetic Control Method.” American Journal of Political Science 59 (2): 495–510. https://doi.org/10.1111/ajps.12116.Search in Google Scholar
Abadie, A., and J. Gardeazabal. 2003. “The Economic Costs of Conflict: A Case Study of the Basque Country.” American Economic Review 93 (1): 112–32. https://doi.org/10.1257/000282803321455188.Search in Google Scholar
Abdel-Latifa, H., Elgoharib, H., and A. Mohamed. 2019. “Corruption, Political Instability and Growth: Evidence from the Arab Spring.” Topics in Middle Eastern and North African Economies 21 (2): 48–67. https://doi.org/10.2139/ssrn.3240211.Search in Google Scholar
Abu, N., A. Zaini, and A. Izraf. 2015. “Corruption, Political Instability and Economic Development in the Economic Community of West African States (ECOWAS): Is There a Causal Relationship?” Contemporary Economics 9 (1): 45–60. https://doi.org/10.5709/ce.1897-9254.159.Search in Google Scholar
Alesina, A., S. Özler, N. Roubini, and P. Swagel. 1996. “Political Instability and Economic Growth.” Journal of Economic Growth 1: 189–211. https://doi.org/10.1007/BF00138862.Search in Google Scholar
Ali, T. M. 2014. “Post-Political Transitions in Arab Spring Countries: The Challenges.” Procedia-Social and Behavioral Sciences 109: 250–6. https://doi.org/10.1016/j.sbspro.2013.12.454.Search in Google Scholar
Anoruo, E., and H. Braha. 2005. “Corruption and Economic Growth: The African Experience.” Journal of Sustainable Development in Africa 7: 43–55.Search in Google Scholar
Arafa, M. 2020. “Good Governance Against Administrative Corruption After Arab Spring: The Cases of Tunisia and Egypt.” Siyasat Arabiya 8 (43): 67–78.Search in Google Scholar
Barro, R. 1996a. “6). Democracy and Growth.” Journal of Economic Growth 1: 1–27. https://doi.org/10.1007/bf00163340.Search in Google Scholar
Barro, R. J. 1996b. “Determinants of Economic Growth: A Cross-Country Empirical Study (NBER Working Paper No. 5698).” National Bureau of Economic Research. https://doi.org/10.3386/w5698 Search in Google Scholar
Barro, R. J. 1999. “Determinants of Economic Growth: Implications of the Global Evidence for Chile.” Cuadernos de economía 36 (107): 443–78.Search in Google Scholar
Barro, R. J. 2002. “Quality and Quantity of Economic Growth.” Journal Economia Chilena 5 (2): 17–36.10.1023/A:1014393223522Search in Google Scholar
Becheikh, N. 2021. “Political Stability and Economic Growth in Developing Economies: Lessons from Morocco, Tunisia and Egypt Ten Years After the Arab Spring.” Insights into Regional Development 3 (2): 229–51. https://doi.org/10.9770/ird.2021.3.2(5).Search in Google Scholar
Bermeo, N. 2003. “What the Democratization Literature Says – or Doesn’t Say – About Postwar Democratization.” Global Governance 9 (2): 159–77. https://doi.org/10.1163/19426720-00902006.Search in Google Scholar
Bertelsmann Foundation. 2014. “Transformation Index – Libya 2014.” https://bti-project.org/en/?&cb=00000.Search in Google Scholar
Brueckner, M. 2021. “Democracy and Corruption.” Journal of Risk and Financial Management 14 (10): 492. https://doi.org/10.3390/jrfm14100492.Search in Google Scholar
Cheeseman, N., M. Collord, and F. Reyntjens. 2018. “War and Democracy: The Legacy of Conflict in East Africa.” Journal of Modern African Studies 56 (1): 31–61. https://doi.org/10.1017/s0022278x17000623.Search in Google Scholar
Collier, P., and A. Hoeffler. 2004. Challenge of Reducing the Global Incidence of Civil War. Oxford: Centre for the Study of African Economies, Department of Economics, Oxford University.Search in Google Scholar
Congressional Research Service. 2021. “Tunisia: In Brief.” https://crsreports.congress.gov/product/pdf/RS/RS21666.Search in Google Scholar
Coppedge, M., J. Gerring, D. Altman, M. Bernhard, S. Fish, A. Hicken, M. Kroenig, et al.. 2011. “Conceptualizing and Measuring Democracy: A New Approach.” Perspectives on Politics 9 (2): 247–67. https://doi.org/10.1017/s1537592711000880.Search in Google Scholar
Corruption Perception Index. 2021. “Transparency International.” https://www.transparency.org/en/cpi/2020.Search in Google Scholar
Echevarría, C., and J. García-Enríquez. 2019. “The Economic Consequences of the Libyan Spring: A Synthetic Control Analysis.” Defence and Peace Economics 30 (5): 592–608. https://doi.org/10.1080/10242694.2018.1446241.Search in Google Scholar
Echevarría, C. A., and J. García-Enríquez. 2020. “The Economic Cost of the Arab Spring: The Case of the Egyptian Revolution.” Empirical Economics 59: 1453–77. https://doi.org/10.1007/s00181-019-01684-7.Search in Google Scholar
Elbadawi, I. A. 1999. “Civil wars and poverty: The role of external interventions, political rights and economic growth.” In Paper for World Bank Conference on Civil Conflicts. Washington, DC: Crime and Violence.Search in Google Scholar
Elbadawi, I. A., and R. Soto. 2015. “Resource rents, institutions, and violent civil conflicts.” Defence and Peace Economics 26 (1): 89–113.10.1080/10242694.2013.848579Search in Google Scholar
Faleh, H. M. H., and A. Q. A. S. Ahmad. 2019. “Political Reforms in Jordan Following the Events of the Arab Spring.” Вестник Российского университета дружбы народов. Серия: Государственное и муниципальное управление 6 (1): 12–7. https://doi.org/10.22363/2312-8313-2019-6-1-12-17.Search in Google Scholar
Ferman, B., and C. Pinto. 2017. Placebo Tests for Synthetic Controls. MPRA Paper 78079. Germany: University Library of Munich.Search in Google Scholar
Gharehgozli, O. 2017. “An Estimation of the Economic Cost of Recent Sanctions on Iran Using the Synthetic Control Method.” Economics Letters 157: 141–4. https://doi.org/10.1016/j.econlet.2017.06.008.Search in Google Scholar
Ghosh, S., and Gregoriou, A. 2009. Is Democracy Beneficial for Growth in Countries with Low Ethnic Diversity? Working Paper No. 09–08. http://www.brunel.ac.uk/9379/efwps/0908.pdf.Search in Google Scholar
Hartwell, C., R. Horvath, E. Horvathova, and O. Popova. 2022. “Natural Resources and Income Inequality in Developed Countries: Synthetic Control Method Evidence.” Empirical Economics 62: 297–338, https://doi.org/10.1007/s00181-021-02023-5.Search in Google Scholar
Hotte, L. 2001. “Conflicts Over Property Rights and Natural-resource Exploitation at the Frontier.” Journal of Development Economics 66 (1): 1–21.10.1016/S0304-3878(01)00153-5Search in Google Scholar
Hotte, L. 2013. “Environmental Conflict and Natural Resources.” Encyclopedia of Energy, Natural Resource, and Environmental Economics 3: 261–70.10.1016/B978-0-12-375067-9.00011-5Search in Google Scholar
Huber, E., D. Rueschemeyer, and J. D. Stephens. 1993. The Impact of Economic Development on Democracy. Journal of Economic Perspectives, 7 (3): 71–86.10.1257/jep.7.3.71Search in Google Scholar
Jha, C. K., and F. Kırşanlı. 2023. “Arab Spring, Democratization of Corruption, and Income Inequality.” International Journal of Finance & Economics 1–14, https://doi.org/10.1002/ijfe.2853.Search in Google Scholar
Karnane, P., and A. Quinn. 2019. “Political Instability, Ethnic Fractionalization and Economic Growth.” International Economics and Economic Policy 16 (2): 435–61. https://doi.org/10.1007/s10368-017-0393-3.Search in Google Scholar
Kurzman, C., R. Werum, and R. E. Burkhart. 2002. “Democracy’s Effect on Economic Growth: A Pooled Time-Series Analysis, 1951–1980.” Studies in Comparative International Development 37: 3–33. https://doi.org/10.1007/bf02686336.Search in Google Scholar
Lederman, D., N. V. Loayza, and R. R. Soares. 2005. “Accountability and Corruption: Political Institutions Matter.” Economics & Politics 17: 1–35. https://doi.org/10.1111/j.1468-0343.2005.00145.x.Search in Google Scholar
Matta, S., S. Appleton, and M. Bleaney. 2019. “The Impact of the Arab Spring on the Tunisian Economy.” The World Bank Economic Review 33 (1): 231–58. https://doi.org/10.1093/wber/lhw059.Search in Google Scholar
Mo, P. H. 2001. “Corruption and Economic Growth.” Journal of Comparative Economics 29: 66–79. https://doi.org/10.1006/jcec.2000.1703.Search in Google Scholar
Ogundiya, I. S. 2010. “Corruption: The Bane of Democratic Stability in Nigeria.” Current Research Journal of Social Sciences 2: 233–41.Search in Google Scholar
Okafor, C. 2004. Neo-Democracy and Poverty Management in Africa. Awka: Mercury Bright Press.Search in Google Scholar
Pellegrini, L., and R. Gerlagh. 2004. “Corruption’s Effect on Growth and its Transmission Channels.” Kyklos 57: 429–56. https://doi.org/10.1111/j.0023-5962.2004.00261.x.Search in Google Scholar
Salih, K. E. O. 2013. “The Roots and Causes of the 2011 Arab Uprisings.” Arab Studies Quarterly 35: 184–206, https://doi.org/10.1 3169/arabstudquar.35.2.0184.10.13169/arabstudquar.35.2.0184Search in Google Scholar
Schneider, F., A. Buehn, and C. E. Montenegro. 2010. “New Estimates for the Shadow Economies All over the World.” International Economic Journal 24 (4): 443–61. https://doi.org/10.1080/10168737.2010.525974.Search in Google Scholar
Schwickerath, A. K. 2018. “Anti-Corruption Norms in Training for United Nations Peacekeeping Operations.” Crime, Law and Social Change 70 (2): 275–91. https://doi.org/10.1007/s10611-017-9731-1.Search in Google Scholar
Shleifer, A., and R. W. Vishny. 1993. “Corruption.” The Quarterly Journal of Economics 108 (3): 599–617. https://doi.org/10.2307/2118402.Search in Google Scholar
Starr, M. 2010. “Violent Conflict and Economic Growth: Some Time-Series Evidence.” Economics Letters 106: 200–4. https://doi.org/10.1016/j.econlet.2009.12.001.Search in Google Scholar
The Arab Republic Egypt Presidency. 2022. “Economic Reform in Egypt: Paving the Way for a Development Shift.” https://www.presidency.eg/en/الرئاسة/تقرير-التنمية-البشرية-في-مصر-2021/الفصل-الثاني/الفصل-الثاني/.Search in Google Scholar
Transparency International. n.d. Towards Enforcement of African Commitments Against Corruption: Data. Transparency International. https://www.transparency.org/en/projects/enforcement-of-african-commitments-against-corruption/data/tea-cac-c%C3%B4te-divoire.Search in Google Scholar
Treisman, D. 2000. “The Causes of Corruption: A Cross-National Study.” Journal of Public Economics 76 (3): 399–457. https://doi.org/10.1016/s0047-2727(99)00092-4.Search in Google Scholar
Uddin, M., M. Ali, and M. Masih. 2017. “Political Stability and Growth: An Application of Dynamic GMM and Quantile Regression.” Economic Modelling 64: 610–25. https://doi.org/10.1016/j.econmod.2017.04.028.Search in Google Scholar
Varieties of Democracy (V-Demo). 2018. “Codebook.” https://www.v-dem.net/media/filer_public/e0/7f/e07f672b-b91e-4e98-b9a3-78f8cd4de696/v-dem_codebook_v8.pdf.Search in Google Scholar
© 2023 Walter de Gruyter GmbH, Berlin/Boston