Taxing Interest on Deposits: Theoretical and Empirical Analysis for the Case of Lebanon

Abstract
In most countries, taxes on interest income are subsumed under the general income tax structure. In Lebanon, there is a departure from such a policy, and these taxes are not imposed as part of taxable income but are levied at source on interest from deposits at commercial banks. As a result, this necessitates the derivation of a theoretical model on the subject of this tax that must be applicable to Lebanon. This is the first intent of this paper. As such, the paper develops a model that attempts to maximize the tax revenue from a given tax rate and to minimize the deadweight loss from this tax. From this theory, the relevant parameters that affect the optimal tax rate are found to be the interest rate elasticities of deposit supply and demand. Assuming, as the case for Lebanon indicates, that the interest elasticity of demand for deposits is infinite, and conditioning on other exogenous variables, the own and cross interest elasticities of deposit supply are estimated by advanced econometric techniques. The results show that the optimal tax rates differ markedly for the two denominations of deposits, the one in Lebanese pounds and the one in foreign currency. The optimal tax rate is higher for the latter, and both rates are much higher than the actual rate, or even the proposed rate. The paper concludes that, although tax authorities in Lebanon can theoretically raise substantially the tax rate in order to increase tax revenues, other economic and political considerations limit to a large degree the liberty of implementing such a raise.
1 Introduction
There are perhaps two defining but largely contradictory features of the Lebanese economy today. First, its recurring budget deficit is about 8 % of GDP with a mounting public debt that exceeds 140 % of GDP. Second, its successful and vibrant banking sector which withstood years of upheavals and crises but managed, nevertheless, to remain the backbone of the economy. One main reason behind the deficits is excessive spending, caused mainly by a combination of high reconstruction costs, following the 1975/1990 civil war, and a corrupt public sector, and embodied in excessive transfers, especially to the inefficient public sector electricity firm, in public sector salaries, and in interest payments. [1] What made matters worse, of course, was the paucity of government revenue, driven by low tax yields and widespread tax evasion, such that in 2014 the ratio of government revenue to GDP was 21.8 % and that of tax revenue to GDP a lowly 13.8 %. Interestingly, tax revenues stood at $6.9 billion, but 36.9 % were in consumption taxes, 26.2 % were in income taxes, and 19.4 % were in trade and excise taxes, and the rest in other miscellaneous taxes like property taxes.
It is no surprise that, given the need for more tax resources, the government turned to the most lucrative part of the economy – the commercial banking sector. Commercial banks are already paying 38 % of corporate income taxes, but their rich deposit base – valued at $148 billion by mid-2015, two-thirds of which is in foreign currency, and representing more than three-times GDP represents a tax base that the government can easily tap. Their reputation for being the “Swiss” banking model of the Middle East, coupled with the existence of a large and successful Lebanese diaspora that remits more than $7 billion annually, made commercial banks a haven for safe and rewarding deposits. [2]
Accordingly, in 2002 the government imposed a 5 % tax rate on interest income from Lebanese pound and foreign currency deposits (against a separate personal income tax rate that progresses from 2 % to 20 %), and not surprisingly it proved very fertile. As Table 1 shows, by 2014 the tax brought in close to 7 % of tax revenues, covered more than 15 % of the deficit, constituted almost 1 % of GDP, and was more revenue-generating than the personal income tax. But since 2008, its yield has started to stabilize, because the growth of deposits has also stabilized, averaging less than 7 %, due partly to the worsening economic and political situation in the country. There is also the significant shift, beginning in 2011 with the onset of the Syrian crisis, and its repercussions on regional security, which decelerated growth sharply in Lebanon and affected adversely consumer and business confidence.
Interest income tax.
| Amount ($M) | % Tax revenue | % Total revenue | % of deficit | % of GDP | Tax from interest/tax from wages | Tax from interest/tax from profit | |
| 2003 | 96 | 3.22 | 2.17 | 3.68 | 0.48 | 0.83 | 0.36 |
| 2004 | 152 | 4.43 | 3.04 | 7.56 | 0.72 | 1.43 | 0.54 |
| 2005 | 223 | 6.92 | 4.55 | 12.0 | 1.03 | 1.81 | 0.82 |
| 2006 | 277 | 8.43 | 5.69 | 9.13 | 1.25 | 2.10 | 0.91 |
| 2007 | 290 | 7.82 | 4.99 | 11.38 | 1.16 | 1.99 | 0.87 |
| 2008 | 322 | 6.75 | 4.59 | 11.01 | 1.10 | 1.77 | 0.78 |
| 2009 | 370 | 6.22 | 4.39 | 12.50 | 1.04 | 1.59 | 0.76 |
| 2010 | 416 | 6.29 | 4.95 | 14.39 | 1.08 | 1.66 | 0.77 |
| 2011 | 432 | 6.59 | 4.63 | 18.47 | 1.07 | 1.43 | 0.63 |
| 2012 | 429 | 6.35 | 4.56 | 10.93 | 0.97 | 1.23 | 0.64 |
| 2013 | 438 | 6.52 | 4.64 | 10.37 | 0.92 | 1.12 | 0.67 |
| 2014 | 472 | 6.84 | 4.33 | 15.34 | 0.97 | 1.10 | 0.63 |
In 2013, the government faced with the need to find revenues to finance a proposed public wage increase, that would cost close to USD 2 billion, proposed to increase the interest income tax rate from 5 % to 7 %. Opponents to the tax – including wealthy individuals, firms, and the banks – argued that the tax is unfair and will slow down the growth in deposits. On the other hand, the government (and hard-pressed wage earners) thought that the tax is justified, and will not “kill the golden goose” nor unnecessarily harm the banks’ already high profits, though it is interesting to note that the banks’ relative profitability is modest, averaging lately an ROAE of 11 % against a regional average of 13 %. It is also interesting to note that this debate happened against a background that is characterized by a rudimentary and fragmented tax system. [3] The tax system in Lebanon, like its counterparts in the developing world, is heavily tilted toward consumption taxes, and tax policy is ad hoc and reactionary and is usually conducted in a highly politicized manner.
In this paper, we will try to shed a more objective light on that debate. We will do it by what we think is the proper and accurate economic way, that is, building a simple theoretical model that captures the incidence of the interest tax on the market for deposits, taking into consideration the specific attributes of the Lebanese monetary regime. We will then provide a rigorous empirical estimate of the optimal tax within an equation system that looks into the determinants of bank deposits in Lebanon. We will also evaluate our findings in light of Lebanese economic realities and the need for reforms in a climate of political instability. The basic conclusion that emerges from the study is that the ideal tax rate on interest income from deposits should of course be higher, but only within a reformed and rational tax system that is based on sound economics, riskless politics, and good governance.
2 Theoretical Model
We will proceed by first deriving a simple formula for the tax rate that maximizes government revenue from interest on deposits. We then adjust this formula so as to account for the minimization of the deadweight loss arising from the tax. Not surprisingly, the optimal tax depends crucially on the interest elasticities of the demand and supply of deposits.
2.1 Maximization of Total Tax Revenue
There seems to be no formal modeling of the supply and demand market for bank deposits, let alone of its relation to taxes on interest from these deposits. Most papers on the subject deal with reduced-equation models of the determinants of deposits; and, as to the treatment of taxes, it is usually dealt with – and rightly so – as part of “global” taxes on income, not as a separate tax and not strictly on interest income as is the case in Lebanon. To partially fill this gap, a simple model is developed for the bank deposits market that captures also taxes on the interest generated. The demand for deposits by banks, Dd, and the supply of deposits by individuals and firms, Ds, are based, respectively, on the interest rate, r, and the net-of-tax interest rate, r(1−t), in constant elasticity form:
where t is the tax rate on interest from deposits, A and B capture shift or exogenous factors that affect the demand and supply of deposits respectively, and Ɛd and Ɛs are the respective interest elasticities of deposits demand and supply. The tax revenue generated by the government from interest on deposits is R = trD. As a result:
Calculating the equilibrium values of D and r from eqs [1] and [2] and differentiating each in eq. [3], and setting the latter equal to zero, we get:
and solving for t in eq. [4], we get the optimal tax rate:
Equation [5] gives the tax rate, t*, that maximizes government revenue from taxes on interest on deposits. Note that:
This calls for lower tax rates on interest when demand and supply of deposits are more elastic (more negative in the case of demand) since, if not, the effect on reduced D and consequently on R will be large. Interestingly, those (individuals and firms) who find an inverse relationship between tax rates and revenues must believe that the relevant elasticity is high, that the relevant tax rate is high and should be lower, or both. On the other hand, those (in government) who deny the existence of an inverse relationship at any tax rate must really believe that supply and demand are inelastic and high tax rates are just about right. A relevant question, then, is: which case is more valid for Lebanon and whose perception is correct?
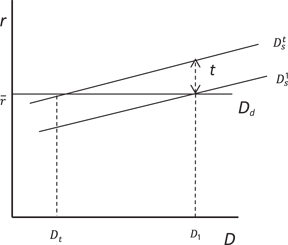
Lebanon, besides being deposit rich, follows a fixed exchange rate regime as its monetary framework. Given perfect capital mobility, it hence faces the “impossible trinity”: with fixed exchange rates and free mobility of capital, the country loses control over its money stock [4] (Azar 2014a). It also becomes an “interest rate taker” at levels determined internationally. As a result, the Central Bank’s, Banque du Liban (BDL), immediate target is to maintain the fixed-exchange rate parity, whereas its final target is to achieve low and stable inflation. Operationally, it has two targets to work with: first, the spread between Lebanese USD deposit rates and USD rates on international markets, needed to attract foreign capital so as to finance the current account and maintain the parity; second, the spread between Lebanese LBP deposit rates and USD deposit rates, needed to limit dollarization and enhance confidence in the Lebanese pound. So, effectively, BDL sets the Lebanese LBP deposit rate, r̅, at a (risk) premium over international USD rates. In turn, banks can interminably demand or attract deposits from both residents and non-residents alike at this going rate, making the demand schedule for deposits perfectly horizontal at r̅ – in other words, why offer higher rates when you would get all the bank deposits you want at the set rate r̅ and infinitely so if the rate falls below r̅ ?
Figure 1 depicts the bank deposits market for Lebanon and it also shows the impact of imposing a tax rate t on interest from deposits. The perfectly elastic demand for deposits shifts the burden completely on suppliers of deposits or individuals and firms. Importantly, with
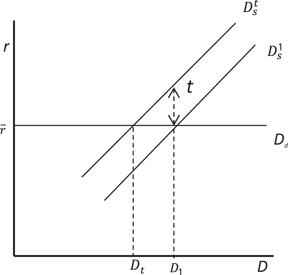
Effect of a tax rate t on the equilibrium supply of deposits.
Equation [6] demonstrates that a more elastic supply of deposits necessitate a lower
A higher supply elasticity leads to a dramatic fall in deposits (the tax base).
One last note is in order. Given that from eq. [6],
The inverse relation between the optimal tax rate and the elasticity of supply.
2.2 Minimization of the Deadweight Loss from the Tax
A tax always involves a deadweight loss. When the tax is proportional, as in this case, Snyder and Nicholson (2012) compute a linear approximation of this loss as:
Clearly, the deadweight loss is zero in cases where either
Solving for the optimal
Equation [9] has two roots. Taking the lowest, the optimal tax rate
There are two interesting points relating to eq. [10]. First, as expected, the optimal tax
3 Empirical Evidence
We have established that bank deposits in Lebanon are determined by the equation given by
3.1 The Data
Unless otherwise stated, all data are retrieved from the web site of the Central Bank of Lebanon, www.bdl.gov.lb. The sample spans the period from January 1995 to December 2014, i. e. 238 observations for each variable. The dependent variables are two: bank deposits in Lebanese pounds (LBP), and bank deposits in US dollars (USD). For the independent variables, the variable “iLBP” stands for the weighted-average interest rate on deposits in Lebanese pounds. The variable “iUSD” stands for the weighted-average interest rate on deposits in foreign currency. The variable “total assets” stands for the consolidated balance sheet of the commercial banking system. The variable “risk” stands for an index of composite (political, economic, and financial) risk, and it is obtained from the International Country Risk Guide. A high value for the risk index denotes less risk and it varies from 0 to 100. The variable “CI” is the coincident indicator, compiled by the Lebanese central bank, and which is intended to measure economic activity. The last three variables considered are: the oil price, the world MSCI index, both taken from Bloomberg LP, and the ratio of total loans to total deposits, which is taken from the web site of the BDL. The variables enter in the change in logs in the error-correction model (ECM) and in logs in the cointegration regression. Therefore in the latter all coefficients are elasticities.
Five dummies, which represent major economic or political events, are included.
Log of total deposits in billions of pounds.
3.2 Unit Root Tests
In order to conduct cointegration analysis, the variables must be of the same order of integration. As a matter of fact, when the ERS (Elliott, Rothenberg, and Stock 1996) test is applied on all logged variables the null hypothesis of a unit root fails to be rejected at high marginal significance levels (higher than 10 %). When the same test is applied on the changes in logs, however, the null of a unit root is rejected at very low marginal significance levels (lower than 1 %). It is interesting to note that the only exception is the Coincident Indicator variable which turns out to be stationary in distribution in both log form and in change of log form. Nonetheless this variable, whether considered stationary or non-stationary, is always statistically insignificant in the regressions, as was also found in Kanj and El Khoury (2013). That is why we drop it from the list of our independent variables. [7]
3.3 The Econometric Methodology
From the unit root tests, and since all the chosen variables are integrated of order one, then the regressions involving these variables may be spurious because of the underlying stochastic trends. It is only when the regression residual is stationary, or integrated of order zero, that the regression is a cointegration or long run regression, and the estimated coefficients can be considered as valid long run impacts. In a weaker sense, this cointegration residual may nevertheless be auto-correlated while still staying stationary.
The traditional approach to avoid spurious regressions is to change the variables to first-differences and run all regressions in first-difference form. However, this leads to a mis-specified model because Engle and Granger (1987) have demonstrated that any cointegration regression has an error-correction representation or ECM. This ECM model includes all the relevant variables in first-difference form, but includes additionally the lagged cointegration residual. Without this lagged variable the model is mis-specified. Originally, the cointegration regression and the ECM model were estimated separately. First, the cointegration regression is run, and the residual is retrieved. Then the ECM model is run that includes the lag of the retrieved cointegration residual. This paper will estimate the two models simultaneously and jointly. A further econometric refinement in this paper is to incorporate an equation for the conditional variance, as the presence of conditional heteroscedasticity may create inference problems and other econometric anomalies.
3.4 The Econometric Model
The model, which is comprised of three equations that are estimated jointly, takes the following mathematical form, with an integrated GARCH(2,1), or IGARCH(2,1), specification of the conditional variance:
In the above equations denoted by [11], the first is the ECM. The second is the cointegration regression. And the last is the conditional variance equation. The parameters
The coefficients
3.5 The First Set of Regressions
Table 2 presents the regressions that are specified with the first dependent variable: the amount of total deposits in Lebanese pounds. There are four models from the least constrained to the most constrained. The first elasticity of concern is the interest rate supply elasticity
First set of regressions: Error-correction and cointegration regressions. The dependent variable in the error-correction model is the first-difference of the log of the total amount of deposits in Lebanese pounds. The dependent variable in the cointegration regression is the log of the total amount of deposits in Lebanese pounds.
| Variable | Model 1 | Model 2 | Model 3 | Model 4 | ||||
| Coefficient | p-value | Coefficient | p-value | Coefficient | p-value | Coefficient | p-value | |
| ∆ log iLBP | 0.29166 | 0.0001 | 0.25392 | 0.0003 | 0.24049 | 0.0002 | 0.27193 | 0.0000 |
| ∆ log iUSD | –0.25082 | 0.0000 | –0.19212 | 0.0004 | –0.19363 | 0.0002 | –0.19467 | 0.0001 |
| ∆ log total assets | 0.83192 | 0.0000 | 0.92525 | 0.0000 | 0.87996 | 0.0000 | 0.87888 | 0.0000 |
| ∆ log risk | 0.27997 | 0.0001 | 0.24688 | 0.0001 | 0.23808 | 0.0002 | 0.22221 | 0.0009 |
| 1st lag of dep. var. | 0.23854 | 0.0000 | –0.05335 | 0.0726 | –0.04424 | 0.1323 | –0.02582 | 0.3809 |
| ∆ log oil price | –0.04603 | 0.0003 | ||||||
| ∆ log world MSCI | –0.03160 | 0.2196 | –0.03476 | 0.1438 | ||||
| Dummy1 | 0.00108 | 0.9597 | 0.00974 | 0.6896 | 0.01091 | 0.6340 | ||
| Dummy2 | –0.00243 | 0.9545 | –0.04866 | 0.3380 | –0.04799 | 0.3473 | ||
| Dummy3 | 0.14326 | 0.0000 | 0.14858 | 0.0000 | 0.14203 | 0.0000 | 0.14501 | 0.0000 |
| Dummy4 | 0.00709 | 0.2704 | 0.00448 | 0.71328 | 0.00426 | 0.4851 | ||
| Cointegration regression | ||||||||
| Constant | –26.4580 | 0.0000 | –24.5063 | 0.0000 | –24.2260 | 0.0000 | –22.4898 | 0.0000 |
| Log iLBP | 2.41634 | 0.0000 | 2.50666 | 0.0000 | 2.42265 | 0.0000 | 2.39209 | 0.0000 |
| Log iUSD | –1.74830 | 0.0000 | –1.44768 | 0.0000 | –1.37408 | 0.0000 | –1.43392 | 0.0000 |
| Log total assets | 1.73793 | 0.0000 | 1.78985 | 0.0000 | 1.77789 | 0.0000 | 1.74105 | 0.0000 |
| Log risk | 3.14986 | 0.0000 | 2.58886 | 0.0000 | 2.63162 | 0.0000 | 2.34907 | 0.0000 |
| Log price of oil | –0.14744 | 0.0020 | ||||||
| Log world MSCI | –0.23980 | 0.0515 | 0.03458 | 0.7378 | ||||
| ECM lag residual | –0.10169 | 0.0000 | –0.11124 | 0.0000 | –0.11136 | 0.0000 | –0.11503 | 0.0000 |
| Conditional variance equation | IGARCH(2,1) | IGARCH(2,1) | IGARCH(2,1) | IGARCH(2,1) | ||||
The adjustment to the long run (
The cross interest rate elasticity of supply is always negative as expected and varies, in the short run, between –0.25082 and –0.19212. The intermediate cross elasticity from model 1 is –0.3294. The long-run cross-interest rate elasticities vary between –1.74830 and –1.37408. As expected longer run elasticities are higher, in absolute values, than shorter term ones. And although there is more variability in the estimates they still denote a good degree of robustness.
The variable that stands for the total balance sheet amount of commercial banks enters positively, and statistically significantly so. The elasticities are close to +1 in the short run, and close to +1.75 in the long run cases. The risk variable enters positively, and varies in the short run between 0.22221 and 0.27997, and in the long run between 2.34907 and 3.14986. The reader is reminded that a high figure for the risk variable denotes less risk. All these elasticities are statistically highly significant. As expected, larger banks could mean better banks and hence more LBP deposits, and lower political risk encourages more placements in LBP by depositors.
The price of oil has a negative, but a statistically significant, impact. In model 1, the short run elasticity is –0.04603 and in the long run it is –0.14744. It is not clear why this relation is negative. Maybe this relation is spurious, or maybe oil price changes and consequently Gulf remittances tend not to favor LBP deposits. However the omission of the oil variable does not affect significantly the interest rate supply elasticity
One dummy variable is consistently statistically significant across the four models, while all others are not. And this is the third dummy (
3.6 Possible Extensions of the Model
First, one of the reviewers suggested that “the interest rate results may be improved if they are spreads in the equation appearing as one variable.” Theoretically this issue is not settled. It seems rather to be an empirical question. If one subjects Model 4 in Table 2 to an F-test, that considers the equality of the absolute values of the short run interest rate elasticities, the null hypothesis of equality fails to be rejected (as expected by the reviewer), with an actual p-value of 0.3186. However, if one subjects the same model to an F-test, that considers the equality of the absolute values of the long run elasticities, those in the cointegration regression, the null hypothesis of equality is rejected with an actual p-value less than 0.0001. Since the long run coefficients are the ones that are used in the policy application later on for the optimal tax rate, then constraining the interest rate elasticities to be equal, with an opposite sign, does not receive support empirically.
Second, if Model 4 of Table 2 is rerun with the addition of the fifth dummy,
Third, if Model 4 of Table 2 is rerun with the addition of
Finally, model 4 of Table 2 is rerun replacing the dependent variable from the change in the amount of total deposits in pounds to the change in the total amount of the total savings and time deposits in pounds, since demand deposits do not carry interest rates. The resulting estimate of the interest rate supply elasticity
3.7 The Second Set of Regressions
Table 3 presents the second set of the results of estimating jointly eq. [11] with the dependent variable being the total deposits in US dollars. There are four models going from the least constrained to the most constrained. The first model is comprehensive and consists of all the variables defined earlier. Many features of the results of this first model are surprising and somewhat counterintuitive. One, the immediate impact of the interest rate on deposits in Lebanese pounds is perversely positive and statistically significant. It should be negative because this impact is a cross elasticity. Two, the long run impact of the same variable is again positive and statistically significant, contrary to expectations. It could be that people look at the deposit rates in Lebanese pounds as powerful indicators of what will happen to US interest rates. Three, there is an insignificant short run impact of the interest rate on foreign currency deposits. It should be positive and statistically significant. Four, the coefficient on the lag of the dependent variable is negative and statistically marginally significant with a two-tailed p-value of 0.0351. This coefficient should be positive because the implied intermediate effects should theoretically be higher than the short run effects. Five, the short run coefficient on the world MSCI index is negative and statistically significant as expected from a substitute financial instrument. However the long run coefficient is positive and highly significant statistically. This is contrary to expectations from cross elasticities, and contrary to recent empirical evidence (Azar 2013, 2014b). Six, the adjustment to the long run is surprisingly lengthy, around 24.5 months, or close to two years.
Second set of regressions: Error-correction and cointegration regressions. The dependent variable in the error-correction model is the first-difference of the log of the total amount of deposits in foreign currency, valued in US dollars. The dependent variable in the cointegration regression is the log of the total amount of deposits in foreign currency, valued in US dollars.
| Variable | Model 1 | Model 2 | Model 3 | Model 4 | ||||
| Coefficient | p-value | Coefficient | p-value | Coefficient | p-value | Coefficient | p-value | |
| ∆ log iLBP | 0.14702 | 0.0000 | 1.40668 | 0.0000 | 0.01823 | 0.6595 | ||
| ∆ log iUSD | 0.01397 | 0.7021 | 0.05652 | 0.4878 | 0.07913 | 0.2178 | ||
| ∆ log total assets | 1.10359 | 0.0000 | 1.86550 | 0.0000 | 1.04445 | 0.0000 | 1.22029 | 0.0000 |
| ∆ log risk | –0.09781 | 0.0070 | ||||||
| 1st lag of dep. var. | –0.09626 | 0.0351 | 0.07580 | 0.1450 | ||||
| ∆ log oil price | 0.01957 | 0.0004 | ||||||
| ∆ log world MSCI | –0.04080 | 0.0004 | ||||||
| Dummy1 | 0.06412 | 0.0000 | 0.00497 | 0.7797 | ||||
| Dummy2 | 0.05733 | 0.0000 | –0.00137 | 0.9244 | ||||
| Dummy3 | 0.22377 | 0.0000 | 0.05751 | 0.0000 | ||||
| Dummy4 | –0.00216 | 0.1684 | 0.01014 | 0.0000 | ||||
| Cointegration regression | ||||||||
| Constant | –1.16191 | 0.0217 | 2.63989 | 0.2476 | –1.52923 | 0.0037 | –1.38192 | 0.0002 |
| Log iLBP | 0.24860 | 0.0000 | –0.58570 | 0.0759 | –0.39246 | 0.0000 | –0.48618 | 0.0000 |
| Log iUSD | 0.28964 | 0.0000 | 0.87782 | 0.0000 | 0.73536 | 0.0000 | 0.82136 | 0.0000 |
| Log total assets | 1.26981 | 0.0000 | 0.69377 | 0.0000 | 1.02417 | 0.0000 | 1.01677 | 0.0000 |
| Log risk | –0.74171 | 0.0000 | ||||||
| Log price of oil | 0.10516 | 0.0000 | ||||||
| Log world MSCI | 0.19690 | 0.0000 | ||||||
| ECM lag residual | –0.04080 | 0.0001 | –0.10948 | 0.0000 | –0.16592 | 0.0000 | –0.18598 | 0.0000 |
| Conditional variance equation | IGARCH(2,1) | IGARCH(2,1) | IGARCH(2,1) | IGARCH(2,1) | ||||
Two features of this first model are nevertheless supportive of the model. The short run and long run effects of the risk factor are negative and both are statistically very significant. More political risk leads to more investments in US dollars and less in Lebanese pounds. In addition, the short run and the long run effects of oil prices are positive and both are statistically very significant. The explanation is that higher oil prices increases the oil revenues in the Gulf region where many Lebanese workers are located. So remittances by these expatriates to Lebanon tend to increase. Since these remittances are mostly in foreign currency they lead to higher deposits in US dollars. Also, with high oil prices, liquidity generated by oil exporters finds a way to be invested in Lebanon.
For the above reasons a more constrained model is considered. The most constrained model is Model 4 in Table 3. It includes in the short run only the total assets of commercial banks, and the four dummies. It includes in the long run the interest rates on Lebanese and foreign deposits, besides the total assets. This assumes that there is no short run or intermediate run effects of these two interest rates, but only long run ones. The adjustment to the long run is quite fast and takes only 5.38 months. This adjustment takes 9.13 months in Model 2, and 6.03 months in Model 3. The long-run cross elasticity of supply is negative, as expected, and highly significant statistically. Its value is a reasonable –0.48618, while it is –0.39246 in Model 3, and –0.58570 in Model 2 but the latter is unfortunately statistically insignificant. The long-run own elasticity or the interest elasticity of supply of deposits in foreign currency is positive, as expected, and highly significant statistically. Its value is 0.82136, while it is 0.87782 in Model 2 and 0.73536 in Model 3, figures that denote robustness across models. However, the elasticity in Model 4 is statistically smaller than +1 with a t-value of –5.0342. Hence this elasticity is rather inelastic. The implied optimal tax rate is 54.90 % without adjustment for the deadweight loss, and 43.80 % after adjustment. These figures are close to the implied optimal tax rates from the other two models (see Table 4).
Summary values for t* and t**.
| First set of regressions | Second set of regressions | ||||
| % | t* | t** | % | t* | t** |
| Model 1 | 29.27 | 18.57 | Model 1 | ||
| Model 2 | 28.52 | 17.98 | Model 2 | 53.25 | 41.87 |
| Model 3 | 29.22 | 18.53 | Model 3 | 57.62 | 47.06 |
| Model 4 | 29.48 | 18.74 | Model 4 | 54.90 | 43.80 |
| Model 5 | 38.49 | 26.51 | Model 5 | 59.79 | 49.74 |
| Model 6 | 39.88 | 27.81 | |||
| Model 7 | 36.06 | 24.30 | |||
If an F-test is carried out on the null hypothesis that the coefficients on the long run interest rate supply elasticities, own and cross, are equal but opposite in sign, the null is rejected with an actual p-value less than 0.0001. Hence, taking the spread in the interest rates in the regressions is not econometrically sound. When
Model 4 of Table 3 is rerun with the addition of
4 Evaluation of Results
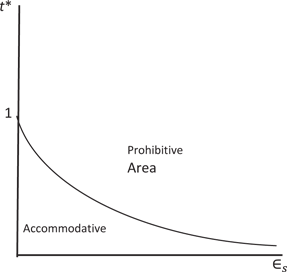
The first thing that comes to the mind in appraising the results is that, when it comes to taxes on interest income from bank deposits, Lebanon is in the “accommodative area” of Figure 3. With a current tax rate of 5 % only, a higher tax rate can yield more tax revenues. In this sense, it is the government’s position that is supported, and not that of individuals, bankers, and firms. However, the results show that the government should fine tune its proposed policy.
As Table 4 summarizes, the optimal tax rates are much higher for USD deposits (close to 45 %) than the rates for LBP deposits (close to 20 %), because of the differing long-run interest elasticities of deposits supply. Therefore, there is room for tax discrimination by the government. Optimally, it should impose a higher tax rate on the interest income from deposits in foreign currency because the supply is inelastic; while impose a lower tax rate on interest from deposits in domestic currency because the response is quite elastic and rapid, otherwise this would result in a significant drop in the supply of deposits and consequently in tax revenues. Administering such discrimination is not that hard either, since in both cases withholding of the tax is done at source.
There is another reason besides revenue maximization that would call for higher tax rates on interest income. With the corporate tax rate in Lebanon at 15 %, a tax rate on interest from deposits of 5 % would engender capital misallocation into deposit accounts instead of being invested in corporate activities that are taxed at a higher rate. So higher taxes on interest income are recommended on efficiency grounds as well.
But on a broader level, is it fair to impose optimal tax rates that average 20 % on interest from LBP deposits and 45 % on interest from USD deposits? Taken in the context of the Lebanese tax system as a whole where the corporate tax rate is 15 %, a dividend rate of 10 %, and an average personal tax rate of only 10 %, our derived optimal taxes on interest income will result in tremendous horizontal inequity. Even increasing the tax on deposits interest income to half its optimal level would still be taking singular advantage of this fertile “cash cow” source. However, Lebanon is not unique in this respect (Tanzi and Zee 2000). As an emerging economy, Lebanon is characterized by a large informal sector, by many small establishments, by a small share of wages in national income, by limited capacity of tax administration, and by a political setup whereby economic and often political power is concentrated in the top decile so that rich taxpayers are able to prevent high personal tax rates. As a result, the prevailing tax structure leans heavily on consumption taxes vis-a-vis income taxes (at a ratio of 2.1), and within income taxes it leans heavier on corporate taxes than on personal taxes (at a ratio of 1.7). [8] Given this distorted but rigid tax system, marginal changes are often preferred over major structural changes, even when the latter would be clearly preferable. However, this comes at the expense of perpetuating the inefficient tax structure.
There is a host of other interesting results from the two set of regressions. Stability in the foreign exchange rate and in the political situation is very supportive of deposits in LBP. Perhaps more crucially, political stability is not only essential in enhancing LBP deposits and reducing dollarization, but also in increasing the overall confidence in the economy and its prospects. On the other hand, political risk tends to favor deposits in USD for safety reasons, especially among resident Lebanese, and so does positive changes in oil prices and consequently in remittances flows. The latter is actually supported by the data, since non-resident private deposits constitute close to 22 % of total private deposits and 88 % of these non-resident deposits are in foreign currency. Needless to say, these dollar deposits are not only a lucrative source of tax revenues, especially at the higher optimal tax rate on interest income, but a needed tap to finance the recurring trade and current account deficits.
Moreover, within the current context, the average optimal tax on interest from LBP and USD deposits at close to 33 % (the simple average of both t** rates: 20 % and 45 %) is not unusually high. Since interest income is regularly taxed in most advanced economies as part of personal income and at a rate comparable to 33 %, the estimate in our model is then fairly valid. The current Lebanese tax structure has neither maintained fiscal sustainability nor delivered steady economic growth. Moreover, it was built around an outdated economic model. [9] As a result, our estimates can be seen as a prelude to a rational policy design, that is both theoretically and empirically grounded, and as a first step toward a serious revamp of the Lebanese tax system.
Concerning the banks, their opposition to the tax is partly justified. Although the perfectly elastic demand for deposits by banks render the tax burden to fall completely on suppliers by not changing the deposit rate that banks offer, equilibrium deposits will fall nevertheless. This will keep interest margins intact for the banks, but at the expense of lower transaction and business volumes. However, banks must not feel targeted, because the proposed tax increase to 7 % is still a far cry from the average optimal tax rate of 33 % that would prevail in an “ideal” state of affairs.
Two caveats are in order. First, one should adopt a general equilibrium setting, rather than just considering comparative statics. In this regard, it is crucial to know how the tax that is collected by the government is going to be spent. If this spending enhances the welfare of society then the tax rate would probably be higher than the optimal one. By contrast if the spending is wasteful then the tax rate would probably be lower. In the Lebanese context, the second alternative would reasonably hold. Another consideration for collecting taxes is to reduce the cost of servicing the public debt. However, the government faces a conflict of interest: it cannot be judge and arbiter at the same time, meaning it cannot decide by its own on the optimal tax rate that maximizes welfare. It is up to the civil society to lobby for this optimal tax.
The second caveat concerns the impact of policy on the behavior of the public, which relates to the famous “Lucas critique” (Lucas 1976). Individual preferences and behavior may change when a new policy is implemented. In our case this means that the elasticities that are estimated empirically in this paper may get altered after the imposition of the tax. There is no way to determine ex ante the significance of this problem.
5 Conclusion
When it comes to fiscal imbalances, Lebanon stands out among emerging countries in suffering from recurrent budget deficits in the upper single digits and public debts at multiple of GDP. As is common in similar situations, governments try to offset the fragmented structure of their revenue base by adopting “quick fix” solutions that tend, by default, to target the easily collectible consumption taxes such as VAT and tax on interest income of banking deposits. Whereas the former is wide-reaching, albeit being prone to some tax evasion, the latter is considered the lesser of the two “evils” (due to the association of savings with the better off in society) and is fully collected at the institutional source. In 2014 Lebanese government coffers received USD 472M (or 1 % of GDP) in deposit interest tax which has been growing at a compound average growth rate (CAGR) of 14 % since the inception of the tax in 2002. It is no surprise then for the government to have revisited this lucrative tax by proposing to raise it 200 basis points to 7 % in its current bid to finance public sector wage increases.
In this context, the paper tries to shed light on the relatively controversial subject of increasing tax on interest income of bank deposits by highlighting the optimal tax rate at which government revenues are maximized. Due to the scarcity of the literature relating to the subject matter, we have devised a theoretical model where the respective elasticities of demand and supply of deposits are derived as the sole determinants of the optimal level of interest tax. Given Lebanon’s peculiarity in offering a risk premium over international interest rates that renders the demand side of deposit perfectly elastic, the elasticity of supply was empirically estimated by regressing the supply of deposits as a function of the main independent variables affecting it, using advanced econometric techniques. Two separate regression models, the first included as dependent variable bank deposits in Lebanese pounds (LBP), and in the second bank deposits in USD, were run against the independent variables given by the weighted-average interest rate on deposits in Lebanese pounds and that of USD, total assets of the commercial banking sector, composite (political, economic, and financial) risk, global oil prices, the world MSCI index, and the ratio of total loans to total deposits. Additionally, five dummies were defined corresponding to the 1997 pegging of the foreign exchange rate, the 2005 assassination of Prime Minister Rafik Hariri, the 2006 Israeli war on Lebanon, the global financial crisis of 2009, and the period of imposition of the initial deposit tax rate of 5 % in 2002. The exercise was repeated with savings and time deposits in pounds as the dependent variable instead of total deposits in pounds.
Not surprisingly, the obtained results of the two regressions confirm the current macro-economic relations of the Lebanese economy, such as the importance of the fixed exchange rate and less political risk in shoring up LBP deposits. The converse is also true when considering USD deposits that are influenced by oil prices affecting positively remittances.
Perhaps more striking has been the tax discrimination implied in the optimal tax rate findings that come close to 20 % for LBP deposits and 45 % for USD deposits, reflecting the inelasticity of the latter vis-à-vis the relatively elastic deposit supply of the LBP. Whereas the optimal tax rates might come as music to the ears of government officials, it would certainly put off depositors and lenders alike and further risk the slowdown of deposit growth in the Lebanese banking sector.
In absolute terms, the results reveal the scope at which taxes on deposits can be utilized if the government were to maximize revenue from this particular income tax. That said any rise in similar taxes needs to be put in the perspective of an overall framework of fiscal policy rather than the marginal scope of reactive solutions in meeting specific funding requirements. For, it is the government’s primary task to safeguard the national interests of the overall economy rather than target temporary and ad hoc solutions that fail on equity and efficiency grounds.
Equally, financial institutions, cognizant of the optimal tax ranges and the modus operandi of the government, ought to engage more proactively in responsive financial and managerial planning that absorbs any future hikes in tax on interest on deposits and alleviates any disadvantages that arise from such policy action.
Acknowledgments
I am grateful to the comments of two anonymous reviewers of this journal, who helped improve significantly the paper. The usual disclaimer about remaining errors applies.
References
Azar, S. A. 2013. “US Stocks and the US Dollar II.” International Research Journal of Finance and Economics December (117):188–216.10.5430/ijfr.v4n4p91Search in Google Scholar
Azar, S. A. 2014a. “Foreign Reserve Accretion and Money Supply Creation: Lebanon’s Experience under an Adjustable Peg.” International Journal of Financial Research 5 (3):86–95.10.5430/ijfr.v5n3p86Search in Google Scholar
Azar, S. A. 2014b. “The US Dow and the US Dollar.” Applied Economics Letters 21 (10):683–6.10.1080/13504851.2014.884690Search in Google Scholar
Bolbol, A. 2014. “Whither the Lebanese Economy?” ABL Monthly Bulletin 11/2014:42–8.Search in Google Scholar
Elliott, G., T. J. Rothenberg, and J. H. Stock. 1996. “Efficient Tests for Autoregressive Unit Root.” Econometrica 64:813–36.10.3386/t0130Search in Google Scholar
Engle, R. F., and C. W. J. Granger. 1987. “Co-Integration and Error Correction: Representation, Estimation and Testing.” Econometrica 55 (2):251–76.10.2307/1913236Search in Google Scholar
Finger, H., and H. Hesse. 2009. “Lebanon-Determinants of Commercial Bank Deposits in a Regional Financial Center.” IMF working paper, WP/09/195.Search in Google Scholar
Haron, S., and W. Azmi. 2006. “Deposit Determinants of Commercial Banks in Malaysia.” Finance India 20 (2):1–20.Search in Google Scholar
Kanj, O., and R. El Khoury. 2013. “Determinants of Non-Resident Deposits in Commercial Banks: Empirical Evidence from Lebanon.” International Journal of Economics and Finance 5 (12):135–50.10.5539/ijef.v5n12p135Search in Google Scholar
Lucas, R. 1976. “Econometric Policy Evaluation: A Critique.” In The Phillips Curve and Labor Markets. Carnegie-Rochester Conference Series on Public Policy, volume 1, edited by K. Brunner and A. Meltzer, 19–46. New York: Elsevier, North Holland.10.1016/S0167-2231(76)80003-6Search in Google Scholar
Mansour, M. 2015. “Tax Policy in the MENA Region: Looking Back and Forward.” IMF Working Paper, WP/15/98.Search in Google Scholar
Monokrousos, P., and D. Thomakos. 2011. “A Technical Study on the Determinants and Outlook of Private Sector Deposits in the Greek Banking System.” Economy and Markets 6 (8):1–23.Search in Google Scholar
Mouradian, A. 2015. “The Lebanese Banking Sector: History, Characteristics, and Performance.” Unpublished report.Search in Google Scholar
Rey, H. 2013. “Dilemma or Trilemma: The Global Financial Cycle and Monetary Policy Independence.” Paper presented at the US Federal Reserve of Kansas City Conference in Jackson Hole, Wyoming.Search in Google Scholar
Snyder, C., and W. Nicholson. 2012. “Microeconomic Theory, Basic Principles and Extensions.” South Western, 11th international edition.Search in Google Scholar
Tanzi, V., and H. Zee. 2000. “Tax Policy for Emerging Markets: Developing Countries.” National Tax Journal 53 (2):299–322.10.17310/ntj.2000.2.07Search in Google Scholar
Turk-Ariss, R. 2012. “Understanding Inflation and Revising National Price Data.” Research Study: Lebanese Economic Association.Search in Google Scholar
©2016 by De Gruyter
Articles in the same Issue
- Frontmatter
- Arab Trade Dynamics after the Implementation of the Pan Arab Free Trade Area (1998–2012)
- Taxing Interest on Deposits: Theoretical and Empirical Analysis for the Case of Lebanon
- The Effect of Institutional Quality on Bank Lending in the Gulf Cooperation Council Countries
- More on Calendar Effects on Islamic Stock Markets