
Enhancement of mechanical properties of polypropylene by blending with styrene-(ethylene-butylene)-styrene tri-block copolymer
-
Aleksey D. Drozdov
 ,
Catalina-Gabriela Sanporean
,
Catalina-Gabriela Sanporean

Abstract
Observations are reported in impact tests, uniaxial tensile tests with various strain rates, relaxation tests with various strains and cyclic tests with a mixed deformation program and various maximum strains per cycle on neat polypropylene (PP) and a blend of PP with styrene-(ethylene-butylene)-styrene copolymer (SEBS). Experimental data demonstrate a pronounced enhancement of impact resistance of PP due to the presence of an impact modifier, accompanied by improvement of its properties under low-speed loading, observed as a decrease in relaxation rate and residual strain under cyclic deformation. Material constants in constitutive equations are determined by matching the experimental data. Correlations are established between changes in the viscoelastoplastic response of PP and evolution of its microstructure induced by the presence of an impact modifier.
1 Introduction
Polypropylene (PP) is one of the most versatile low-cost commodity polymers. Its advantages are good chemical and moisture resistance combined with high stiffness and processability. Industrial applications of PP subjected to high-speed loading are, however, limited due to its relatively low impact strength, in particular, below room temperature. To enhance the impact resistance of PP, a rubbery phase is conventionally incorporated into the polymer matrix. Numerous studies demonstrated superior mechanical and impact properties of PP blends with impact modifiers, including ethylene-propylene random copolymers and rubbers [1–3], ethylene-octene copolymers [4–7], ethylene-propylene-diene terpolymers [8, 9], styrene-ethylene/butylene-styrene and styrene-ethylene/propylene-styrene tri-block copolymers [10–14]. Although improvement of the toughness of PP induced by blending with impact modifiers is accompanied by a reduction in strength [15], this shortcoming may be overcome by cross-linking the blends [16, 17] or their reinforcement with nanoparticles [18–20].
Unlike previous studies, where mechanical properties of PP/styrene-(ethylene-butylene)-styrene copolymer (SEBS) blends under low-speed deformation were analyzed in tensile tests and small-amplitude oscillatory tests only, this work focuses on experimental investigation and modeling of the mechanical response of a neat PP and a PP/SEBS blend with a fixed elastomer content under a complicated deformation program: impact tests, uniaxial tensile tests with various strain rates, relaxation tests with various strains and cyclic tests with various maximum strains. Our objective is threefold: (i) to demonstrate a pronounced improvement of the impact resistance of PP due to its blending with SEBS, (ii) to reveal changes in the mechanical response of PP under low-speed deformation and (iii) to establish correlations between evolution of its morphology and elastic, viscoelastic and viscoplastic properties.
Treatment of observations in mechanical tests is performed within a novel variant of the constitutive model previously developed in [21–23] for the viscoelastoplastic response of semicrystalline polymers and nanocomposites with semicrystalline matrices. Among other models for the mechanical behavior of PP modified with elastomers, it is worth mentioning [24, 25] where various approaches were discussed for determination of elastic moduli of blends treated as composite materials, [26] where finite elastic deformations of a blend are analyzed and [27] where a blend is treated as an elastic medium subjected to damage accumulation.
2 Materials and methods
2.1 Preparation of samples
The homopolymer of isotactic PP, Moplen HP 400R (density 0.90 g/cm3, melt flow index 25 g/10 min at 230°C/2.16 kg, differential scanning calorimetry (DSC) melting peak Tm=170°C at a heating rate of 10°C/min) was purchased from LyondellBasell Ind. (Ludwigshafen, Germany).
The impact modifier, Kraton G1652 [a linear poly(styrene-b-(ethylene-co-butylene)-b-styrene) block copolymer with a styrene content of 29%, density of 0.91 g/cm3, melt flow index of 5 g/10 min at 230°C/5 kg and number average molecular weight Mn=79100] was supplied by Kraton Polymers (Wesseling, Germany).
To prepare a PP/SEBS blend with the elastomer concentration of 12 wt%, the components were blended in a Prism Eurolab-16 co-rotating twin-screw extruder (Thermo Scientific, Hvidovre, Denmark) at 200°C, with speed of 300 rpm and a feed rate of 2 kg/h. Dumbbell specimens for tensile tests (ASTM standard D-638) with cross-sectional areas of 9.8 mm×3.8 mm were molded by using the injection-molding machine, Ferromatic K110/S60–2K (Ferromatik A/S, Humlebeak, Denmark). To compare mechanical properties of neat PP and the PP/SEBS blend, PP specimens were manufactured following the same route.
Specimens for impact tests in the form of parallelepipeds with length 100 mm, width 9.8 mm and thickness 3.8 mm were cut from dumbbell specimens.
As the polymers used in preparation of the samples are identical to those employed in [18–20], our choice of SEBS content is based on the results of previous investigations, which reveal that this concentration is close to optimal from the standpoints of stiffness-toughness balance and distribution of SEBS inclusions in the PP matrix. Although this study is confined to the experimental and theoretical analysis of the mechanical behavior of PP and the PP/SEBS blend, its results are compared with observations in X-ray diffraction [18], DSC [18, 20], atomic force microscopy (AFM) [18–20] and dielectric spectroscopy [20] tests.
2.2 Mechanical tests
Tests were performed a few days after preparation of the samples, to avoid the effect of physical aging of PP on the mechanical response.
2.2.1 Impact tests
Impact tests were conducted by means of an Instron CEAST 9050 impact tester (Instron, Bucks, UK) equipped with a DAS 8000 Junior data-acquisition system, with a frequency of 1000 kHz and a 50 J instrumented hammer. Each test was repeated five times on new samples.
Observations in impact tests are reported in Figures 1 and 2. In Figure 1, force f is presented as a function of displacement d, and in Figure 2, specific dissipated energy W [the area below the f(d) curve in Figure 1] is plotted vs. time t. Except for a narrow region close to the origin in Figure 1 (with d<4 mm, where the graphs reflect self-oscillations of samples), the curves demonstrate good reproducibility: discrepancies between diagrams measured on different specimens are <3%.
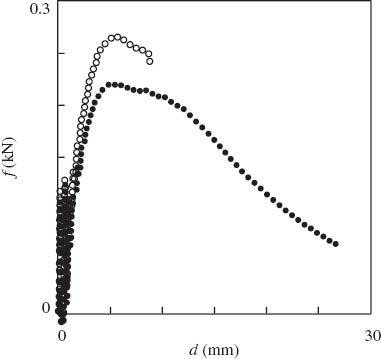
Force f vs. displacement d. Symbols: experimental data in impact tests on neat polypropylene (PP) (○) and PP/styrene-(ethylene-butylene)-styrene copolymer (SEBS) blend (•).
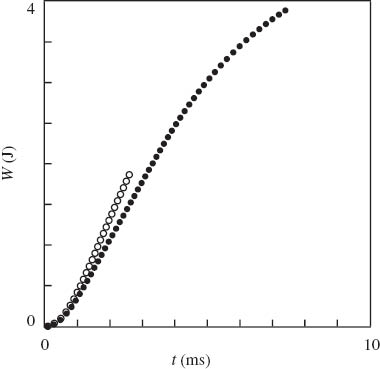
Specific dissipated energy W vs. time t. Symbols: experimental data in impact tests on neat polypropylene (PP) (○) and PP/styrene-(ethylene-butylene)-styrene copolymer (SEBS) blend (•).
According to these figures, blending of PP with 12 wt% of SEBS leads to substantial enhancement of its impact resistance: the ultimate displacement dmax increases by a factor of three and the ultimate dissipated energy Wmax grows by a factor of two.
The presence of the impact modifier results in qualitative changes in the shape of the force-displacement diagram: instead of the rapid decay in the f characteristic for brittle fracture, a monotonically decreasing branch of f(d) appears in the post-yield interval of deformation, whereas the yield region widens dramatically. Our results are in agreement with those reported in [14], where it was found that the slope of the decreasing branch of the force-displacement diagram increases with strain rate (and reaches infinity for brittle fracture).
2.2.2 Tensile tests
Uniaxial tensile tests were conducted by means of a universal testing machine Instron-5568 (Instron, Bucks, UK) equipped with an optical extensometer. Tensile force was measured by a 5 kN load cell. Engineering stress σ was determined as the ratio of axial force to cross-sectional area of each specimen in the undeformed state.
The experimental program involved three series of tests: (i) tensile tests with various cross-head speeds δ ranging from 1 to 400 mm/min, (ii) relaxation tests with various strains ε in the interval between 0.01 and 0.15 and (iii) cyclic tests with a mixed program (10 cycles of oscillations between a fixed maximum strain εmax and the zero minimum stress) with εmax ranging from 0.05 and 0.15. Each test was performed on a new specimen and repeated twice. Observations reveal good reproducibility of measurements: deviations between stresses measured on different specimens did not exceed 3%.
The first series consisted of four tensile tests with maximum strain εmax=0.2 and cross-head speeds δ=1, 10, 100 and 400 mm/min (corresponding to strain rates e=2.2×10⁻⁴, 2.2×10⁻³, 2.2×10⁻² and 8.8×10⁻² s-1). Observations in these tests are depicted in Figures 3 and 4, where engineering stress σ is plotted vs. tensile strain ε. According to these figures, at each cross-head speed δ, stress increased with strain in the sub-yield region of deformation, reached its maximum value σy at the yield point and decreased weakly with strain in the post-yield region of deformation. The growth of strain rate e resulted in an increase in σ, whereas blending of PP with SEBS induced a decrease in stress. The yield strain εy was weakly affected by strain rate and composition and remained close to εy=0.1 for all specimens.
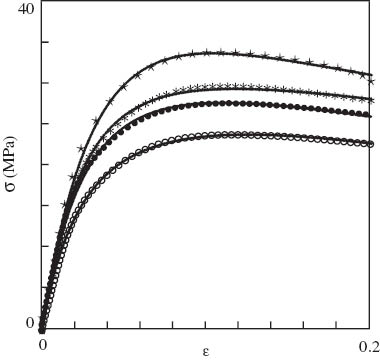
Stress σ vs. strain ε. Circles: experimental data on neat polypropylene (PP) in tensile tests with various strain rates e s-1 (○– e=2.2×10⁻⁴; • – e=2.2×10⁻³; * – e=2.2×10⁻²; ⋆– e=8.8×10⁻⁴). Solid lines: results of numerical simulation.
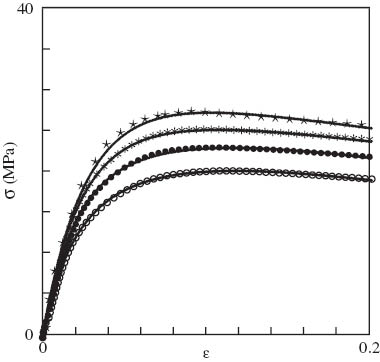
Stress σ vs. strain ε. Circles: experimental data on polypropylene (PP)/styrene-(ethylene-butylene)-styrene copolymer (SEBS) blend in tensile tests with various strain rates e s-1 (○– e=2.2×10⁻⁴; • – e=2.2×10⁻³; * – e=2.2×10⁻²; ⋆– e=8.8×10⁻⁴). Solid lines: results of numerical simulation.
To assess the effect of blending on the strength of PP, yield stress σy is plotted vs. strain rate e in Figure 5. The experimental data are approximated by the function:
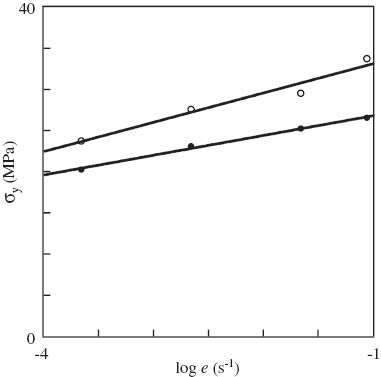
Yield stress σy vs. strain rate e. Symbols: treatment of observations in tensile tests on neat polypropylene (PP) (○) and PP/styrene-(ethylene-butylene)-styrene copolymer (SEBS) blend (•). Solid lines: approximation of the data by Eq. (1) with
where log=log10, and coefficients
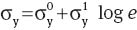
The other series of experiments involved six relaxation tests with strains ε=0.01, 0.03, 0.06, 0.09, 0.12 and 0.15. In each test, a specimen was stretched with a constant strain rate e=2.2×10⁻² s-1 to the required strain. Afterwards, a decrease in stress was monitored as a function of time while the strain was kept constant. Following the protocol ASTM E–328 for short-term relaxation tests, the duration of relaxation tests trel=20 min was chosen. Experimental data in relaxation tests are reported in Figure 6. Following common practice, the semi-logarithmic plots are employed, where stress σ is depicted vs. logarithm of relaxation time τ=t-t0 with t0 standing for the instant when relaxation starts. Figure 6 shows that the growth of strain ε results in an increase in the slope of relaxation diagrams (which means that the time-dependent response is strongly nonlinear). The increase is rather pronounced when ε lies in the sub-yield interval of deformations, but it weakens when strain ε exceeds yield strain εy.
Stress σ vs. relaxation time τ. Symbols: experimental data on (A) neat polypropylene (PP) and (B) PP/styrene-(ethylene-butylene)-styrene copolymer (SEBS) blend in relaxation tests with various strains ε (○– ε=0.01; • – ε=0.03; * – ε=0.06; ⋆ – ε=0.09; ◊ – ε=0.12; Δ – ε=0.15).
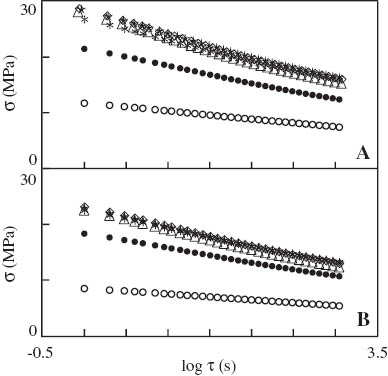
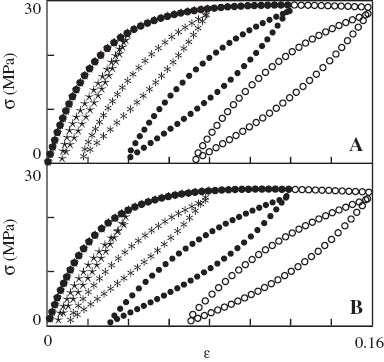
The third series of tests consisted of three cyclic tests with a mixed deformation program (oscillations between a maximum strain εmax and a minimum stress σmin) with εmax=0.05, 0.10 and 0.15 and σmin=1 MPa. Each test involved n=10 cycles of loading–retraction with constant strain rate e=2.2×10⁻² s-1. Observations are reported in Figure 7, where stress σ is plotted vs. strain ε. To avoid overlapping of experimental data, only the data along the first loading, retraction and reloading paths are presented. Figure 7 demonstrates that the growth of maximum strain εmax induces a pronounced increase in residual strain (estimated as the strain under retraction down to zero stress) and a substantial increase in hysteresis energy (evaluated as the area between subsequent unloading and retraction paths of each stress–strain diagram).
Stress σ vs. strain ε. Symbols: experimental data on (A) neat polypropylene (PP) (A) and (B) PP/styrene-(ethylene-butylene)-styrene copolymer (SEBS) blend in tensile tests (⋆) and cyclic tests with various maximum strains εmax (○– εmax=0.15; • – εmax=0.10; * – εmax=0.05) and σmin=1 MPa. Solid lines: results of numerical simulation.
To assess damage accumulation under cyclic loading, maximum stress per cycle σmax and minimum strain per cycle εmin are plotted vs. number of cycles n in Figures 8 and 9. The experimental data are approximated by the equations:
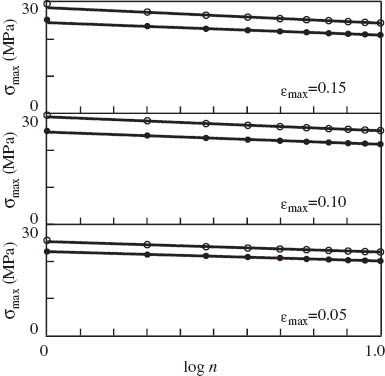
Maximum stress per cycle σmax vs. number of cycles n. Symbols: experimental data on neat polypropylene (PP) (○) and PP/styrene-(ethylene-butylene)-styrene copolymer (SEBS) blend (•) in cyclic tests with various maximum strains εmax. Solid lines: approximation of the data by Eq. (2) with
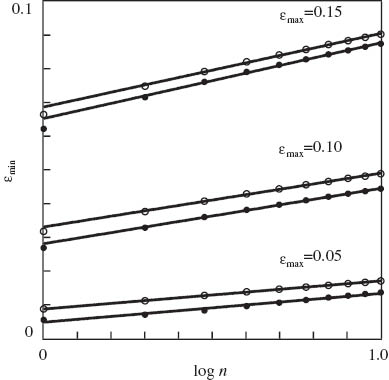
Minimum strain per cycle εmin vs. number of cycles n. Symbols: experimental data on neat polypropylene (PP) (○) and PP/styrene-(ethylene-butylene)-styrene copolymer (SEBS) blend (•) in cyclic tests with various maximum strains εmax. Solid lines: approximation of the data by Eq. (2) with

with coefficients calculated by the least-squares method. Figures 8 and 9 show good agreement between the observations and their fits by Eq. (2). For neat PP, coefficient R2=0.984, 0.985 and 0.949 and 0.999, 0.993 and 0.989 for σmax and εmin in tests with εmax=0.15, 0.10 and 0.05, respectively. For the PP/SEBS blend, the corresponding values of R2 read 0.999, 0.990 and 0.953 and 0.979, 0.994 and 0.983. Maximum stress per cycle σmax for neat PP exceeds that for the PP/SEBS blend (in accordance with the data depicted in Figure 5) and their ratio is independent of the number of cycles n. Minimum strain per cycle εmin for the PP/SEBS blend is lower than that for neat PP, which means that blending of PP with SEBS results in a pronounced decay (25% at εmax=0.05) in residual strain under cyclic deformation.
Maximum strain εmax=0.2 in tensile tests was chosen close to the necking strain for neat PP (Figure 3 shows that necking of a sample stretched with a cross-head speed δ=400 mm/min starts in the close vicinity of εmax). The interval of strains for relaxation tests covers the entire region of strains under consideration. Minimum stress σmin=1 MPa for cyclic tests was chosen instead of σmin=0, to avoid buckling of samples under retraction. Strain rate e=2.2×10⁻² s-1 was selected as the maximum strain rate at which strains ε in relaxation tests and maximum strains εmax in cyclic tests are correctly reproduced (with relative errors <1%) by the testing machine.
The following conclusions are drawn from observations: (i) under high-speed (impact) tests, blending of PP with SEBS (with a modest concentration 12 wt% of the impact modifier) results in a strong increase in strain to break (by a factor of 3) and a substantial growth of dissipated energy (by a factor of 2) and (ii) under low-speed tests, the presence of SEBS leads to a reduction in strength (σy decreases by 17%), a decay in slopes of relaxation curves and a noticeable decrease in residual strains under cyclic deformation. The latter result is in agreement with observations reported in [4] on blends of PP with ethylene-octene copolymer.
3 Constitutive modeling
To assess quantitatively changes in mechanical properties under low-speed deformation driven by blending of PP with SEBS, we applied a constitutive model for the viscoelastoplastic response of semicrystalline polymers developed in [21–23] and determined adjustable parameters in the stress-strain relations for neat PP and the PP/SEBS blend by matching the observations depicted in Figures 3, 4, 6 and 7.
A semicrystalline polymer is treated as a viscoelastoplastic continuum consisting of a transient network of flexible chains (the amorphous phase) with crystalline inclusions. The viscoelastic response of the equivalent medium reflects rearrangement of temporary junctions in the network: separation of active chains from their junctions and attachment of dangling chains to the network. Each rearrangement event occurs at a random instant being driven by thermal fluctuations. The viscoplastic behavior of the equivalent medium reflects sliding of junctions between chains in the amorphous matrix with respect to their reference positions, and interlamellar separation and fine (homogeneous shear of layer-like crystalline structures) and coarse (heterogeneous interlamellar sliding) slip of lamellar blocks in the crystalline phase.
3.1 Relaxation tests
To find material constants in the stress-strain relations, we begin from the analysis of observations in relaxation tests.
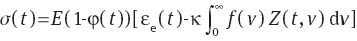
According to the model, a decrease in stress σ with time τ observed in uniaxial tensile relaxation tests is described by the equation:
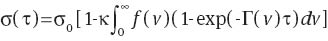
where σ0 stands for stress at the instant τ=0 when relaxation starts, and dimensional parameter κ denotes concentration of temporary chains: ratio of the number of temporary chains to the entire number of temporary and permanent chains per unit volume of the equivalent network. Dummy variable v denotes dimensionless activation energy for separation of active chains, and the function f(v) stands for distribution of meso-domains with various activation energies. With reference to the random energy model, the quasi-Gaussian expression is adopted for this function:
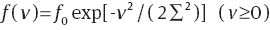
where Σ is a measure of heterogeneity of the equivalent network, and coefficient f0 is found from the normalization condition
where γ stands for relaxation rate and the dimensionless coefficient A characterizes nonlinearity of the time-dependent response. This quantity equals unity in the interval of the linear viscoelastic response and decreases linearly with strain ε at which relaxation tests are performed:

with A0=1. Eqs. (3)–(6) involve four material constants: A1, γ, κ and Σ. To find these quantities, we fit the observations reported in Figure 6. Each set of experimental data is matched separately. First, we approximate observations in relaxation tests with ε=0.01 (for which we set A=1) and calculate parameters γ, κ and Σ that ensure the best fit of the experimental data (γ and σ are determined by the method of nonlinear regression, and κ is found by the least-squares technique). The integral in Eq. (3) is evaluated by the Simpson method with M=100 points and step Δv=0.25. Afterwards, we fix these coefficients (their values are listed in Table 1) and approximate each relaxation diagram at ε=0.03, 0.06, 0.09, 0.12 and 0.15 by means of Eqs. (3)–(6) with the only adjustable parameter A.
Adjustable parameters in stress-strain relations.
| Parameter | Polypropylene | Polypropylene/SEBS |
|---|---|---|
| E (GPa) | 1.32 | 1.18 |
| γ (s-1) | 0.57 | 0.41 |
| κ | 0.61 | 0.62 |
| Σ | 8.0 | 8.0 |
SEBS, styrene-(ethylene-butylene)-styrene copolymer.
Figure 10 demonstrates that the model describes adequately the experimental data: the maximum discrepancy between the observations and the results of simulation does not exceed 3%. To avoid overlapping of data, only relaxation curves at ε=0.01, 0.03 and 0.15 are presented. However, the same accuracy of fitting is reached for relaxation diagrams with ε=0.06, 0.09 and 0.12.
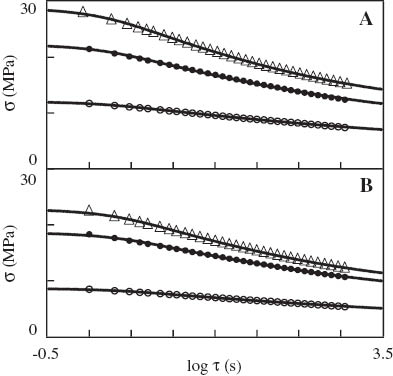
Stress σ vs. relaxation time τ. Symbols: experimental data on (A) neat polypropylene (PP) and (B) PP/styrene-(ethylene-butylene)-styrene copolymer (SEBS) blend in relaxation tests with various strains ε (○– ε=0.01; • – ε=0.03; Δ – ε=0.15). Solid lines: results of numerical simulation.
The effect of strain ε on parameter A is illustrated in Figure 11, where the data are approximated by Eq. (6) with the coefficient of determination R2=0.714 for neat PP and 0.754 for the PP/SEBS blend. The following conclusions are drawn from Table 1 and Figure 11: (i) the presence of SEBS does not affect practically coefficients A, κ and Σ and (ii) blending of PP with the impact modifier induces a decrease in relaxation rate γ by 40%.
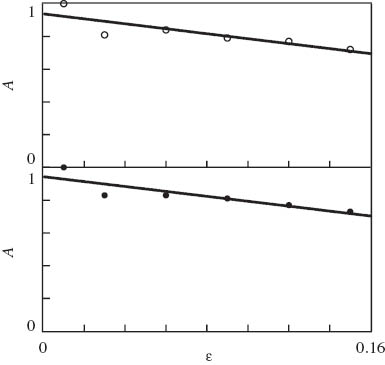
Parameter A vs. strain ε. Symbols: treatment of observations in relaxation tests on neat polypropylene (PP) (○) and PP/styrene-(ethylene-butylene)-styrene copolymer (SEBS) blend (•). Solid lines: approximation of the data by Eq. (6) with A0=0.94, A1=1.52 (PP) and A0=0.94, A1=1.50 (PP/SEBS).
3.2 Tensile tests
We proceed with matching experimental data in tensile tests with various strain rates e. The viscoelastoplastic behavior of the equivalent medium under uniaxial tension is described by the equation:
where elastic strain εe reads:

and εpa and εpc denote plastic strains in amorphous and crystalline regions, respectively. The rate of plastic strain in the crystalline phase is proportional to the rate of strain under macro-deformation:
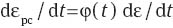
where the coefficient of proportionality φ obeys the equation:
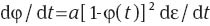
The rate of plastic strain in the amorphous phase is governed by the equation:

The function Z(t,v) in Eqs. (7), (11) obeys the equation:
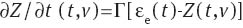
where Γ is given by Eqs. (5) and (6). Eqs. (7)–(12) with initial conditions εpa(0)=0, εpc(0)=0, φ(0)=0 and Z(0, v)=0 involve four material constants: E stands for the Young’s modulus, a denotes the rate of plastic flow in the crystalline phase, S characterizes the rate of plastic flow in the amorphous phase and R is a dimensionless measure of interchain interaction.
To find these quantities, we approximate the stress-strain diagrams reported in Figures 3 and 4. Each set of experimental data is fitted separately under the additional assumption that R=1 (which means that moduli coincide in the expressions for the strain energy density and the energy of interchain interaction).
We start with the analysis of observations in tensile tests with strain rate e=2.2×10⁻² s-1 and find E, a and S that ensure the best fit of experimental data (a and S are calculated by the nonlinear regression method and E is determined by the least-squares technique). Integration over time is performed by the Runge-Kutta method with step Δt=10-2 s. Afterwards, we fix the Young’s moduli E (listed in Table 1) and approximate stress-strain diagrams in tensile tests with the other strain rates by means of two parameters, a and S, only.
Figures 3 and 4 show good agreement between the experimental data and the results of numerical analysis. The effect of strain rate e on rates of plastic flow a and S is illustrated in Figure 12. The data are approximated by the equations:
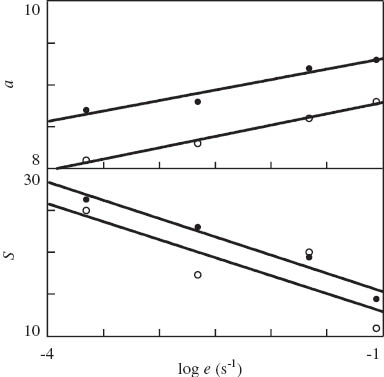
Parameters a, S vs. strain rate e. Symbols: treatment of observations in tensile tests on neat polypropylene (PP) (○) and PP/styrene-(ethylene-butylene)-styrene copolymer (SEBS) blend (•). Solid lines: approximation of the data by Eq. (13) with a0=9.06, a1=0.27, S0=8.62, S1=4.29 (PP), a0=9.56, a1=0.25, S0=10.9, S1=4.36 (PP/SEBS).
with coefficients calculated by the least-squares method. The accuracy of fitting is evaluated by the coefficient R2 which equals 0.988 (PP) and 0.942 (PP/SEBS) for coefficient a and 0.699 (PP) and 0.957 (PP/SEBS) for parameter S.
The following conclusions are drawn from Table 1 and Figure 12: (i) blending of PP with SEBS leads to a decrease in the Young’s modulus E by 12% and an increase in rates of plastic flow in the amorphous phase (S grows by 26%) and the crystalline phase (a increases by 6%) and (ii) acceleration of plastic flow under tension is practically independent of the rate of stretching e.
3.3 Cyclic tests
Finally, we approximate the stress-strain diagrams under stretching, retraction and reloading in cyclic tests with various maximum strains εmax.
The mechanical response of the equivalent medium under cyclic loading is described by Eqs. (7)–(12), where parameters a, R and S adopt different values aj, Rj and Sj under tension (j=1), retraction (j=2) and reloading (j=3). The quantities a1=a, R1=1 and S1=S are taken from the analysis of observations in tensile tests (Figures 3 and 4). The coefficients a2, R2 and S2 and a3, R3=1 and S3 are calculated from the best-fit condition by matching observations under retraction and reloading, respectively (Figure 7).
Results of numerical simulation are depicted in Figure 7, which reveals that the model describes correctly the experimental data: the maximum discrepancy between the observations and the results of simulation is <3%.
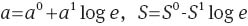
The effect of plastic strain εp=εpa+εpc at the instant when retraction starts on a2, R2 and S2 is illustrated in Figure 13. The data are approximated by the equations:
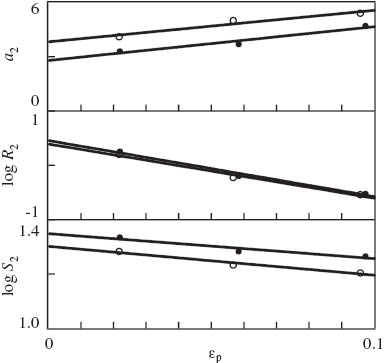
Parameters a2, R2, S2 vs. plastic strain εp. Symbols: treatment of observations under retraction on neat polypropylene (PP) (○) and PP/styrene-(ethylene-butylene)-styrene copolymer (SEBS) blend (•). Solid lines: approximation of the data by Eq. (13) with

with coefficients calculated by the least squares method. The accuracy of fitting is characterized by the coefficient R2, which reads 0.939, 0.986 and 0.966 (PP) and 0.951, 0.989 and 0.922 (PP/SEBS) for a2, R2 and S2, respectively.
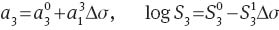
Parameters a3 and S3 are plotted vs. stress increment Δσ=σmax-σmin in Figure 14, where the data are matched by the equations:
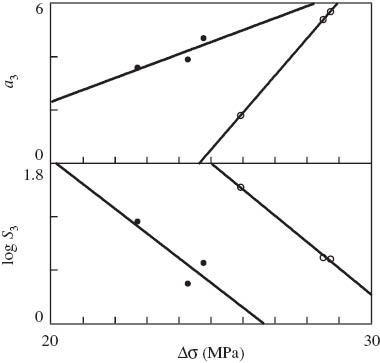
Coefficients a3, S3 vs. stress increment Δσ. Symbols: treatment of observations under reloading on neat polypropylene (PP) (○) and PP/styrene-(ethylene-butylene)-styrene copolymer (SEBS) blend (•). Solid lines: approximation of the data by Eq. (15) with
with coefficients determined by the least-squares technique. The coefficient of determination R2 equals 0.999, 0.997 (PP) and 0.727, 0.712 (PP/SEBS) for a3 and S3, respectively.
The following conclusions are drawn from Figures 13 and 14: (i) under retraction, blending of PP with SEBS results in slowing down of plastic flow in the crystalline phase (a2 decreases by 37%) and weak acceleration of plastic flow in the amorphous phase (S2 increases by 5%); these changes are not affected by εmax and (ii) under reloading, due to the presence of the impact modifier, the rate of plastic strain in the crystalline phase a3 grows by several times, whereas the rate of plastic strain in the amorphous phase S3 decreases by an order of magnitude.
To verify Eqs. (14) and (15), numerical integration of the stress–strain relations is conducted for cyclic tests with maximum strains εmax=0.04, 0.08, 0.12 and 0.16 that differ from those used in the experimental investigation. Results of simulation are reported in Figure 15, which shows that the model predicts physically plausible mechanical responses (without overshoots on the stress-strain diagrams).
Stress σ vs. strain ε. Symbols: results of numerical simulation for (A) neat polypropylene (PP) and (B) PP/styrene-(ethylene-butylene)-styrene copolymer (SEBS) blend in cyclic tests with various maximum strains εmax (○– εmax=0.16; • – εmax=0.12; * – εmax=0.08; ⋆ – εmax=0.04) and σmin=1 MPa.
4 Discussion
Analysis of observations in tensile tests demonstrates that blending of PP with 12 wt% of SEBS leads to a reduction in Young’s modulus by 12%. This conclusion appears to be in accord with the rule of mixture [25] for two reasons: (i) the elastic modulus of PP exceeds that of SEBS by an order of magnitude [28] and (ii) blending of PP with SEBS induces a decrease in its degree of crystallinity (from 55% to 51% according to DSC measurements [18]) which is accompanied by the corresponding decay in the elastic modulus.
Fitting of observations in relaxation tests shows that the only parameter affected by the presence of an impact modifier is the rate of relaxation γ that decreases by 40%. This result may be attributed to the fact that immiscible inclusions of SEBS prevent rearrangement of PP chains located in their close vicinity.
Approximation of experimental data in cyclic tests reveals an acceleration of plastic flow in the amorphous phase under tension (S1 grows by 26%) and retraction (S2 increases by 5%) induced by blending. This result may be attributed to the appearance of an additional mechanism of sliding, when junctions between chains slip with respect to the boundaries of microdomains formed by SEBS inclusions. Due to the presence of the impact modifier, the rate of plastic deformation in the crystalline phase increases under loading (a1 grows by 6%) and decreases under retraction (a2 is reduced by 37%), which may be explained by a decay in the degree of crystallinity and changes in the interplanar distances of crystallites [18].
Observations in cyclic tests show that blending of immiscible PP and SEBS does not affect parameter R responsible for interchain interaction in the amorphous matrix of PP. This conclusion is confirmed by atomic force microscopy observations [19] that reveal formation of isolated SEBS domains (the latter implies that SEBS cannot influence interactions between PP chains located outside of these domains).
5 Conclusions
A thorough investigation has been performed of the mechanical response of neat PP and the PP/SEBS blend with a fixed concentration of impact modifier (12 wt%) that involved impact tests, uniaxial tensile tests with various strain rates, relaxation tests with various strains and cyclic tests with a mixed deformation program and various maximum strains per cycle.
It is demonstrated that blending of PP with SEBS results in a pronounced (by several times) increase in strain to break and dissipated energy under impact tests. Enhancement of impact resistance is accompanied by a decay in relaxation rate and a decrease in residual strains under low-speed deformation.
A constitutive model is reported in viscoelastoplasticity of semicrystalline polymers, and its adjustable parameters are found by fitting the observations. A semicrystalline polymer is treated as an equivalent heterogeneous transient network of chains bridged by temporary junctions. Its viscoelastic response is attributed to rearrangement of chains, separation of active strands from their junctions and attachment of dangling strands to the network. The viscoplastic behavior is associated with slippage of junctions with respect to their reference positions. The plastic strain is split into the sum of two components that reflect sliding processes in amorphous and crystalline phases. The constitutive equations are presented for the isothermal response at small strains.
Changes of mechanical properties of PP are correlated with evolution of its microstructure and crystalline morphology driven by blending with SEBS. In particular, (i) the reduction of elastic modulus is attributed to a decrease in the degree of crystallinity of PP, (ii) a decrease in relaxation rate reflects a slowing down of rearrangement of chains located in the close vicinity of immiscible inclusions of SEBS, whereas (iii) the decay of residual strains is associated with changes in the rate of plastic flow in the amorphous phase, induced by sliding of chains along the boundaries of SEBS inclusions.
Acknowledgments
Financial support by the EU Commission through Project Evolution-314744 (FP7 Program) is gratefully acknowledged.
References
[1] Grein C, Bernreitner K, Hauer A, Gahleitner M, Neissl W. J. Appl. Polym. Sci. 2003, 87, 1702–1712.Search in Google Scholar
[2] Zhang C, Shangguan Y, Chen R, Wu Y, Chen F, Zheng Q, Hu G. Polymer 2010, 51, 4969–4977.10.1016/j.polymer.2010.08.021Search in Google Scholar
[3] Grein C, Gahleitner M, Bernreitner K. Express Polym. Lett. 2012, 6, 688–696.Search in Google Scholar
[4] Svoboda P, Theravalappil R, Svobodova D, Mokrejs P, Kolomaznik K, Mori K, Ougizawa T, Inoue T. Polym. Testing 2010, 29, 742–748.10.1016/j.polymertesting.2010.05.014Search in Google Scholar
[5] Tang W, Tang J, Yuan H, Jin R. J. Appl. Polym. Sci. 2011, 122, 461–468.Search in Google Scholar
[6] Liu G, Zhang X, Liu C, Chen H, Walton K, Wang D. J. Appl. Polym. Sci. 2011, 119, 3591–3597.Search in Google Scholar
[7] Geng C, Su J, Han S, Wang K, Fu Q. Polymer 2013, 54, 3392–3401.10.1016/j.polymer.2013.04.048Search in Google Scholar
[8] Reinholds I, Kalkis V, Zicans J, Merijs-Meri R, Grigalovic A. Key Eng. Mater. 2013, 559, 93–98.Search in Google Scholar
[9] Lee YK, Lee HK, Yoo TW, Yoon HG, Kim WN. J. Appl. Polym. Sci. 2013, 127, 1416–1422.Search in Google Scholar
[10] Gupta AK, Purwar SN. J. Appl. Polym. Sci. 1984, 29, 3513–3531.Search in Google Scholar
[11] Setz S, Stricker F, Kressler J, Duschek T, Muhlhaupt R. J. Appl. Polym. Sci. 1996, 59, 1117–1128.Search in Google Scholar
[12] Abreu FOMS, Forte MMC, Liberman SA. J. Appl. Polym. Sci. 2005, 95, 254–263.Search in Google Scholar
[13] Matsuda Y, Hara M, Mano T, Okamoto K, Ishikawa M. Polym. Eng. Sci. 2005, 95, 1630–1638.Search in Google Scholar
[14] Mae H, Omiya M, Kishimoto K. J. Appl. Polym. Sci. 2008, 110, 3941–3953.Search in Google Scholar
[15] Fanegas N, Gomez MA, Jimenez I, Marco C, Garcia-Martinez JM, Ellis G. Polym. Eng. Sci. 2008, 48, 80–87.Search in Google Scholar
[16] Antunes CF, Van Duin M, MacHado AV. Mater. Chem. Phys. 2012, 133, 410–418.Search in Google Scholar
[17] Xu H, Zhang Y, Yang J, Ye L, Wu Q, Qu B, Wang Q, Wang Z. Polym. Chem. 2013, 4, 3028–3038.Search in Google Scholar
[18] Vuluga Z, Panaitescu DM, Radovici C, Nicolae C, Iorga MD. Polym. Bull. 2012, 69, 1073–1091.Search in Google Scholar
[19] Panaitescu DM, Vuluga Z, Radovici C, Nicolae C. Polym. Testing 2012, 31, 355–365.10.1016/j.polymertesting.2011.12.010Search in Google Scholar
[20] Panaitescu DM, Vuluga Z, Notingher PV, Nicolae C. Polym. Eng. Sci. 2013, 53, 2081–2092.Search in Google Scholar
[21] Drozdov AD. Int. J. Solids Struct. 2011, 48, 2026–2040.Search in Google Scholar
[22] Drozdov AD, Christiansen JdeC. Mech. Time-Depend. Mater. 2012, 16, 397–425.Search in Google Scholar
[23] Drozdov AD, Klitkou R, Christiansen JdeC. Mech. Mater. 2013, 56, 53–64.Search in Google Scholar
[24] Veenstra H, Verkooijen PCJ, Van Lent BJJ, Van Dam J, De Boer AP, Nijhof APHJ. Polymer 2000, 41, 1817–1826.10.1016/S0032-3861(99)00337-7Search in Google Scholar
[25] Liang J-Z, Ma W-Y. J. Polym. Eng. 2012, 32, 343–348.Search in Google Scholar
[26] Bouchart V, Bhatnagar N, Brieu M, Ghosh AK, Kondo D. C.R. Mecanique 2008, 336, 714–721.10.1016/j.crme.2008.06.004Search in Google Scholar
[27] Bouchart V, Brieu M, Bhatnagar N, Kondo D. Int. J. Solids Struct. 2010, 47, 1737–1750.Search in Google Scholar
[28] Caro-Bretelle AS, Ienny P, Leger R. Polymer 2013, 54, 4594–4603.10.1016/j.polymer.2013.06.006Search in Google Scholar
©2014 by De Gruyter
Articles in the same Issue
- Frontmatter
- Original articles
- Kinetic degradation and storage stability of β-carotene encapsulated by spray drying using almond gum and gum arabic as wall materials
- Photo-polymerization of methacrylate based polymer electrolyte for dye-sensitized solar cell
- Synthesis and characterization of novel hydroxyl-terminated hyperbranched polyurethanes
- Electron beam modified nylon 6-clay nanocomposites: morphology and water absorption behavior
- The effect of ultraviolet irradiation and temperature on the resilience of high density polyethylene
- Polyaminoamide dendrimers surface-modified with anionic terminal groups for use as calcium carbonate scale inhibitors
- Technical feasibility of a new approach to electromagnetic interference (EMI) shielding of injection molded parts using in-mold coated (IMC) nanopaper
- Study on crystallization performance of polyethylene terephthalate/polybutylene terephthalate alloys
- Numerical study of polymer melt flow in a three-dimensional sudden expansion: viscous dissipation effects
- Enhancement of mechanical properties of polypropylene by blending with styrene-(ethylene-butylene)-styrene tri-block copolymer
- Development and fabrication of cement reinforced polypropylene composite material spur gear