Fluorescence lifetime imaging with near-infrared dyes
-
Wolfgang Becker


Abstract
Near-infrared (NIR) dyes are used as fluorescence markers in small animal imaging and in diffuse optical tomography. In these applications it is important to know whether the dyes bind to proteins or to other tissue constituents, and whether their fluorescence lifetimes depend on the targets they bind to. Unfortunately, neither the optical beam paths nor the detectors of commonly used in confocal and multiphoton laser scanning microscopes (LSMs) directly allow for excitation and detection of NIR fluorescence. This paper presents three ways of adapting existing LSMs with time-correlated single photon counting (TCSPC) fluorescence lifetime imaging (FLIM) systems for NIR FLIM: 1) confocal systems with wideband beamsplitters and diode laser excitation, 2) confocal systems with wideband beamsplitters and one-photon excitation by titanium-sapphire lasers, and 3) two-photon systems with optical parametric oscillator (OPO) excitation and non-descanned detection. A number of NIR dyes are tested in biological tissue. All of them show clear lifetime changes depending on the tissue structures they are bound to. We therefore believe that NIR FLIM can deliver supplementary information about the tissue composition and on local biochemical parameters.
Zusammenfassung
Nahinfrarot (NIR)-Farbstoffe werden als Fluoreszenzmarker in der Kleintierbildgebung und optischen Tomographie eingesetzt. Für diese Anwendungen ist es von Bedeutung, ob die Farbstoffe an Proteine oder andere Gewebebestandteile anbinden, und ob die Fluoreszenz-Abklingzeiten von den Bindungspartnern abhängen. Leider sind weder die Strahlengänge noch die Detektoren der üblicherweise verwendeten konfokalen oder Multiphoton-Laser-Scanning-Mikroskope zur Anregung und Detektion von NIR-Fluoreszenzsignalen geeignet. Der vorliegende Artikel beschreibt drei Wege zur Anpassung existierender Laser-Scanning-Mikroskope mit Systemen, die die zeitkorrelierte Einzelphotonenzählung (TCSPC) mit der Fluoreszenzabklingzeit-Mikroskopie (FLIM) zur NIR-FLIM kombinieren: 1) konfokale Systeme mit Breitband-Strahlteilern und Diodenlasern, 2) konfokale Systeme mit Breitband-Strahlteilern und Ein-Photonen-Anregung mittels Titan-Saphir-Lasern, und 3) Zwei-Photonen-Systeme mit einer sogenannten Optisch-Parametrischen-Oszillator (OPO)-Anregung und Non-Descanned-Detektion. Es werden Testergebnisse für verschiedene NIR-Farbstoffe in biologischem Gewebe präsentiert. Alle Farbstoffe zeigen klare Änderungen der Fluoreszenz-Abklingzeit in Abhängigkeit von den Gewebestrukturen, an denen die Bindung erfolgte. Die Ergebnisse lassen daher vermuten, dass mittels NIR-FLIM ergänzende Informationen über die Zusammensetzung und den biochemischen Zustand des Gewebes gewonnen werden können.
1 Motivation for using near-infrared fluorescence lifetime imaging
Near-infrared (NIR) dyes are used as contrast agents and as fluorophores in diffuse optical imaging applications [1–5]. Diffuse optical imaging (or diffuse optical tomography, DOT) reconstructs internal structures and scattering and absorption parameters of tissue from diffusely transmitted or reflected photons. By using wavelengths between 650 and 900 nm information about the tissue composition can be obtained up to a depth of several centimeters. For these applications it is important to have information about binding of the dyes to proteins, deoxyribonucleic acid (DNA), collagen, and other cell constituents available. It is also important to know whether the dyes change their fluorescence lifetimes on binding, and whether these lifetime changes depend on the binding targets [6, 7]. Possible lifetime changes may interfere with the reconstruction of the tissue structure and tissue parameters from time-resolved data, but may also be exploitable to gain additional biological information [8]. Moreover, the penetration depth – even for a confocal system – can be expected to be noticeably higher in the NIR than for excitation and detection in the visible (VIS) range of the optical spectrum. The aim of this paper is to show how NIR fluorescence lifetime imaging (NIR FLIM) can be performed with existing FLIM systems and laser scanning microscopes (LSMs), and to explore the fluorescence decay behavior of a few commonly used NIR dyes in biological tissue.
2 FLIM technique
2.1 Principles
There are a number of techniques to detect the fluorescence lifetime, and to combine fluorescence lifetime detection with imaging [4, 9]. For recording fluorescence images of internal structures of biological tissue, it is mandatory that an imaging technique is used with optical sectioning capability, i.e. suppression of out-of-focus light. The only technique that suppresses out-of-focus light without impairing the detection efficiency for in-focus signals is confocal [10, 11] or multiphoton laser scanning [10–14]. That means that the FLIM technique must be compatible with LSMs, and with the fast scanning used in these instruments.
The fluorescence lifetimes of NIR dyes are generally short, and the fluorescence decay functions in a biological environment become multi-exponential [4, 15, 16]. The FLIM technique must therefore have a high time resolution, and must be able to resolve the decay profiles into several exponential components. Moreover, most NIR dyes have only limited photostability. The FLIM technique should therefore achieve high photon efficiency, i.e. high lifetime accuracy, for a given number of detected photons [15–18]. These requirements are almost perfectly met by multidimensional time-correlated single photon counting (TCSPC) in combination with confocal or multiphoton laser scanning [19].
The basic architecture of a TCSPC FLIM system is shown in Figure 1. The technique is based on scanning the sample by a high-repetition rate laser beam and the detection of single photons of the fluorescence signal. Each photon is characterized by its time in the laser period, and the spatial position of the laser beam in the moment when the photon was detected. The recording process builds up a photon distribution over these parameters [19–21]. The result can be interpreted as an array of pixels, each containing a fluorescence decay function, in a large number of consecutive time channels. The photon distribution can be extended by additional parameters [19, 21], such as the wavelength of the photons [22], the time from a single [23, 24] or periodic [25] stimulation of the sample, the depth in the sample during z-stack recording [24], or the time in an additional modulation period of the laser for phosphorescence lifetime imaging [26].
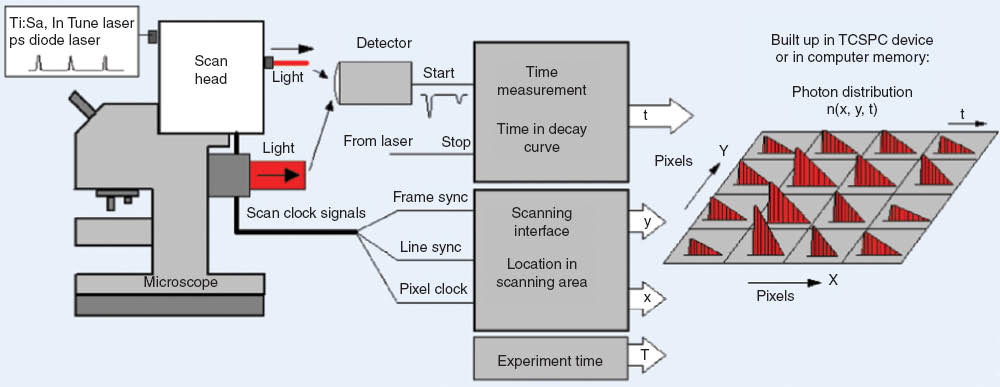
Multidimensional time-correlated single photon counting (TCSPC) architecture for fluorescence lifetime imaging.
Similar to the classic TCSPC technique [27], the time resolution of TCSPC FLIM is excellent. The resolution depends only on the transit time jitter of the photon pulses in the detector and not on the width of these pulses. For the fastest detectors, the width of the instrument response function can be as short as 25 ps [19, 27]. Another advantage of TCSPC FLIM is that it works at the high scan rates used in LSMs. When a photon is detected it is simply put in a memory location according to its time in the laser pulse period and the location of the laser beam in the scan area. The signal-to-noise ratio (SNR) of the result does not depend on the scan rate but only on the total acquisition time. The recording process is simply continued over a sufficiently large number of frames to achieve the desired SNR. The TCSPC FLIM results are normally displayed as pseudo-color images. The brightness represents the number of photons per pixel. The color can be assigned to any parameter of the decay profile: The lifetime of a single-exponential approximation of the decay, the lifetime or the amplitude of a component of a multi-exponential decay, the average lifetime of a multi-exponential decay, or ratios of these parameters [21, 28, 29].
2.2 Technical limitations
At first glance, TCSPC FLIM at NIR wavelengths should neither be a problem on the detection nor on the excitation side. Single-photon detection in the 700–900 nm range can be achieved by hybrid detectors or photomultiplier tubes with GaAs cathodes, or with single-photon avalanche photodiodes. The TCSPC FLIM electronics work equally well with all these detectors [21]. Picosecond (ps) diode lasers for the red and NIR range are available with 640 nm, 685 nm, and 785 nm, the Intune laser of the Zeiss LSM 710/780 microscope can be tuned up to 645 nm, and super-continuum lasers with acousto-optical filters deliver any wavelength from the VIS range to more than 1000 nm. Multiphoton microscopes have a titanium sapphire (Ti:Sa) laser that operates from about 700 nm to 1000 nm. The wavelengths available from these light sources are compatible with the (one-photon) excitation spectra of a wide variety of NIR dyes.
It is therefore often believed that NIR FLIM requires nothing other than an NIR-sensitive detector and an NIR laser of appropriate wavelength. Unfortunately, this is not correct. The problem is in the main dichroic beamsplitter optics of the LSM. A combination of a ‘normal confocal’ with an NIR laser is shown in Figure 2A. It does not work because the main dichroic beamsplitter does not reflect the laser down to the sample. It cannot do so because it is designed to transmit the fluorescence signal from the VIS range all the way up to the NIR. The attempt to use the Ti:Sa laser of a multiphoton microscope as a conventional (one-photon) excitation source is shown in Figure 2B. This configuration is not appropriate for NIR imaging as well. The main dichroic beamsplitter is designed to transmit fluorescence at the short-wavelength side of the laser. However, the one-photon excited NIR fluorescence is on the long wavelength side. The beamsplitter therefore does not transmit the fluorescence to the detector. The third system, shown in Figure 2C, is configured in such a way to excite the fluorescence by two-photon excitation. This configuration without any changes in the microscope is also not suitable. The beamsplitter is designed to reflect the laser from about 700 nm, all the way up to >1000 nm. Consequently, it does not transmit the fluorescence.

Beamsplitter configurations in laser scanning microscopes. (A) Confocal, the NIR laser is not reflected to the sample. (B) Ti:Sa laser of multiphoton microscope used for one-photon (1p) excitation in the NIR, the fluorescence is not transmitted to the detector. (C) Two-photon (2p) excitation, the fluorescence is not transmitted to the detector.
2.3 Solutions to NIR FLIM
A possible way to solve these problems is to use a wideband beamsplitter. This is a semi-transparent mirror that splits the light into two components, independent of the wavelength. Many microscopes have a ‘20/80’ (20% reflection, and 80% transmission in a wide spectral range) beamsplitter in their beamsplitter wheels. With this beamsplitter the confocal set-up works both with an NIR laser and with the Ti:Sa laser (used for one-photon excitation), see Figure 3A and B. One disadvantage is that the wideband beamsplitter loses light. However, this is less problematic than is commonly believed and FLIM is normally performed with a tiny fraction of the available laser power. A loss of 80% in excitation power is therefore insignificant, and a 20% loss in the detection path can be tolerated. For the experiments described in this paper, 20/80 and 30/70 wideband beamsplitters from Chroma Technology Corp. (types 21008, 21009) were used.

Solutions to NIR FLIM. (A) Confocal system with 30/70 wideband beamsplitter. (B) Multiphoton system with 20/80 wideband beamsplitter, but Ti:Sa laser used for one-photon (1p) excitation. (C) Multiphoton system with two-photon (2p) excitation by optical parametric oscillator (OPO) and non-descanned detection.
The configuration in Figure 3C uses two-photon excitation and non-descanned detection. TCSPC FLIM in this optical configuration has already been demonstrated by Yazdanfar et al. [30]. The fluorescence light is split off by a dichroic mirror in the filter carousel directly behind the microscope lens and projected on a large area detector [21]. Of course, the mirror normally inserted in this place cannot be used – it is designed to transmit laser radiation from 700 nm up to >1000 nm and therefore does not reflect the fluorescence. However, replacing the dichroic mirror in the filter carousel is easy. The problem of the configuration of Figure 3C is that a femtosecond laser of long wavelength is needed to excite NIR dyes efficiently [30]. This is usually an optical parametric oscillator (OPO) pumped by a Ti:Sa laser. The advantage of using OPO, compared to ps diode lasers, or the one-photon Ti:sapphire laser, is the deeper penetration depth inside tissue due to the lower scattering coefficient at longer wavelengths. However, compared to one-photon systems, NIR FLIM based on OPO results in a slightly worse spatial resolution of the images due to the longer wavelengths used and the cost of such a system is higher.
3 Materials and methods
3.1 Optical systems
FLIM images were recorded in the three configurations described before:
Confocal system, one-photon excitation with a picosecond diode laser (Figure 3A): FLIM images were obtained by the Becker & Hickl DCS-120WB confocal FLIM system [28] with ps diode laser excitation and a wideband 30/70 beamsplitter. The scanner was attached to a Nikon TU2000 microscope. Single photon fluorescence from the sample was collected through a Nikon S Fluor 40×/1.3 oil objective. Photons were detected by a Becker & Hickl HPM 100-50 hybrid detector [21, 31] and recorded by the Simple-Tau 150 TCSPC system [29]. Residual excitation light was removed by long-pass filter HQ655lp (Chroma Technology Corp.).
Confocal system, one-photon excitation by Ti:Sa laser (Figure 3B): To test this configuration the Zeiss LSM 710 NLO multiphoton microscope with Zeiss Plan-Apochromate 63×/1.4 oil objective was used for one-photon excitation at a wavelength of 780 nm. The photons were detected by the HPM 100-50 hybrid detector, and the FLIM data were recorded by the Simple-Tau 150 FLIM system. The detector was attached to a BiG-type confocal output port of the LSM 710 scan head. Scattered laser light was suppressed by HQ800lp long-pass filter (Chroma Technology Corp.) in front of the HPM 100-50 hybrid detector. Despite of the 80% loss in the 20/80 beamsplitter, the excitation power in the sample was so high that it caused severe photobleaching even when the power was turned down to <1% by the acousto-optic modulator of the microscope. Therefore, an additional attenuator was inserted in the laser beam path.
Two-photon FLIM with OPO excitation (Figure 3C): The images presented in this configuration were recorded by a Zeiss LSM 710 NLO multiphoton microscope with OPO excitation and Zeiss Plan-Apochromate 63×/1.4 oil objective. A HPM 100-50 hybrid detector was attached to the non-descanned output of the microscope [29]. An ET880sp filter (Chroma Technology Corp.) was used to suppress fundamental wavelength from OPO. The data were recorded by the Simple-Tau 150 FLIM system.
3.2 Near-infrared fluorophores and preparation of tissue
Three near-infrared dyes, indocyanine green (ICG), 3,3′-diethylthiatricarbocyanine (DTTCI), and methylene blue (MB), were purchased from Sigma-Aldrich and used without further purification. These dyes were selected for their biocompatibility and their ability to absorb and emit light in the NIR wavelength window.
Fresh pig skin was treated with 5 μM DTTCI, 30 μM ICG and MB solutions, and imaging experiments were carried out at room temperature.
4 Results
4.1 Confocal system, one-photon excitation with a picosecond diode laser
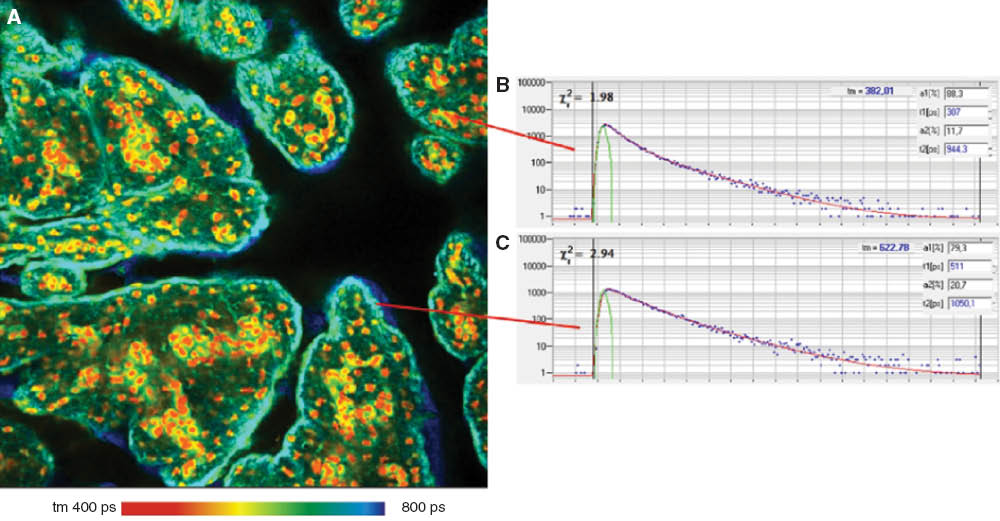
A corresponding image of pig skin stained with ICG is shown in Figure 4A. The image is from a focal plane about 20 μm below the top of the skin. ICG has an absorption maximum of around 780 nm. At concentrations >50 μM/l, ICG forms aggregates which have an absorption maximum at 690 nm. The fluorescence is emitted at around 820 nm [32]. The small Stokes shift between the absorption and the emission makes it difficult to suppress the scattered laser light and wideband spectral background of the diode laser. Fortunately, ICG has sufficient absorption down to 630 nm. Therefore, the 640 nm BDL-SMC ps diode laser (Becker & Hickl) was used for the experiments. This provided convenient spacing between the excitation and emission wavelengths, and solved any filter leakage problems.
![Figure 4 Pig skin sample stained with ICG. Lifetime image about 20 μm from the top of the skin (A) and decay curves in different areas of the image (B and C). Fit with double-exponential model, amplitude-weighted lifetime.FLIM images were obtained by the DCS-120WB confocal FLIM system (Becker & Hickl GmbH) with ps diode laser excitation and a 30/70 wideband beamsplitter. The photons were detected by a HPM 100-50 hybrid detector (Becker & Hickl GmbH). Data analysis with Becker & Hickl SPCImage [21, 29]. FLIM data format 512×512 pixels, 256 time channels.](/document/doi/10.1515/plm-2014-0017/asset/graphic/plm-2014-0017_fig4.jpg)
Pig skin sample stained with ICG. Lifetime image about 20 μm from the top of the skin (A) and decay curves in different areas of the image (B and C). Fit with double-exponential model, amplitude-weighted lifetime.
FLIM images were obtained by the DCS-120WB confocal FLIM system (Becker & Hickl GmbH) with ps diode laser excitation and a 30/70 wideband beamsplitter. The photons were detected by a HPM 100-50 hybrid detector (Becker & Hickl GmbH). Data analysis with Becker & Hickl SPCImage [21, 29]. FLIM data format 512×512 pixels, 256 time channels.
There are surprisingly large changes in the fluorescence lifetime throughout the sample. Two fluorescence decay functions from selected spots with the corresponding decay parameters are shown in Figure 4B and C. It is known that ICG has a lifetime of about 200 ps in water, and about 600 ps when bound to serum albumin [32–34]. In the short-lifetime regions (yellow-orange in Figure 4A) the lifetimes of the decay components are 231 ps and 576 ps (Figure 4C). This is marginally compatible with a mixture of bound and unbound ICG. In the long-lifetime areas (blue-green in Figure 4A) the fit delivers decay components with lifetimes of 470 ps and 833 ps (Figure 4B). This is clearly incompatible with a simple mixture of bound and unbound ICG, and may be an effect of the aggregation of the ICG. However, in that case it should be observed at the edge of the tissue where the staining concentration is high.
Even though the reasons for the lifetime changes are unknown, the results show that the assumption of an invariable fluorescence lifetime of ICG in biological systems is not correct. The variability may have an impact on the reconstruction of tissue parameters in diffuse optical imaging experiments.
An image of a pig skin sample stained with DTTCI is shown in Figure 5A. The incubation time was 12 h. The spectral properties of DTTCI are very similar to those of ICG. There is an absorption peak at 760 nm, and a blue-shifted one at 670 nm. The intensity of the peaks depends on the environment, in particular on the binding to biological targets [35]. Figure 5A shows that there is not only excellent contrast in the image, but also significantly different fluorescence lifetime in different tissue structures. Decay curves in selected pixels are shown in Figure 5B and C. A double-exponential fit delivered amplitude-weighted lifetimes from about 960 ps to 1530 ps (Figure 5A), with component lifetimes from 780 ps to 2620 ps (Figure 5B and C).

Pig skin sample stained with DTTCI. Lifetime image (A) and decay curves at selected spots of the image (B and C). FLIM images were obtained by the same system as for Figure 4 (excitation 650 nm, detection 680–900 nm).
What the mechanism of the lifetime variation is, and under exactly which tissue parameters the lifetime reacts must be verified by further experiments.
4.2 Confocal system, one-photon excitation by Ti:Sa laser
The corresponding FLIM images in this configuration are shown in Figure 6. The excitation wavelength was 780 nm, and the detection wavelength interval ranged from 800 nm to 900 nm. Figure 6A is from a pig skin sample stained with ICG. Although the tissue structure is different, the general lifetime signature is the same as in Figure 4A. Also these images show large lifetime differences. However, the behavior for DTTCI in Figure 6B is not exactly the same as in Figure 5A. It can be assumed that this is a result of the incubation time; the sample in Figure 5 was incubated for 12 h and the sample in Figure 6 for only 20 min. To check that the dye had not fully diffused into the tissue and was not entirely bound to the tissue constituents within 20 min, a set of experiments were performed on lifetime measurements with respect to the incubation times. It was found that the amplitude-averaged fluorescence lifetime had been continuously reduced from 2.1 ns for 20 min incubation time, to 1.8 ns, 1.7 ns, and 1.5 ns lifetimes for 2, 4, and 8 h incubation times, respectively (not shown). Slow binding was observed for other carbocyanines [36] and thus can be expected also for DTTCI.
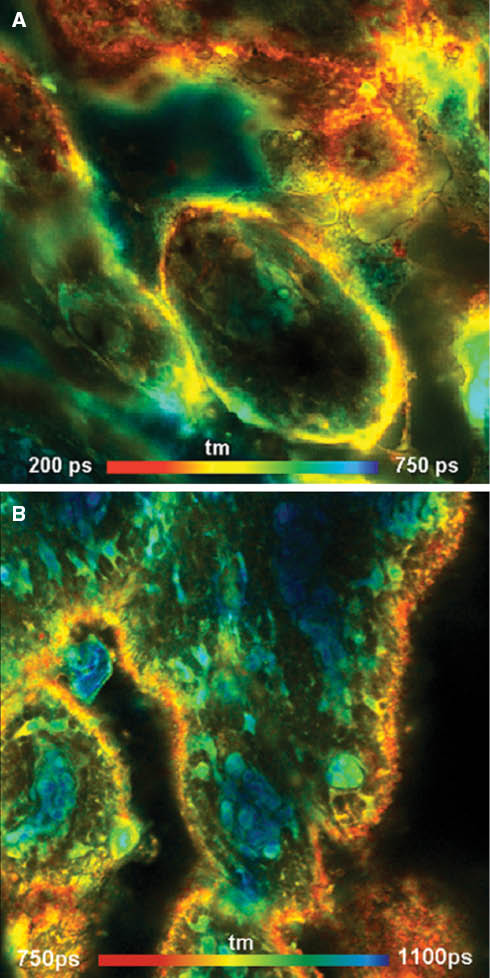
Pig skin sample stained with ICG (A) and DTTCI (B). A Zeiss LSM 710 NLO multiphoton microscope and a Ti:Sa laser were used for one-photon excitation at a wavelength of 780 nm. The photons were detected by a HPM 100-50 hybrid detector (Becker & Hickl; detection wavelength range 800–900 nm), and the FLIM data were recorded by a the Simple-Tau 150 FLIM system (Becker & Hickl GmbH). Lateral size of the images 212×212 μm, depth about 30 μm from surface. Note the high contrast of the images.
4.3 Two-photon FLIM with optical parametric oscillator excitation
Figure 7 shows a corresponding image obtained from pig skin stained with MB. MB is a biomedically interesting compound. It has anti-viral and anti-bacterial effects, and it has been evaluated as a drug against malaria [37]. It has also been applied to induce apoptosis in cancer cells [38], and to treat psoriatic skin lesions by photodynamic therapy [39]. The use of MB to treat Alzheimer disease has been the subject of a clinical trial [40].
Pig skin stained with methylene blue. Lifetime image (A) and decay curves in characteristic spots of the image (B and C). Fit with double-exponential model, amplitude-weighted lifetime. FLIM images were obtained after two-photon excitation at 1200 nm. Data analysis with SPCImage (Becker & Hickl GmbH). FLIM data format 512×512 pixels, 256 time channels.
The dye has an absorption band from 550 to 690 nm, with a maximum at 660 nm. Fluorescence is emitted from 650 nm to 750 nm, with a maximum at 680 nm. It can therefore be expected that two-photon excitation works well in the range from 1000 nm to 1300 nm.
A FLIM image is shown in Figure 7A. The sample was excited at 1200 nm; the fluorescence was detected from 680 nm to 780 nm. Excitation was surprisingly efficient. No more than 4% of the available OPO power was needed to obtain a count rate of the order of 1 MHz, which corresponds to the average power of about 50 μW incident on a sample. The same average power was used in one-photon experiments. Decay curves from characteristic spots are shown in Figure 7B and C. The decay profiles are multi-exponential but can be reasonably fitted by a double-exponential decay model. The amplitude-weighted lifetime in different parts of the tissue varies by almost a factor of two.
To prove that the OPO system is able to excite also dyes with longer absorption wavelengths FLIM images of a similar sample stained with ICG were recorded. The excitation was done at 1200 nm, and the fluorescence emission was detected from 780 nm to 850 nm (Figure 8). As for the MB, about 3% of the available excitation power was sufficient to obtain a count rate of the order of 1 MHz averaged over the entire image. The range of the lifetime and the variability is in agreement with FLIM data obtained by one-photon excitation; compare with Figures 4 and 6.

Pig skin stained with ICG. Two-photon excitation at 1200 nm, detection from 780 to 850 nm. Amplitude-weighted lifetime of double exponential decay. Depth from top of tissue 10 μm (A) and 40 μm (B). FLIM data format 512×512 pixels, 256 time channels.
4.4 FLIM z-stacks
To explore the depth penetration of NIR FLIM and the staining efficiency in different depths, FLIM z-stacks for the samples were recorded. The z-stacks were recorded by the mosaic imaging function of the Becker&Hickl SPCM 64-bit data acquisition software [25]. Figure 9 shows a z-stack recorded with diode laser excitation and confocal detection. The images were recorded at a depth ranging from 10 μm to 60 μm from the top of the tissue. As can be seen from these images, reasonable resolution is obtained at levels up to 50–60 μm into the tissue. A z-stack of a pig skin stained with MB taken by OPO two-photon excitation system with non-descanned detection is shown in Figure 10. Although there is a significant loss in image intensity with the imaging depth the spatial resolution remains very good down to 60 μm into the sample.

Z-stack of pig skin stained with DTTCI after excitation by a 640-nm diode laser; depth from 10 μm to 60 μm into the tissue. FLIM images were obtained by the DCS-120 confocal scanning system (Becker & Hickl GmbH).
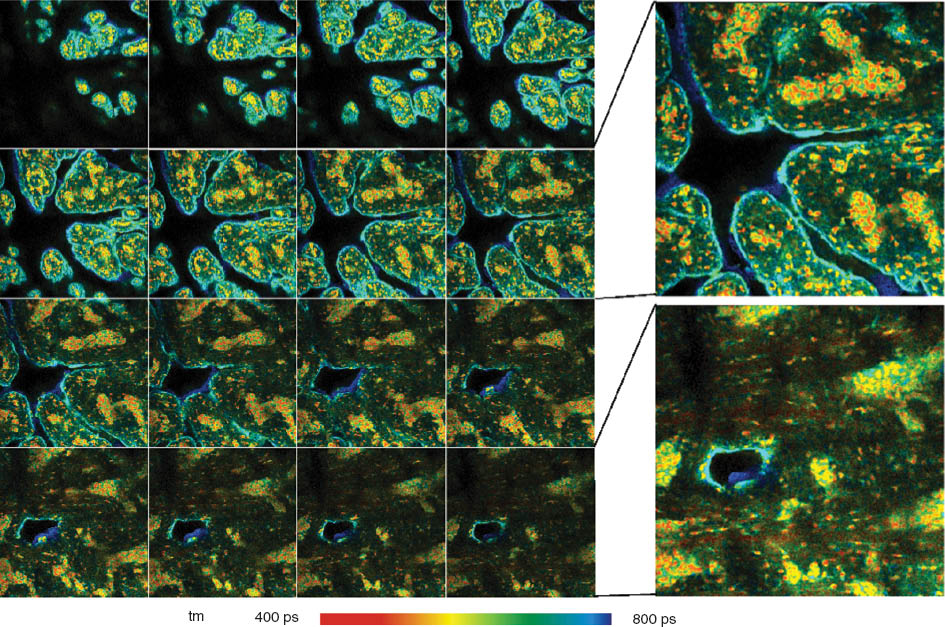
Pig skin stained with methylene blue. Z-stack recorded by mosaic FLIM with 16 planes from 0 to 60 μm from top of sample; each plane with 512×512 pixels, 256 time channels. Amplitude weighted lifetime of double exponential decay. Plane 8 (30 μm) and plane 16 (60 μm) are shown magnified and with individually adjusted intensity scale.
The z-stacks in the samples investigated show that the lifetime changes with the depth in the tissue. Similar behavior was found for the samples stained with ICG and DTTCI (not shown). It can be assumed that this is an effect of incomplete diffusion of the dyes into the tissue, and incomplete binding within the incubation time of 20 min. It is therefore indicated that the incubation conditions should be kept under close control in order to obtain reproducible lifetimes.
5 Summary
It could be shown that the existing confocal and multiphoton LSMs and TCSPC FLIM systems can be used to record fluorescence lifetime images of biological tissue stained with NIR dyes. Experiments with one-photon excitation FLIM data are obtained in high contrast and at a good penetration depth. The use of OPO for NIR FLIM allows information to be obtained about the fluorescence lifetimes of the dyes, binding to proteins deep inside the tissue. Using OPO it has been shown, that MB delivers distinctly different decay times depending on the tissue structures it binds to. Both the lifetimes of the decay components and the amplitudes change. The exact mechanism of the lifetime changes is not clear. MB shows changes in its absorption spectrum when the pH is varied. It can be expected that these are accompanied by lifetime changes. More importantly, it is known that MB is a redox indicator. It is therefore possible that the changes originate from variations in the redox potential of the proteins. If this speculation is correct, MB could be a highly potent marker for the tissue state. It was also found that there is no significant dependence of the fluorescence lifetime on the excitation wavelength. This fact may favor the use of OPOs for NIR FLIM. All the dyes tested show more or less pronounced lifetime changes on binding to the tissue constituents. New NIR fluorophores are under development [6, 7, 36]. These should be tested for environment-dependent lifetime changes and for use as possible probes for molecular environment parameters.
Acknowledgments
The research leading to these results was funded by the AiF project (KF3066501AK2). We also thank Klaus Weisshart and Oliver Holub from Carl Zeiss Jena for help with OPO experiments.
Conflict of interest statement: Dr. Wolfgang Becker is managing director of the Becker & Hickl GmbH. Dr. Vladislav Shcheslavskiy is research fellow at Becker & Hickl GmbH.
References
[1] Brambilla M, Spinelli L, Pifferi A, Torricelli A, Cubeddu R. Time-resolved scanning system for double reflectance and transmittance fluorescence imaging of diffusive media. Rev Sci Instrum 2008;79(1):013103.10.1063/1.2828054Search in Google Scholar PubMed
[2] Kepshire D, Mincu N, Hutchins M, Gruber J, Dehghani H, Hypnarowski J, Leblond F, Khayat M, Pogue BW. A microcomputed tomography guided fluorescence tomography system for small animal molecular imaging. Rev Sci Instrum 2009;80(4):043701.10.1063/1.3109903Search in Google Scholar PubMed PubMed Central
[3] Lapointe E, Pichette J, Bérubé-Lauzière Y. A multi-view time-domain non-contact diffuse optical tomography scanner with dual wavelength detection for intrinsic and fluorescence small animal imaging. Rev Sci Instrum 2012;83(6):063703.10.1063/1.4726016Search in Google Scholar PubMed
[4] Becker W. Fluorescence lifetime imaging--techniques and applications. J Microsc 2012;247(2):119–36.10.1111/j.1365-2818.2012.03618.xSearch in Google Scholar PubMed
[5] Tuchin V. Tissue optics: light scattering methods and instruments for medical diagnostics, 2nd edition. Bellingham: SPIE Press; 2007.Search in Google Scholar
[6] Berezin MY, Lee H, Akers W, Achilefu S. Near infrared dyes as lifetime solvatochromic probes for micropolarity measurements of biological systems. Biophys J 2007;93(8):2892–9.10.1529/biophysj.107.111609Search in Google Scholar PubMed PubMed Central
[7] Berezin MY, Akers WJ, Guo K, Fischer GM, Daltrozzo E, Zumbusch A, Achilefu S. Long fluorescence lifetime molecular probes based on near infrared pyrrolopyrrole cyanine fluorophores for in vivo imaging. Biophys J 2009;97(9):L22–4.10.1016/j.bpj.2009.08.022Search in Google Scholar PubMed PubMed Central
[8] Gannot I, Ron I, Hekmat F, Chernomordik V, Gandjbakhche A. Functional optical detection based on pH dependent fluorescence lifetime. Lasers Surg Med 2004;35(5):342–8.10.1002/lsm.20101Search in Google Scholar PubMed
[9] Becker W, Bergmann A. Lifetime-resolved imaging in nonlinear microscopy. In: Masters BR, So PTC, editors. Handbook of biomedical nonlinear optical microscopy. New York: Oxford University Press, Inc.; 2008, p. 499–556.Search in Google Scholar
[10] Cox G. Optical imaging techniques in cell biology. Boca Raton: CRC Press; 2012.10.1201/b12135Search in Google Scholar
[11] Pawley JB, editor. Handbook of biological confocal microscopy, 3rd edition. New York: Springer Science + Business Media, LLC; 2006.10.1007/978-0-387-45524-2Search in Google Scholar
[12] Diaspro A, editor. Confocal and two-photon microscopy: foundations, applications and advances. New York: Wiley-Liss, Inc.; 2001.Search in Google Scholar
[13] König K. Multiphoton microscopy in life sciences. J Microsc 2000;200(Pt 2):83–104.10.1046/j.1365-2818.2000.00738.xSearch in Google Scholar PubMed
[14] So PTC, Kim KH, Hsu L, Dong CY, Kaplan P, Hacewicz T, Greuter U, Schlumpf N, Buehler C. Two-photon microscopy of tissues. In: Mycek M-A, Pogue BW, editors. Handbook of biomedical fluorescence. New York, Basel: Marcel Dekker, Inc.; 2003, p. 181–208.10.1201/9780203912096-6Search in Google Scholar
[15] Ballew RM, Demas JN. An error analysis of the rapid lifetime determination method for the evaluation of single exponential decays. Anal Chem 1989;61(1):30–3.10.1021/ac00176a007Search in Google Scholar
[16] Gerritsen HC, Asselbergs MA, Agronskaia AV, Van Sark WG. Fluorescence lifetime imaging in scanning microscopes: acquisition speed, photon economy and lifetime resolution. J Microsc 2002;206(Pt 3):218–24.10.1046/j.1365-2818.2002.01031.xSearch in Google Scholar
[17] Köllner M, Wolfrum J. How many photons are necessary for fluorescence-lifetime measurements? Phys Chem Lett 1992;200(1–2):199–204.10.1016/0009-2614(92)87068-ZSearch in Google Scholar
[18] Philip J, Carlsson K. Theoretical investigation of the signal-to-noise ratio in fluorescence lifetime imaging. J Opt Soc Am A Opt Image Sci Vis 2003;20(2):368–79.10.1364/JOSAA.20.000368Search in Google Scholar
[19] Becker W. Advanced time-correlated single photon counting techniques. Berlin, Heidelberg, New York: Springer; 2005.10.1007/3-540-28882-1Search in Google Scholar
[20] Becker W, Bergmann A, Hink MA, König K, Benndorf K, Biskup C. Fluorescence lifetime imaging by time-correlated single-photon counting. Microsc Res Tech 2004;63(1):58–66.10.1002/jemt.10421Search in Google Scholar PubMed
[21] Becker & Hickl GmbH. The bh TCSPC handbook. 5th edition. http://www.becker-hickl.de/handbook.htm [Accessed on June 26, 2014].Search in Google Scholar
[22] Becker W, Bergmann A, Biskup C. Multispectral fluorescence lifetime imaging by TCSPC. Microsc Res Tech 2007;70(5):403–9.10.1002/jemt.20432Search in Google Scholar PubMed
[23] Katsoulidou V, Bergmann A, Becker W. How fast can TCSPC FLIM be made? Proc SPIE 2007;6771:67710B. doi:10.1117/12.735550.10.1117/12.735550Search in Google Scholar
[24] Studier H, Weisshart K, Holub O, Becker W. Megapixel FLIM. Proc SPIE 2014;8948:89481K. doi:10.1117/12.2039454.10.1117/12.2039454Search in Google Scholar
[25] Becker W, Shcheslavkiy V, Frere S, Slutsky I. Spatially resolved recording of transient fluorescence-lifetime effects by line-scanning TCSPC. Microsc Res Tech 2014;77(3):216–24.10.1002/jemt.22331Search in Google Scholar
[26] Becker W, Su B, Bergmann A, Weisshart K, Holub O. Simultaneous fluorescence and phosphorescence lifetime imaging. Proc SPIE 2011;7903:790320. doi: 10.1117/12.875204.10.1117/12.875204Search in Google Scholar
[27] O’Connor DV, Phillips D. Time-correlated single photon counting. London: Academic Press, Inc.; 1984.Search in Google Scholar
[28] Becker & Hickl GmbH. User handbook. DCS-120 confocal scanning FLIM system. http://www.becker-hickl.de/dcsman.htm [Accessed on June 26, 2014].Search in Google Scholar
[29] Becker & Hickl GmbH. User handbook. Modular FLIM systems for Zeiss LSM 510 and LSM 710 family laser scanning microscopes. 5th edition. http://www.becker-hickl.de/zeissman1.htm [Accessed on June 26, 2014].Search in Google Scholar
[30] Yazdanfar S, Joo C, Zhan C, Berezin MY, Akers WJ, Achilefu S. Multiphoton microscopy with near infrared contrast agents. J Biomed Opt 2010;15(3):030505.10.1117/1.3420209Search in Google Scholar
[31] Becker W, Su B, Holub O, Weisshart K. FLIM and FCS detection in laser-scanning microscopes: increased efficiency by GaAsP hybrid detectors. Microsc Res Tech 2011;74(9): 804–11.Search in Google Scholar
[32] Desmettre T, Devoisselle JM, Mordon S. Fluorescence properties and metabolic features of indocyanine green (ICG) as related to angiography. Surv Ophthalmol 2000;45(1): 15–27.10.1016/S0039-6257(00)00123-5Search in Google Scholar
[33] Gerega A, Zolek N, Soltysinski T, Milej D, Sawosz P, Toczylowska B, Liebert A. Wavelength-resolved measurements of fluorescence lifetime of indocyanine green. J Biomed Opt 2011;16(6):067010.10.1117/1.3593386Search in Google Scholar PubMed
[34] Mordon S, Devoisselle JM, Soulie-Begu S, Desmettre T. Indocyanine green: physicochemical factors affecting its fluorescence in vivo. Microvasc Res 1998;55(2):146–52.10.1006/mvre.1998.2068Search in Google Scholar PubMed
[35] Choi JK, D’Urso A, Trauernicht M, Shabbir-Hussain M, Holmes AE, Balaz M. 3,3′-diethylthiatricarbocyanine iodide: a highly sensitive chiroptical reporter of DNA helicity and sequence. Int J Mol Sci 2011;12(11):8052–62.10.3390/ijms12118052Search in Google Scholar PubMed PubMed Central
[36] Gorris HH, Saleh SM, Groegel DB, Ernst S, Reiner K, Mustroph H, Wolfbeis OS. Long-wavelength absorbing and fluorescent chameleon labels for proteins, peptides, and amines. Bioconjug Chem 2011;22(7):1433–7.10.1021/bc200192kSearch in Google Scholar PubMed
[37] Schirmer RH, Coulibaly B, Stich A, Scheiwein M, Merkle H, Eubel J, Becker K, Becher H, Müller O, Zich T, Schiek W, Kouyaté B. Methylene blue as an antimalarial agent. Redox Rep 2003;8(5):272–5.10.1179/135100003225002899Search in Google Scholar PubMed
[38] Wondrak GT. NQO1-activated phenothiazinium redox cyclers for the targeted bioreductive induction of cancer cell apoptosis. Free Radic Biol Med 2007;43(2):178–90.10.1016/j.freeradbiomed.2007.03.035Search in Google Scholar PubMed PubMed Central
[39] Salah M, Samy N, Fadel M. Methylene blue mediated photodynamic therapy for resistant plaque psoriasis. J Drugs Dermatol 2009;8(1):42–9.Search in Google Scholar
[40] Medina DX, Caccamo A, Oddo S. Methylene blue reduces aβ levels and rescues early cognitive deficit by increasing proteasome activity. Brain Pathol 2011;21(2):140–9.10.1111/j.1750-3639.2010.00430.xSearch in Google Scholar PubMed PubMed Central
©2015 Walter de Gruyter GmbH, Berlin/Boston
Articles in the same Issue
- Frontmatter
- Editorial
- Photodynamic diagnosis and therapy – How bright is the future?
- Announcements
- Upcoming issues in 2015/2016 – Call for papers
- Pater Leander Fischer Prize 2016
- Obituaries
- In Memory of Prof. Dr. med. Gerd Werner Wolf Staehler (1939–2014)
- In Memory of Prof. Giulio Jori (1939–2014)
- Magazine section
- Snapshots
- Reviews
- Pros, cons and future prospects of ALA-photodiagnosis, phototherapy and pharmacology in cancer therapy – A mini review
- Review of dermatology use of 5-aminolevulinic acid photodynamic therapy in China from 1997 to 2013
- Original contributions
- The importance of iron chelation and iron availability during PpIX-induced photodynamic therapy
- In-vivo singlet oxygen threshold doses for PDT
- Fluorescence lifetime imaging with near-infrared dyes
- Trans-illumination fluorescence imaging of deep-seated tumors in small animals
- Preliminary research report
- Evaluation of resin-enamel interface micromorphology in respect of different Er,Cr:YSGG laser parameters
- Congress announcements
- LASER World of PHOTONICS – DGLM Application Panel: Laser-advanced new methods for diagnostics and therapeutics
- Congresses 2015/2016