
Variability in cross-language and cross-dialect perception. How Irish and Chinese migrants process Australian English vowels
-
Chloé Diskin-Holdaway

 ,
Debbie Loakes
and
Josh Clothier
,
Debbie Loakes
and
Josh Clothier

Abstract
We investigate how three adult groups – experienced L2 English listeners; experienced D2 (second dialect) listeners; and native L1/D1 listeners – categorise Australian English (AusE) lax front vowels /ɪ e æ/ in /hVt/, /hVl/ and /mVl/ environments in a forced-choice categorisation task of synthesised continua. In study 1, AusE listeners show predictable categorisations, with an effect of coarticulation raising the vowel in perception for nasal onset stimuli, and a following lateral lowering the vowel in perception. In study 2, Irish (D2) and Chinese listeners (L2) have different categorisations than AusE listeners, likely guided by their D1/L1. Coarticulation influences the D1/D2 groups in similar ways, but results in more difficulty and less agreement for the Chinese. We also investigate the role of extralinguistic factors. For the Chinese listeners, higher proficiency in English does not correlate with more Australian-like categorisation behaviour. However, having fewer Chinese in their social network results in more Australian-like categorisation for some stimuli. These findings lend partial support to the role of experience and exposure in L2/D2 contexts, whereby categorisation is likely still driven by native categories, with increased exposure leading to better mapping, but not to a restructuring of underlying phonetic categories.
1 Introduction
In both L1 and L2 phonological acquisition, perception precedes production chronologically, with the L1 essentially acting as a phonological filter in L2 contexts (Escudero 2007). Research reports a widely observed difficulty for adults in producing L2 sounds which are not in the phonological inventory of their native language, and perceptual categorisation of L2 sounds likely underlies this. Phoneme categorisation can also be guided by listeners’ native dialects (for English, see Clopper 2014; Diskin et al. 2018; Evans and Iverson 2004; Loakes et al. 2014a, 2023; Loakes 2019; Sumner and Samuel 2009). Some speakers have been shown to process the speech of another dialect by mapping it onto similar stored exemplars (Evans and Iverson 2004: 352), although this has not been found to be consistent, and depends on exposure and experience (Shaw et al. 2018; see also Nycz 2013, 2019).
This paper examines the categorisation behaviour of 12 native Australian English (AusE) listeners, along with 14 second language (Chinese L1) and 10 second dialect (Irish English D1) listeners, as they listen to mainstream AusE vowels in a forced choice vowel categorisation task. Our aims are to study how these three groups of listeners categorise the vowel stimuli /ɪ e æ/, which are currently in flux in AusE (Cox and Palethorpe 2008). We investigate whether L2 and D2 listeners will have different categorisation behaviour as compared to the AusE listeners, as guided by the L2/D2. We also investigate the role of extralinguistic factors (proficiency in English, length of residence in Australia – LOR, social network and gender) in this process.
2 Literature review
2.1 Perception in cross-language contact
Generally, listening is considered language-specific, with phoneme categorisation guided by listeners’ native language(s) (Cutler 2012; see also e.g., Best 1995 on the Perceptual Assimilation Model; Best and Strange 1992; Escudero 2007; Ingram and Park 1997). Phoneme categorisation is also guided by phonetic experience with the contrast (e.g., Ingram and Park 1997; Polka 1995), and the distinctiveness (or saliency) of phoneme cues (Lively et al. 1993). Furthermore, ability and accuracy in distinguishing contrasts can largely be predicted by the phonological inventories of a listener’s L1 (e.g., Flege et al. 1997). For example, as reported in Iverson and Evans (2009), Spanish L1 speakers have a native inventory of five vowels, as compared to German L1 speakers with an inventory of 18 vowels. When given five sessions of high-variability auditory training for English vowels, the results showed that the Germans improved more than the Spanish speakers, despite their more crowded vowel space. However, after an additional ten sessions of training, the Spanish listeners improved as much as the German group, and both groups retained their learning. The findings show that “a larger vowel category inventory may facilitate new learning and support a hypothesis that auditory training improves identification by making the application of existing categories to L2 phonemes more automatic and efficient” (Iverson and Evans 2009: 866).
Conversational experience in the target language has also been found to aid L2 listeners in more native-like category boundary identification, and in discrimination of speech sounds (e.g., Best and Strange 1992 for approximant consonants). Exposure to multiple tokens from a variety of speakers has also been found to assist in non-native/L2 category learning (Clopper 2014; Lively et al. 1993). Studies show that adult listeners may be able to ‘sharpen’ their perception of category boundaries in an L2 and use strategies similar to native speakers, but not gain native-like perceptual abilities (Flege et al. 1997; Weber and Cutler 2006). Vocabulary size in an L2 has also been found to be a strong predictor in discrimination performance in unfamiliar phonotactic contexts in the L2 (Wang et al. 2023).
In a forced-choice vowel identification task, Ingram and Park (1997) looked at vowel production and perception of AusE by L1 Korean and Japanese listeners. Both groups of listeners showed differences in AusE vowel category perception that were linked to their L1 phonology. As an example, compared with Korean listeners, Japanese listeners were able to use duration as a cue to help accurately distinguish long and short AusE vowels, likely because Korean does not have a vowel length contrast. It was argued that Korean listeners had thus not gained experience in using length as a cue to phonetic contrast, unlike Japanese listeners who had learnt this from contrasting the long and short vowels in their L1. The study illustrated how specific ‘attunement mechanisms’ (gained from L1 experience) were employed by the groups. The authors state that, in doing this, “L2 learners confronted with identification of foreign vowels seek to apply or modify perceptual strategies for phonological feature identification that were acquired in the course of first language learning” (Ingram and Park 1997: 365).
Within-group differences also emerged in Ingram and Park (1997) with respect to both age and experience. They discovered that older Korean listeners were better able to categorise the AusE /e-æ/ contrast than were younger Korean listeners. The authors attribute this to the experience that the older listeners have in distinguishing between /e-ɛ/ in Korean, whereas younger listeners were unable to do this, due to the recent merger in /e-ɛ/ in Korean. This study shows that listeners’ categorisation of vowels in an L2 is largely determined by their L1. However, it also shows that listeners who have the same L1, but different experiences of that L1, have different abilities in their L2. This highlights the importance of listener experience with phonetic detail relevant for perceiving cues to phoneme contrasts in an L2 (as shown by Cutler 2012).
2.2 Perception in cross-dialect contact
While it is well-established that L2 listening is language-specific and experience-based, as per the discussion above, perception in cross-dialect contact constitutes a relatively under-researched area. Studies on English show that regional variation means that some listeners of the same language are exposed to different contrasts than others, and thus react differently, in perception (e.g., Loakes et al. 2023, for AusE). There is an ongoing question within the literature concerning the role of experience in speakers recognizing the speech of another dialect by “mapping it onto similar stored exemplars” (Evans and Iverson 2004: 352; see also Pierrehumbert 2002). The mapping of exemplars was investigated by Evans and Iverson (2004) for northern and southern British English vowel perception and Sumner and Samuel (2009) for General American compared with NYC speakers. Clopper (2014) also gives various examples from American dialects in her discussion of the effects of exposure on cross-dialect speech processing. In Shaw et al. (2018), AusE listeners had perceptual tolerance for vowel variation in dialects from London, Yorkshire, Newcastle (UK) and New Zealand, in all but a few contexts. In other words, the AusE listeners were able to perceptually assimilate phonetic details into abstract vowel categories, despite the differences in accent they were hearing. However, being exposed to a short passage read by a native speaker of those dialects before completing the same task did not result in any significant differences, meaning there was little sign of rapid adaptation (Shaw et al. 2018: 1).
Nycz (2013) studied speakers of Canadian English who had moved to New York City and their perception and production of (oh)/(o) pairs (represented as such in the paper), which are typically merged in Canadian English and split in New York City English. She found that the speakers neither produced nor perceived any differences in the pairs in a minimal pair task, but in wordlists and conversational data, they showed signs of a low back vowel contrast. In a further study, Nycz (2019) found that the same speakers of Canadian English were more likely to have this non-native low back vowel contrast if they were married to a New Yorker. This variable was more significant than that of LOR in New York City, or identification as New Yorker. While not a perception study, Nycz (2019) shows the importance of examining social networks as sources of input in studies of D2/L2 acquisition. The present study builds on this by incorporating a social network metric (see Section 4.2.2).
A study investigating effects of experience on intelligibility, but in a second language context (Pinet et al. 2015), found that Mandarin listeners with intermediate English proficiency had similar levels of speech-in-noise recognition of standard British accents as native British English speakers, leading the authors to conclude (perhaps rather controversially) that, rather than experience, it could be that “standard accents […] have acoustic-phonetic features that make them inherently more intelligible” (Pinet et al. 2015). These findings suggest that the role of experience and exposure in L2/D2 perception can also be inconsistent, and this is an aspect we explore in the present study.
2.3 The front lax vowels /ɪ e æ/ in perception and production
2.3.1 Australian English
We focus on the front lax vowels /ɪ e æ/, which are highly variable in AusE speech production and have been undergoing recent changes, including lowering and retraction (Cox and Palethorpe 2008). These changes have been shown to impact perception in AusE, with a shift up for the perceptual boundary between /ɪ e/ and a shift down between /e æ/ (Mannell 2004: 226). These changes mean that there is predictable age-related variability because of vowel space expansion, with younger listeners responding differently to older listeners when completing vowel categorisation tasks (Loakes et al. 2014a, 2023; also summarised in Loakes 2019). Region (southern versus northern Victoria), phonetic context and coarticulation have also been found to have an effect on how AusE listeners categorise AusE vowels, with a nasal onset raising these vowels in perception (perceiving the sound as a higher vowel) and a lateral coda having a lowering effect (perceiving the sound as a lower vowel) (Diskin et al. 2018; Loakes et al. 2023). Gender has to date not emerged as significant factor in perception of the merger (see Loakes et al. 2023).
Furthermore, there is regional variability in a pre-lateral merger of /e æ/ in AusE production (the so-called celery-salary merger – see Bradley 1989; Cox and Palethorpe 2003; Loakes et al. 2017) and perception (Loakes et al. 2014a, 2014b, 2023; Loakes 2019). In the south-east of Australia, listeners in the southernmost part (including Melbourne) have been shown to have a merger in perception for /el/-/æl/, often answering at random, whereas listeners in northern areas of the south-east can accurately discriminate this contrast (Loakes et al. 2014a, 2023). Similar to the L2 perception studies described in Section 2.1, this comes down to experience in perception.
These front lax Australian English vowels are of interest because of their highly variable production and perception by native speakers, motivated by sound change. In study 1, we investigate how our AusE listeners categorise these vowels and whether they have a merger in perception, particularly in prelateral and nasal onset contexts. In study 2, we explore how these same vowels are categorised by L2/D2 listeners.
2.3.2 Irish English
In terms of the front lax vowels /ɪ e æ/ in Irish English, there is no published work comparing Irish English and AusE explicitly. However, Irish English /ɪ/ is reported to be similar to British English (Hickey 2005: 227), with the Northern Irish realisation of /ɪ/ being more lowered and centralized, and lowering of short front vowels considered to be an import from Scotland to Ulster (Hickey 2008: 81). In Southern Irish English (i.e., the English spoken in the Republic of Ireland), /e/, or the dress vowel, is “essentially the same as in present-day British English, perhaps slightly lower” and /æ/ is quite open, similar to “more recent forms of Southern British English” (Hickey 2005: 227). Shaw et al. (2018: 8) show that, while not exactly the same, /e/ and /æ/ are acoustically very similar between AusE and British (London) English and point out that similarities between the varieties are unsurprising due to British English being the source variety of AusE. Hickey’s (2005) parallels between Irish and Southern British English could thus be extended to AusE, although there are likely small phonetic differences in realisation such as slightly lower /æ/ in British English (see Shaw et al. 2018).
Recent work on Southern Irish English reports a process of short front vowel lowering, in line with what has been reported in other varieties worldwide (Hickey 2018), including AusE (Cox and Palethorpe 2008). However, the phenomenon appears to be restricted to the dress and trap lexical sets, and among young female speakers of a new, supraregional variety of English, where the /l/ is also likely to be pharyngealized, thus promoting lowering (Hickey 2018: 13).
Thus, in a sample of young speakers such as ours, with the majority coming from the south of Ireland, we hypothesise that, as speakers of a supraregional variety, their production of the vowels in question would be relatively uniform. These descriptions are also supported in a previous study of vowel production in a subset of the participants in the present study, where they had a similar /ɪ/, a slightly lower /e/, and a more open /æ/ as compared to five of the Australian participants (Diskin et al. 2019b; see also relative distances between monophthongs in Irish English in Ferragne and Pellegrino 2010: 23). We note that we have three (male) participants from the North of Ireland, who auditorily have more lowered front vowels than the other seven participants. This may have affected their perception of these vowels, although there has been no previous work into categorisation or perception of Irish vowel contrasts where this production-perception link could be confirmed. We have not incorporated the factor of region of origin in this study due to the small sample size.
2.3.3 Mandarin Chinese
Duanmu (2007) reports that there are five basic monophthongs in Mandarin Chinese: /i y ə a u/. This means that none of the vowels we investigate in our study are represented in the Mandarin Chinese inventory, which may present perceptual difficulties for the L1 Chinese listeners. While there are no explicit studies comparing the vowels in Mandarin Chinese and AusE (but see Wang et al. 2023 for a comparison of phonotactics), Chen et al. (2001: 427) found that Mandarin Chinese speakers had smaller overall vowel quadrilaterals as compared to corresponding American English speakers’ quadrilaterals. They reported that there are six American English vowel phonemes, /ɪ, ɛ, æ, ʌ, ʊ, ɔ/, that do not occur in the Mandarin vowel system (Chen et al. 2001: 429). It should be noted that the phonemic system in American English is the same as AusE with respect to these contrasts, with the differences between AusE and American English being phonetic in this respect (see for example the AusE phoneme list in Cox and Fletcher 2017: 55).
There have been several studies examining Mandarin Chinese listeners’ abilities to discriminate vowels in different varieties of English. In a combined perception-production study, Jia et al. (2006) tested the discrimination of six American English vowel pairs among L1 Mandarin speaker-listeners and found that exposure to American English, plus a younger-learner advantage, resulted in increased mastery in discrimination of L2 phonology (Jia et al. 2006: 1118). Wang et al. (2022: 161) examined the discrimination of six AusE vowel contrasts, /æ/-/ɐ/, /ɐː/-/ɐ/, /iː/-/ɪ/, /æ/-/e/, /eː/-/æ/, and /ɜː/-/e/, by Chinese L1 listeners, finding that strong accuracy-latency associations existed in cross-boundary contrasts, but no clear correlations were found for within-category pairs. Importantly for the present study, Wang et al. (2022: 161) note that Mandarin has a low vowel /a/, of which [æ] (after /j/ and before /n/) is an allophone. However, /iː/-/ɪ/ can be challenging for Chinese L1 listeners, as Mandarin does not have duration contrasts (Duanmu 2007). Furthermore, Mandarin does not have the mid front monophthongs /e/ or /eː/, so these monophthongs in AusE could be deemed “unfamiliar” for Chinese listeners. This leads us to predict that the task we present here will be a challenging one for Chinese listeners but could be affected by factors such as length of residence (LOR), social network, proficiency in English (see also Wang et al. 2023 for the effect of L2 vocabulary size), or gender, which provides an impetus for the present study.
3 Aims
The aims of the present investigation are presented broadly across two studies.
Study 1
Investigate how native AusE listeners categorise the (in flux) AusE vowel stimuli /ɪ e æ/ in a forced choice vowel categorisation task;
Determine the effect of coarticulation in the categorisation of these vowels (pre-lateral /hVl/ and nasal onset pre-lateral /mVl/).
Study 2
Determine how Chinese L1 and Irish D1 categorise these same stimuli (i.e., investigate cross-language and cross-dialect perception);
Examine whether extralinguistic factors (LOR, social network, proficiency in English, or gender) contribute to an ‘Australian-like’ categorisation behaviour among D2/L2 listeners.
The studies provide valuable insights into how listeners from different language and dialect backgrounds respond to vowel stimuli that are known to be variable within the community. They focus on whether ‘experience’ can lead speakers of one dialect/language to map features of another onto stored exemplars (see Pierrehumbert 2002). Furthermore, by examining participants who have lived in Australia for varying lengths of time (1–14 years), we track the perception of features of a second language/dialect in apparent time.
We predict that AusE listeners will categorise the /hVt/ continua at the acoustic midpoint, but that in the /hVl/ and /mVl/ continua, the effect of the lateral and nasal will respectively lower and raise those vowels in perception. For the L2/D2 listeners, we predict that exposure to and experience with AusE will result in more Australian-like categorisation behaviour. We will incorporate listener gender into our analyses, but do not predict it to display any differences, in line with Loakes et al. (2023).
4 Methodology
4.1 Participants
The present study stems from a larger project on second language and second dialect acquisition by recently-arrived migrants in Melbourne (see Diskin et al. 2018, 2019a, 2019b, 2019c). All data collection took place in 2017 on The University of Melbourne campus. The participants (see Table 1) completed a variety of tasks, including a studio-recorded wordlist and sociolinguistic interview, a recorded wordlist with simultaneous ultrasound tongue imaging, and a comprehensive socio-demographic background questionnaire (based on Horvath 1985; Llamas 1999; Lonergan 2013).[1] The final task was a forced-choice vowel categorisation task presented on a custom-made app for the iPad (see Loakes et al. 2014a, 2023), which is the task we report on in this paper, and completed by the three listener groups. The totality of the tasks took approximately 2 h. The vowel categorisation task took approximately 20 min to complete and was administered in a sound-proof perception laboratory under the supervision of a researcher and/or a research assistant.
Summary of participants by language/dialect group, gender (self-reported), average age and LOR in Australia.
| Language/dialect group | Female (n) | Male (n) | Average age | Average LOR in Australia |
|---|---|---|---|---|
| Australian English (AusE) | 7 | 5 | 32 years 9 months (SD = 5 years 2 months) | Born and raised in greater Melbourne area |
| Irish English (IrE) | 5 | 5 | 34 years (SD = 3 years 8 months) | 5 years 8 months (SD = 3 years 9 months) |
| Chinese (Mandarin) | 7 | 7 | 26 years 8 months (SD = 3 years 5 months) | 2 years 5 months (SD = 1 year 10 months) |
| Total participants | 19 | 17 | – | – |
All but two of the Australian participants were born and raised in Melbourne and had never spent longer than one year living outside of the greater Melbourne area.[2] This residence requirement for the Australians was one of the criteria for participation in the study. Criteria for the Irish and Chinese participants were that they should have moved to Australia as adults (aged 18+, although one Chinese participant was 17 when he moved). The Chinese participants came from a variety of regions across Mainland China and Hong Kong. The Irish participants came from towns and villages across the island of Ireland, encompassing both the Republic of Ireland and Northern Ireland (which include a diversity of dialect regions – see Corrigan 2010; Kallen 2013), so there is some dialectal difference amongst these participants (Diskin et al. 2019b – see also Section 2.3.2 above). The years of birth of the participants ranged from 1976 to 1995 (Table 1), so they are relatively homogenous in terms of age and mostly younger than the participants in Loakes et al. (2023) or Schmidt et al. (2021).
4.2 Method and materials
4.2.1 Phonetic categorisation task
The task we report on is a phonetic categorisation task with forced-choice identification. The experimental procedure, including stimulus manipulation and presentation, is the same as Loakes et al. (2023) and is also similar to the design of Harrington et al. (2008), Kleber et al. (2011) and Kendall and Fridland (2012). Focusing on the AusE lax front vowels /ɪ e æ/, seven-step continua were created using the Akustyk vowel synthesis module (Plichta and Preston 2004) in Praat (Boersma and Weenink 2018) using the default settings. The end points of the continua were produced by one female native AusE speaker, who was not from Melbourne and crucially maintained the /e æ/ contrast in pre-lateral conditions. The recordings were made in the Horwood Language Centre recording studio at The University of Melbourne.
Between the end-points of the stimuli, the intervening five steps were equidistant in F1, F2 and F3. The whole word was synthesised to account for vowel transitions; amplitude, vowel duration and F0 were not altered. The resulting continua were (stressed) front lax vowels in various contexts (Table 2), broadly /hVt/, /hVl/ and /mVl/ and included a mix of relatively high frequency (e.g., hit) and low frequency (e.g., het) monosyllabic words, as well as some proper names (e.g., Mel, Mal, Hal), which are typical first name abbreviations in AusE. The focus is the pairs hill-hell, hit-het, mill-Mel; hell-Hal, het-hat and Mel-Mal. The stimuli were piloted with members of the Phonetics Laboratory at The University of Melbourne at the time they were created; they were not trialled with participants. The stimuli have now been used multiple times with various listener groups (e.g., Loakes et al. 2014a, 2023), with native listeners correctly identifying the endpoints, albeit with some small differences according to age and region. Listeners have also been found to respond consistently when carrying out the same task three or six years later (Loakes et al. 2019).
The six continuaa analysed in this study.
| Phonetic context | /i-e/ | /e-æ/ |
|---|---|---|
| /hVt/ | hit-het | het-hat |
| /hVl/ | hill-hell | hell-hal |
| /mVl/ | mill-Mel | Mel-Mal |
-
aPredicted merger conditions are bolded (see Cox and Palethorpe 2003; Loakes et al. 2023).
The participants identified each synthesized stimulus four times and they were presented orthographically on the iPad screen. For each stimulus, over the course of the task, the target word appeared on the left of the screen twice, and the right of the screen twice. Options appeared side by side. The stimuli were blocked into four “sections” (with an option for participants to take a break at each section), and items were randomised within each block. We report on 168 trials per listener, but there were more in the full study, including e.g., foils and back vowel stimuli, which we do not report on here – the current study focuses on a subset of short vowels. The experiment was conducted under laboratory conditions, and listeners used Shure SRH840 Reference Studio headphones, with experimental volume kept constant across all participants. Hearing difficulties were not reported, but this was not independently tested. Listeners would hear a token, and options were visible on the screen immediately. Options could be selected once the audio had finished playing. Participants would hear each option only once, and would make their choice by pressing buttons on the screen to indicate which of two items they had heard, before moving on to the next item. The listeners were likely aware that they were listening to AusE, as the overall study was presented to them as being about the adoption of AusE by migrants. We note that the original task was not designed to take lexical frequency into account, and a previous study using the same materials (Loakes et al. 2023) has shown that lexical frequency has some effect on participant responses, but mainly with respect to age (older speakers had more merger of dress and trap in prelateral contexts for frequent words than younger speakers), and to exposure to proper names (younger listeners preferred Mel and older listeners preferred Mal). The age issue is not as relevant here, as all of our participants are similar in age and younger than the participants in Loakes et al. (2023) – see Table 1. We could predict that different levels of exposure to proper names could affect the Irish and Chinese groups in this study, but the names are more popular in Australia than in Ireland and China, and this is not information that we solicited from the participants. Lexical frequency is also not a factor we examined in isolation.
4.2.2 Social network task
The social network task (based on Lonergan 2013, who drew on Labov 2001; Milroy 1987) was completed at the end of the questionnaire (see Section 4.1). Participants were instructed to put the initials of the six people they spend the most time with on a daily basis in no particular order. They were also instructed to describe their relationship with this person (e.g., ‘cousin’, ‘husband’, etc.) and to specify where this person came from (e.g., Australia).
Each L2/D2 participant was assigned two Social Network Scores (SNSs), with a total possible range of 0.0–1.0 (Table 3). Irish and Chinese participants were assigned a score of the degree to which their social network was ‘Australian’, which ranged from 0.16 to 1.0 for the Irish and from 0.0 to 0.5 for the Chinese. This was calculated by dividing the number of identified people who were Australian by the total possible number of people in the network (6). For example, a participant who listed one Australian in their social network received an Australian Social Network Score of 0.16, which is 1/6. A participant who listed their entire social network as Australian received a score of 1.0. Participants were also assigned a score of the degree to which their social network was their own nationality group, i.e., ‘Irish’ or ‘Chinese’. This score was calculated in the same way as the Australian network score and ranged from 0.0 to 0.66 for the Irish and from 0.16 to 1.0 for the Chinese. Overall, the Irish social networks were more Australian and less Irish; whereas for the Chinese, it was the opposite: their social networks were more Chinese and less Australian. This is likely also related to their lengths of residence, with the average LOR for the Irish being over twice that of the Chinese (Table 1). Furthermore, there were more Chinese that were university students than among the Irish: nine out of the fourteen Chinese participants were students at the time of recording, whereas all ten of the Irish participants were in full-time employment. This may have resulted in increased exposure to AusE among the Irish group as compared to the Chinese group, as universities in Australia typically have a very diverse student body, and Irish people may have had more opportunities to meet local Australians in the workplace.
Social network and self-reported standardised test scores for the Irish and Chinese participants.
| Native language/variety | Average social network score (Australian) | Average social network score (own nationality i.e., Chinese/Irish) | Average proficiency in English (self-reported standardised test scores – IELTS or equivalent calculation) |
|---|---|---|---|
| Irish English (IrE) | 0.46 (SD = 0.23; Range = 0.16–1.0) | 0.26 (SD = 0.22; Range = 0–0.66) | n/a |
| Chinese (Mandarin) | 0.13 (SD = 0.18; Range = 0–0.5) | 0.69 (SD = 0.23; Range = 0.16–1.0) | 7.4 (SD = 0.94) |
People in the social networks who were from somewhere other than Australia, Ireland and China were accounted for, but not assigned a metric here. The native Australians also completed this task, but their results are not reported on here.
4.2.3 Proficiency in English
The International English Language Testing System (IELTS) is the most commonly-used metric for proficiency in English in Australia, particularly for those seeking entry on a student visa. As a consequence, all of the Chinese participants, with the exception of two, were in a position to report on their most recent IELTS score via the demographic questionnaire, and this is the metric used in the present study. The two participants who did not have an IELTS score provided a Pearson Test of English (PTE) score instead. Both of their scores, which were in the 90s, were equated to an equivalent IELTS 8.5. The average IELTS score of the Chinese participants was 7.4. A score of 7 is described as “good”, where the “test taker has operational command of the language, though with occasional inaccuracies, inappropriate usage and misunderstandings in some situations. They generally handle complex language well and understand detailed reasoning”.[3]
4.3 Analysis
We first present descriptive comparisons between language/variety groups using proportions (or observed probabilities) of responses across the continua, with the mean per continuum step plotted, along with 95 % (bootstrapped) confidence intervals. These comparisons are then examined using mixed effects binomial logistic regression models, which were fit using the glmer function in lme4 (Bates et al. 2015) using the RStudio IDE (RStudio Team 2020) for R (R Core Team 2020). We began with an intercept-only model and proceeded with testing explanatory fixed factors (continuum step, gender, language/variety), as well as interactions between these factors, in a stepwise step up fashion following procedures in Schweinberger (2021). The final model in each case is the minimal adequate model to account for the variability in the data using these factors. Results of likelihood ratio tests comparing these final models with the baseline intercept-only model are reported. In all cases, listener was used as the random effect. Treatment coding was used for all categorical predictors and polynomial coding was used for the ordinal predictor step. We chose to examine continuum step as a factor rather than phonetic context, as it was more fine-grained than looking at phonetic context alone (six levels rather than three – see Table 2). Adding both phonetic context and continuum step as factors would have reduced the stability and power of the model.
Model evaluation summaries are presented in Table 4, including results of likelihood ratio tests (“LRT”: comparison of final model with baseline), and model fit parameters, the C-value (which indicate a good model fit above 0.8 [Baayen 2008: 204]) and Somer’s Dxy, which ranges from 0-1 with higher values, indicating greater predictive power.
Model fit parameters for generalised linear mixed effects models.
| Continuum | LRT | C-value | Somer’s Dxy |
|---|---|---|---|
| hit-het | χ2 (5) = 394, p < 0.001 | 0.943 | 0.886 |
| het-hat | χ2 (5) = 406, p < 0.001 | 0.915 | 0.831 |
| hill-hell | χ2 (5) = 528, p < 0.001 | 0.957 | 0.914 |
| mill-Mel | χ2 (5) = 634, p < 0.001 | 0.962 | 0.925 |
| hell-Hal | χ2 (5) = 437, p < 0.001 | 0.914 | 0.829 |
| Mel-Mal | χ2 (5) = 541, p < 0.001 | 0.928 | 0.856 |
In order to assess the effect of LOR, social network, gender, and proficiency (as relevant), we chose a non-parametric modelling method, as adding these factors to the logistic regressions either violated the assumptions of the models or resulted in convergence failures. We acknowledge that, at 36 participants, the sample size is small as compared to comparable studies in speech perception, and that we are incorporating many variables. In order to offset issues of reliability, we adopt the non-parametric method of conditional inference trees (Barth and Schnell 2022; Levshina 2020; Schweinberger 2021; Tagliamonte and Baayen 2012). Conditional inference trees are a method for regression and classification based on binary recursive partitioning (Levshina 2015: 291) and are particularly suitable for situations of small n and large p, where n is the number of observations and p is the number of predictors (Tagliamonte and Baayen 2012). A non-parametric method such as conditional inference trees has fewer assumptions around sample size compared to e.g., a generalised linear mixed effects model. It helps to describe the data, rather than make inferences based on the data.
step always emerged as the predominant predictor in our conditional inference trees. It was responsible for the first binary split, being highly significant, and often responsible for multiple splits. However, the analysis including other social factors allows us to understand some of the individual-specific factors that condition listener responses in the Irish and Chinese cohorts. Results of this modelling are discussed in Sections 5.4 and 5.5. Note that for Irish listeners, for the /hill-hell/, /mill-Mel/, and /Mel-Mal/ continua, only step significantly predicted responses using this method. For Chinese listeners, for the /hell-hal/ and /Mel-Mal/ continua, step was the only significant factor.
5 Results
5.1 /hVt/ condition
The results in Figure 1 for the /hVt/ condition show that in the case of /hit-het/ for the native AusE listeners the crossover point is at the acoustic midpoint (Step 4). This response was predicted. However, there were differences between the listener groups for this stimulus. At Step 1, complete agreement was only attained by the Irish listeners, although the AusE listeners attained almost 100 % agreement by Step 6. The Irish and AusE listeners had significantly different crossover points for /i-e/, with the Irish listeners crossing over to hearing /het/ at Step 6 – a full two steps later than for the AusE listeners. The Chinese listeners did not have a crossover point for this continuum and had very low levels of agreement with only 42 % of responses being het at Step 7. Therefore, in 58 % of cases, at Step 7, some Chinese listeners were still hearing hit. The Irish also had low levels of agreement at Step 7, with just 59 % of responses being het. Overall, these differences are confirmed by our statistical modelling: the final minimal adequate model performed significantly better than an intercept-only baseline model. The model returns a significant interaction between step and language/variety, emphasising the differences between the AusE and Chinese responses across the /hit-het/ continuum (z = 3.32, p = 0.001).

Observed probabilities/proportions by continuum step /hit-het/ (left panel) and /het-hat/ (right panel) in blue (Australian), red (Chinese) and green (Irish).
AusE responses to /het-hat/ were less consistent with predictions for this condition than for /hit-het/: they had an early crossover point at Step 2 and a bias for hat. This bias was also visible for the Irish, whose crossover points were before the acoustic midpoint. However, the Chinese had a crossover at approximately the acoustic midpoint (Step 4). There was significant difference in crossovers from /e/ to /æ/ between the AusE and the Chinese listeners. There was also a lack of certainty for this stimulus, with approximately 80 % agreement at Step 1 for all three groups, where 100 % would be predicted. By Step 6, the Irish listeners, and most of the AusE listeners, had reached 100 % agreement and switched to hearing hat. However, the Chinese listeners were not all in agreement. Logistic regression modelling returned a significant two-way interaction between step and language/variety, confirming the Chinese listeners’ performance as most distinct from the other two groups of listeners, exhibited by their preference for het across the continuum (z = 3.07, p = 0.002). The results for the /hVt/ condition are summarised in Table 5.
Summary of results for the /hVt/ condition.
| AusE (D1/L1) | Irish (D2) | Chinese (L2) | Significant differences and interactions | |
|---|---|---|---|---|
| /hit-het/ |
|
|
|
|
| /het-hat/ |
|
|
|
|
5.2 /hVl/ and /mVl/ condition: coarticulatory effects on categorisation
Figure 2 shows the responses for /hVl/ and /mVl/ condition. These stimuli test the effects of coarticulation on processing: the effect of a pre-lateral context as well as a nasal onset. In the case of /hill-hell/, there were significant differences between the responses across all three groups. The three groups have high rates of agreement for hill responses at Step 1, but for the Irish and, to a lesser extent, the AusE and Chinese listeners, the hill response is consistently sustained until after Step 6, followed by a steep decline in hill when the category crossover occurs. However, there is still only 62 % agreement at Step 7 for the Irish listeners. For the AusE listeners, there is a more gradual decline in hill responses until the category crossover at approximately Step 5. While the majority of AusE listeners had switched to hearing hell by Step 7, large proportions of the Irish (38 %) and Chinese (31 %) responses remained hill. For this option, the Irish and the Chinese exhibited similar categorisation behaviour. In our modelling, where the Chinese and Irish were compared with the AusE listeners, significant main effects of language/variety were found for the Chinese (z = −2.80, p = 0.005) and the Irish (z = 2.14, p = 0.032), who were both overall more likely to respond with hill as compared to the AusE listeners. The significant interaction between step and language/variety shows Chinese listeners had significantly more hill responses towards the end of the continuum, i.e., Steps 6 and 7 (z = 4.15, p < 0.001).

Observed probabilities/proportions by continuum step for /hill-hell/ (left panel) and /mill-Mel/ (right panel) in blue (Australian), red (Chinese) and green (Irish).
For /mill-Mel/, the responses across the three listener groups were very similar to /hill-hell/, with the Irish sustaining mill responses for longer than the AusE listeners. The AusE listeners switched from hearing mill to Mel at Step 5, after the acoustic midpoint, whereas the Irish crossed over at Step 6 and the Chinese at Step 7. As with /hill-hell/, there were significant differences between the responses across all three groups. However, the crossovers for the AusE and Irish groups were earlier in this pre-lateral, nasal onset condition (at Steps 5 and 6 respectively) as compared to the pre-lateral condition without the nasal onset (at Steps 6 and 6–7 respectively). In this nasal onset condition, the AusE and Irish listeners had high levels of agreement by Step 7 (between 89 and 100 %), but the Chinese listeners had agreement of only 54 % by Step 7. Regression modelling shows similar patterns to those for the /hill-hell/ continuum, with significant main effects of language/variety, whereby both the Chinese (z = −2.56, p = 0.011) and the Irish listeners (z = 2.37, p < 0.001) had significantly more mill responses than the AusE listeners. There was also an interaction between step and language/variety, showing that the Chinese listeners had more mill responses than the Irish or the AusE listeners towards the end of the continuum (z = 4.72, p < 0.001).
5.3 /el-æl/ condition: predicted merger context
Figure 3 shows that for /hell-hal/, the crossover for the AusE listeners is at the acoustic midpoint, whereas the Irish and Chinese listeners have similarly late crossovers at Steps 6 and 7 respectively. This mirrors the categorisation behaviour of the Irish and Chinese listeners for other continua, with a pattern of late crossovers (and less overall agreement, particularly towards the end of the continuum.). For this continuum, the AusE responses were significantly different from the Irish and Chinese responses, but the Irish and Chinese responses were not significantly different from each other. Modelling showed significant main effect of language/variety, whereby Irish listeners have more hell responses overall (z = 3.28, p = 0.001), and an interaction between step and language/variety, whereby Chinese listeners retained more hell responses towards the end of the continuum (z = 2.60, p = 0.009).

Observed probabilities/proportions by continuum step for /hell-hal/ (left panel) and /Mel-Mal/ (right panel) in blue (Australian), red (Chinese) and green (Irish).
For the /Mel-Mal/ stimulus, all three sets of responses were significantly different from one another. In this nasal onset condition, the crossovers are somewhat earlier for the AusE listeners as compared to the /hell-hal/ stimulus:, there is an abrupt downwards trend from Mel towards Mal around Step 3. For the Irish and Chinese listeners, the trend is not as abrupt. The crossover for the Chinese listeners is later in the nasal onset condition, at Step 7. Furthermore, while the AusE and Irish listeners have fairly high levels of agreement, the level of agreement among the Chinese is only 65 % at Step 7, mirroring their levels of agreement in the other nasal onset condition: /mill-Mel/.
Both /el-æl/ contexts were predicted to be ‘merger’ conditions, with AusE listeners answering at random and/or having crossovers that were not at the acoustic midpoint. However, both with and without a nasal onset, there is no strong evidence of a merger in perception by any of the three listener groups, although low agreement rates at endpoints of some of the continua (e.g., Step 1 for AusE listeners for /Mel-Mal/) suggest potential merger among some listeners.
The results of modelling show a significant main effect of language/variety, whereby the Chinese had significantly more Mel responses than the AusE and Irish listeners (z = 4.16, p < 0.001). There is also an interaction between step and language/variety, showing that Chinese listeners have more Mel responses towards the end of the continuum (z = 3.94, p < 0.001), whereas Irish listeners have significantly more Mal responses towards the end of the continuum (z = −3.32, p = 0.001). A summary of results for the /hVl/ and /mVl/ conditions is provided in Table 6.
Summary table for /hVl/ and /mVl/ conditions.
| AusE (D1/L1) | Irish (D2) | Chinese (L2) | Significant differences and interactions | |
|---|---|---|---|---|
| /hill-hell/ |
|
|
|
|
| /mill-Mel/ |
|
|
|
|
| /hell-hal/ |
|
|
|
|
| /Mel-Mal/ |
|
|
|
|
5.4 Second dialect perception: Irish listeners
As discussed in the previous sections, Irish listeners were found to have different categorisation behaviour depending on the stimulus (Figure 4). Some of the responses to continua such as /het-hat/ indicated early crossovers, but high levels of agreement. Other responses, such as those for /hit-het/, indicated late crossovers and low levels of agreement. With the aim of investigating the effect of experience and exposure on perception, in sub-Sections 5.4.1 and 5.4.2, we analyse effects of LOR and social network among the Irish listeners, using conditional inference trees (see Section 4.3). In all cases, only the conditional inference trees for continua that yielded significant differences are reported.

Group-level responses for Irish listeners to the six stimuli in the present study: /hit-het/ (red); /hill-hell/ (mustard); /mill-Mel/ (green); /het-hat/ (aqua); /hell-hal/ (blue); /Mel-Mal/ (pink).
5.4.1 Effect of LOR among Irish listeners
The Irish listeners had been living in Australia for an average of 5 years 8 months (see Table 1). To test for the effect of LOR, we use conditional inference trees based on binary recursive partitioning.[4] They are to be read as follows: the ‘tree’ shows “all possible splits that are significant at the level of p < 0.05. The ovals contain the names of the variables selected for the best split, as well as the corresponding p-values. The levels of the variables are specified on the ‘branches’” (Levshina 2015: 294) so that in the case of Figure 5, the levels on the branches on the far left are the steps from the task, i.e., ≤Step 4, or >Step 4. The bar plots at the bottom (‘leaves’) show the proportion of, in the case of Figure 5, hell being selected over Hal in each end node (‘bin’), which “contains all observations with a given combination of features. The number of observations in each bin is shown in parentheses above the boxes” (Levshina 2015: 294).

Conditional inference tree for /hell-Hal/ continuum by Irish listeners, showing significant effect of LOR.
Figure 5 shows that step, which is the first split in the tree, plays the most important role in conditioning responses to the /hell-Hal/ continuum by the Irish listeners. This accords with the results discussed in previous sections. However, the analysis shows that LOR also plays some role in conditioning responses. Specifically, after step 4, those with LOR of ≤3.5 years had more Hal responses than hell (Node 4), which resembles the behaviour of the AusE listeners, who crossed over at Step 4 (the acoustic midpoint). Those with LOR of >3.5 years had more hell responses at steps ≤5. Above Step 5 in the longer LOR group, however, there is a roughly equal split between hell and Hal responses (Node 7), which differs from the AusE listeners, who by Step 5 had approximately 75 % Hal responses. The tree shows that longer LOR does not predict more Australian-like categorisation behaviour (more Hal responses by Step 4), in fact, quite the opposite. Those with shorter LORs are the most likely to have Hal responses around Step 4 (resembling the AusE crossovers – see Node 4), which goes against predictions that increased LOR would result in more Australian-like crossovers.
LOR also had an effect on responses to the /hit-het/ continuum among Irish listeners (Figure 6). In this case, the effect was evident above Step 4 (to the right of the tree), and among those with LORs below and above 6 years. Within this, the effect is mediated by gender, such that for those with longer LORs (>6 years; to the right of leaf 5), men had more hit responses (Node 13), while women had more het responses (Node 12), representing a more Australian-like crossover, as the AusE listeners had crossed over at the acoustic midpoint (Step 4). For those with LORs at six years and under (to the left of leaf 5), the men above step 5 show the opposite pattern to the men with longer LORs – they are more likely to respond with het. However, women in Node 9 show similar Australian crossovers, with a preference for het after Step 5. This suggests an interaction between female gender and increased LOR in predicting more Australian-like categorisation behaviour.

Conditional inference tree for /hit-het/ continuum by Irish listeners, showing significant effect of LOR and gender.
5.4.2 Effect of Irish social network among Irish listeners
Figure 7 shows that Irish social network score (ranging from 0.0, i.e., no-one out of the network is Irish, to 0.6, i.e., four out of the six in the network is Irish) plays a role in conditioning responses to /het-hat/ for the Irish listeners. Specifically, between steps 2 and 4, women who had an Irish SNS of ≤0.16 (leaf 7) had more het responses (Node 8) than hat. This does not mirror AusE responses, which crossed from het to hat early, just after Step 2. Conversely, the women with an Irish SNS of >0.16 had 80 % hat responses below Step 4, which resembles the AusE crossovers, but counters predictions that a lower Irish SNS would result in more Australian-like behaviour. Node 10, showing an effect of male gender below Step 4, also shows a more Australian-like behaviour. In this sense, no one gender can be said to be clearly predicting Australian-like crossovers, but it is also of note that the Irish in general were fairly close to the AusE group for categorisation of this stimulus (see Table 5). A summary of results of extralinguistic factors for the Irish listeners is provided in Table 7.

Conditional inference tree for /het-hat/ continuum by Irish listeners, showing significant effect of Irish Social Network Score (SNS_IE) and gender.
Summary of significant effects of extralinguistic factors for the Irish listeners.
| Stimulus | Irish |
|---|---|
| /hell-hal/ |
|
| /hit-het/ |
|
| /het-hat/ |
|
5.5 Second language perception: findings from Chinese speaker-listeners
As discussed in previous sections, the Chinese listeners had low levels of agreement, at 40–50 % in many cases, indicating uncertainty and that listeners were answering at random for most of the stimuli with the exception of /het-hat/ (Figure 8). They also had more within-group inconsistencies than the Irish or AusE listeners and had later crossovers for all stimuli, even by Step 7, which is the point at which the contrast should be the most obvious. Furthermore, the Chinese listeners appear to be generally hearing closer vowels in all cases except /het-hat/. This is not a task effect, since the trials were randomized, indicating that in many cases the listeners are selecting the phonetically closer option out of the two in a contrast. Overall, the findings indicate that, despite exposure through living and working in Australia, these Chinese participants still experience differences in making phonemic judgements about AusE stimuli as compared to L1 listeners. In the sub-sections that follow, we will analyse potential extralinguistic effects of proficiency in English and social network on the categorisation behaviour of the Chinese listeners.

Group-level responses for Chinese listeners to the six stimuli in the present study: /hit-het/ (red); /hill-hell/ (mustard); /mill-Mel/ (green); /het-hat/ (aqua); /hell-hal/ (blue); /Mel-Mal/ (pink).
5.5.1 Effect of proficiency in English
Figure 9 shows significant effects of English proficiency, as measured by IELTS score, but not in the predicted direction. Of note is that it shows that above step 5 (to the right of the tree), those with lower IELTS (≤6), which consisted of two participants (CH_018_F and CH_026_F), have crossed over almost categorically to answering with hell (Node 12), which resembles the AusE behaviour for this stimulus. Meanwhile, those with higher IELTS scores (>6) show more variation and less agreement, with almost 40 % hill responses even after Step 6. These results do not indicate that a higher IELTS score predicts more Australian-like categorisation behaviour, where crossover was at approximately step 5. Below step five (to the left of the tree), there are also differences based on IELTS score, and these are moderated by social networks, which are discussed further in Section 5.5.2.

Conditional inference tree for /hill-hell/ continuum by Chinese listeners, showing significant effect of English proficiency (IELTS).
Figure 10 shows significant effects of English proficiency, again moderated to some extent by social networks (leaf 4). There is a similar pattern to what was found for the /hill-hell/ continuum, whereby those with IELTS of ≤6 had more Australian-like crossovers. That is, above Step 5, for those with IELTS above 6.5, there are significantly more mill responses (Node 13), while for those with scores ≤6.5, there are significantly more Mel responses (Node 12), which mirrors the Australian crossovers which occurred just after the acoustic midpoint at Step 5 for this continuum. The left of the tree confirms this trend, in that it shows us that IELTS scores ≤6 have more Mel responses after Step 4 (leaf 3; Node 7).
Conditional inference tree for /mill-Mel/ continuum by Chinese listeners, showing significant effect of English proficiency (IELTS).
5.5.2 Effect of Chinese social network
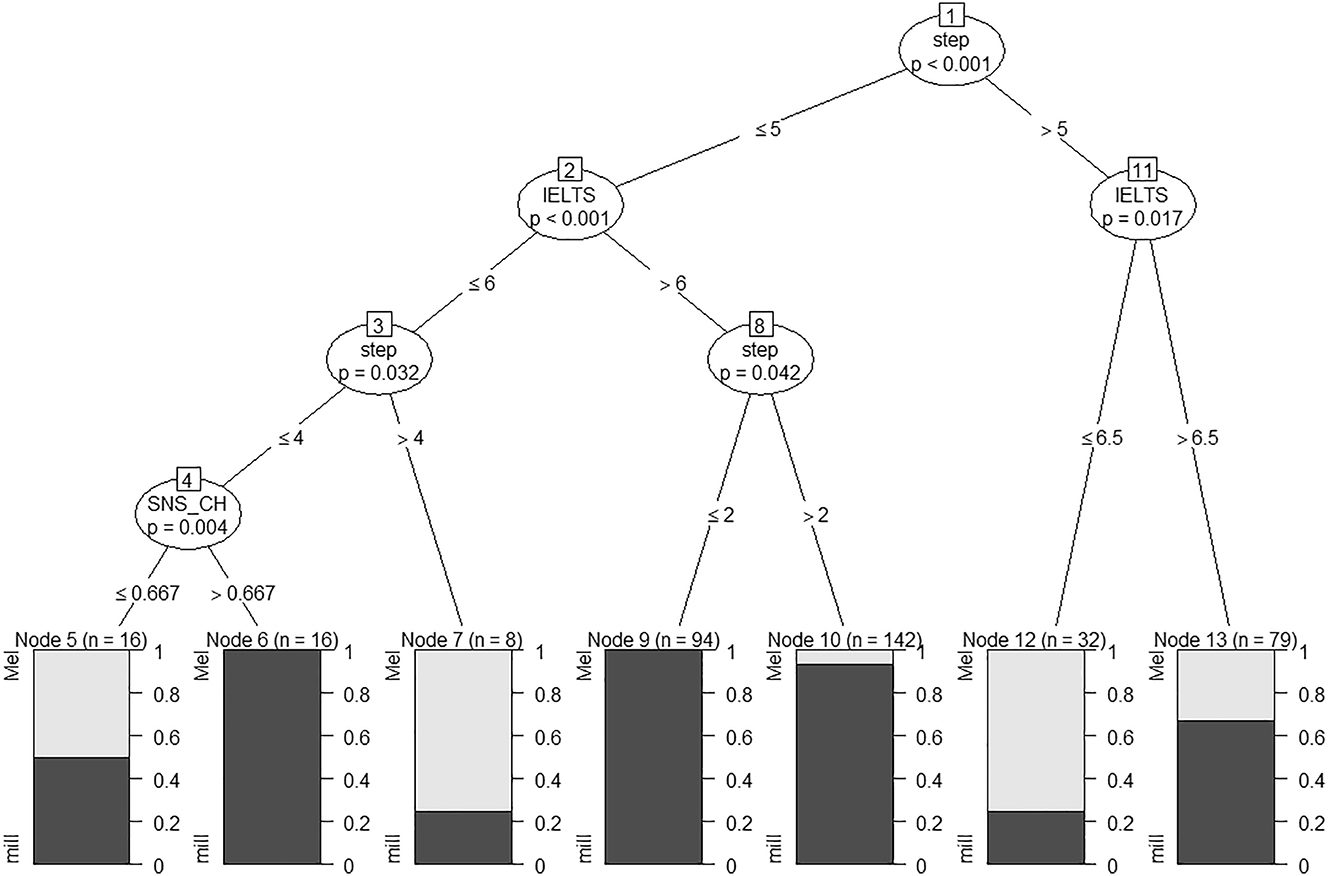
As seen above with the Irish group, for the Chinese group, there was a significant effect of having more Chinese in one’s social network, as measured by the Chinese Social Network Score (SNS_CH; Figure 11). Specifically, at and below step four of the continuum, listeners with Chinese SNS of 0.16 or lower (leaf 3) had about 60 % hit versus het responses (Node 4), which is more in the direction of an Australian-like categorisation behaviour as compared to those with higher Chinese SNS (above 0.16) who responded almost categorically with hit (Node 5).

Conditional inference tree for /hit-het/ continuum by Chinese listeners, showing significant effect of Chinese Social Network Score (SNS_CH).
Examining the effect of social networks for Chinese listeners’ responses to the /het-hat/ continuum, a significant effect of Australian social network was found (Figure 12). This showed that, between steps 1 and 5, those with low SNS_AU scores (≤0.167; leaf 4) had slightly more hat responses than het responses (Node 5), which is more in the direction of the Australian listeners, who had very early crossovers in this condition. For those with higher scores (>0.167), responses were primarily conditioned by continuum step (with hat responses gradually increasing across the continuum – Nodes 7, 8 and 9). This shows that a higher Australian social network score does not correlate with more Australian-like categorisation.

Conditional inference tree for /het-hat/ continuum by Chinese listeners, showing significant effect of Australian Social Network Score (SNS_AU).
Social network score also affected how Chinese listeners responsed to the /hill-hell/ continuum. This pattern was complex, however, as it was also conditioned by IELTS score. Returning to Figure 9, we see that at or below Step 5, for those with IELTS ≤6.5 (leaf 2), those with lower Chinese SNSs (≤0.667), had about 50 % hell responses (Node 4), while those with high Chinese SNSs (>0.667) responded almost categorically with hill (Node 5). Since Australians had a crossover at about Step 5 in this condition, there is an indication here that at least some of those with fewer Chinese people in their social network were approximating the Australian behaviour. The other split in the data for SNS (leaf 7) is less relevant, as it occurs at or below Step 4, whereas the Australian crossover was closer to Step 5.
A similar effect – whereby IELTS score dominated the effect of social network score – was seen in the analysis of the /mill-Mel/ continuum responses (Figure 13). Here, for those with IELTS scores ≤6, when responding at or below Step 4 (leaf 3), those with lower Chinese SNSs tended to respond equally with mill or Mel (Node 5). Since the Australian crossover was just after Step 5 in this condition, we can see that, again, a lower Chinese SNS score is approximating an Australian-like behaviour – at the very least in comparison to those with higher SNS (>0.667), who respond with mill categorically. A summary of results of extralinguistic factors for the Chinese listeners is provided in Table 8.

Conditional inference tree for /mill-Mel/ continuum by Chinese listeners, showing significant effects of Chinese Social Network Score (SNS_CH) and IELTS score.
Summary of significant effects of extralinguistic factors for Chinese listeners.
| Stimulus | Chinese |
|---|---|
| /hill-hell/ |
|
| /hit-het/ |
|
| /het-hat/ |
|
| /mill-Mel/ |
|
6 Discussion
6.1 Study 1: categorisation of /hVt/, /hVl/ and /mVl/ for the AusE listeners
Our first study aimed to investigate how native Australian (D1) listeners categorised the AusE vowel stimuli /ɪ e æ/, and whether these categorisation decisions would be affected by coarticulation. First, we had predicted that they would categorise /hVt/ at the acoustic midpoint (Step 4). This prediction was confirmed for /hit-het/. However, categorisation for D1 listeners was not at the acoustic midpoint for /het-hat/, with an earlier crossover point than for /hit-het/, at Step 2. Indeed, the /het-hat/ contrast posed some difficulty for D1 listeners, with only approximately 80 % agreement even at Step 1, and an overall bias towards hat. The responses suggest that D1 listeners may have required a phonetically lower vowel for het. A similar bias for hat was observed for the younger speakers in Loakes et al. (2023), which uses the same experiment on different cohorts of listeners. Lexical frequency may have also played a role in responses, since het is a relatively infrequent word in English, particularly as compared to the frequency of hat, as also observed in Loakes et al. (2023), and so listeners were likely more motivated to choose hat. This supports an exemplar-based theory of speech perception, whereby “a phonological category is defined by a distribution in a perceptual space that depends on its remembered exemplars” (Harrington et al. 2008: 2832; see also Pierrehumbert 2002).
We predicted that the effect of a following lateral would lower the vowel in perception and result in later crossovers than for the /hVt/ condition. This prediction was also confirmed. The D1 listeners had crossovers at Step 5 for /hill-hell/ and at Step 4 for /hell-Hal/, representing a later crossover of one step for /hill-hell/ as compared to /hit-het/, and a later crossover of two steps for /hell-Hal/ as compared to /het-hat/. For the /mVl/ condition, it was predicted that the effect of the nasal onset would raise the vowel in perception, resulting in earlier crossovers. The D1 listeners had crossover points at Step 4.5 for /mill-Mel/ and at Step 3.5 for /Mel-Mal/. Thus, this prediction was also confirmed, as this constituted an earlier crossover point of 0.5 steps both for /mill-Mel/ as compared to /hill-hell/ and for /Mel-Mal/ as compared to /hell-Hal/.
Despite the effects of the nasal onset and following lateral, overall, we found no strong evidence of a celery-salary merger in perception among the D1 listeners, contrary to findings by Loakes et al. (2023) for AusE speakers in southern Victoria (including Melbourne), although we did find low agreement at the /mel/ end of the /mel-Mal/ continuum, suggesting uncertainty. This is despite the fact that our listeners are born and raised in Melbourne, where the merger in production has been found among some (although not all) speaker-listeners (Loakes et al. 2017). Reasons for these differences could include the fact that the listeners in Loakes et al. (2023) are mostly (though not exclusively) older than the listeners in the current study, with some participants born as late as 1996, but many middle-aged and elderly speakers born as early as 1936. Loakes et al. (2023) found clear age differences, with more merger behaviour in perception observed among older listeners. Similar findings among older listeners were found in Ocean Grove, Victoria in Schmidt et al. (2021).
Further work into the production of the merger has shown that variability is fine-grained, with many individual differences (Diskin et al. 2019a, c; Schmidt et al. 2021). It must also be noted that the contrast in the present study is particularly complex for listeners, as it includes both a nasal onset and a following lateral. It was also found to be complex for the L2 listeners in the present study (see Section 5.3). Furthermore, as the /Mel-Mal/ contrast only has proper names as options, this likely poses no lexical competition for the AusE listeners, resulting in both Mel or Mal being plausible, although in Loakes et al. (2023), it was shown that younger listeners preferred Mel and older listeners preferred Mal, which was explained as generational differences in popularity of these names. Nonetheless, it is possible these are both equally unusual names for the Irish and Chinese listeners, so lexical frequency may be uneven amongst the various cohorts.
6.2 Study 2 Part 1: categorisation of /hVt/, /hVl/ and /mVl/ for the L2/D2 listeners
Taking all three contexts (/hVt/, /hVl/ and /mVl/) as benchmarks for comparison between the D1 as compared to the D2 and L2 groups, an ‘Australian-like categorisation behaviour’ could, for these listener groups, be described as consisting of: (1) no perceptual difficulty between the vowels /e æ/ generally (i.e., they are contrastive), (2) a midpoint crossover for /hit-het/ and an early crossover for /het-hat/; (3) a crossover for /hVl/ that is later than the crossover for /mVl/, with no perceptual difficulty for the pre-lateral contrast (i.e., no merger in perception).
While the D1 listeners categorised the /hit-het/ contrast predictably at the acoustic midpoint, D2 and L2 listeners had significantly later crossovers for /hit-het/: at Step 6 for D2 listeners and with no discernible crossover point for L2 listeners (no agreement even by Step 7). This shows that, compared to the D1 listeners, the Irish listeners had different, but internally consistent, crossovers, whereas the Chinese listeners had overall difficulty with this contrast. This supports findings by Chen et al. (2001) that English vowels not found in the Mandarin inventory (in this case, /ɪ/) could present perceptual difficulties for Mandarin listeners, as well as the findings of Iverson and Evans (2009), who found that listeners with a larger vowel inventory in their L1 may be at an advantage in learning an L2 vowel system than those with a small inventory, such as e.g., Mandarin. It does not support the findings of Jia et al. (2006) that simply being exposed to the L1 results in increased mastery of discrimination of phonology, as the Chinese participants were all immersed in an AusE setting, and there was no correlation between LOR and more Australian-like categorisations.
All listener groups behaved similarly in their categorisation of /het-hat/, with uniformly early crossovers (between Steps 2 and 3.5) and no significant differences between the responses. This suggests that the D2 and L2 groups mirrored the AusE categorisation behaviour for the /het-hat/ contrast. It is known that AusE vowels have lowered and retracted over time in production (Cox and Palethorpe 2008) and perception (Mannell 2004; also shown by Loakes et al. 2023) and this is also corroborated by our findings for /het-hat/. Since this is likely a contrast that L2/D2 listeners are exposed to in the community, this lends some weight to the proposal that experience with different contrasts can allow L2/D2 listeners to map onto similarly stored exemplars (Evans and Iverson 2004: 352). However, what we observe for the D2 listeners is that they mirror in perception what has been found for their production, with even lower and more retracted vowels as compared to the D1 cohort (Diskin et al. 2019b). Furthermore, since we found that for the /het-hat/ stimulus, Chinese with a lower Australian SNS had a more Australian-like crossover, it is possible that this contrast was simply more straightforward for the L2/D2 listeners due to mapping from their L1/D1. This is supported by their high rates of agreement for this stimulus, despite the fact that Mandarin does not have the mid front monophthongs /e/ or /eː/ (Duanmu 2007), although it does have a low vowel /a/, of which [æ] is an allophone (Wang et al. 2022: 161). This suggests that the L2 listeners were able to map somewhat unfamiliar sounds onto (either new or existing) phonological categories. The overall preference for hat may also have been due to the effect of hat being a more frequent word than het, as discussed in Section 6.1. This may particularly be the case for the L2 group, who may have had no previous exposure to the infrequent word het.
The effect of the lateral coda resulted in a downshifting in perception for all listener groups, to differing degrees. Both the D2 and L2 groups had later crossover points for /hill-hell/ and /hell-Hal/ than the D1 group, in this way behaving similarly to each other. However, for /hill-hell/, while the majority of the D1 listeners had switched to hearing hell by Step 7, still many of the D2 and L2 listeners had a preference for hill (i.e., there was low agreement at Step 7). This shows similar categorisation behaviour among both the D2 and L2 listeners for this continuum, mirroring their behaviour for the /hit-het/ contrast. This result suggests the vowel contrast in AusE may be particularly complex, regardless of the presence or absence of a following lateral. However, we do find support for the role of experience and exposure for this stimulus, as some listeners with a lower Chinese SNS (i.e., fewer Chinese in their social network) had more Australian-like crossovers. For /hell-Hal/, most, but not all, D2 and L2 listeners had switched to hearing Hal by Step 6, whereas this crossover occurred at the acoustic midpoint for the D1 listeners. This again mirrors the patterns for /hit-het/. No significant extralinguistic factors emerged for the /hell-Hal/ stimulus, other than the fact that Irish listeners with a shorter LOR had more Australian-like categorisations, meaning that the role of experience/exposure to the D2 is likely minimal for this contrast.
The crossovers between /e æ/ in the nasal onset condition were not perceptually difficult for the D1 or the D2 listeners. In the case of /mill-Mel/, the D2 listeners sustained mill responses longer than the D1 listeners, but also had high levels of agreement at the beginning and end of the continuum. Since no extralinguistic factors emerged as significant for this stimulus, it is more likely that the Irish listeners were mapping onto stored exemplars from their L1, rather than exhibiting any changes in categorisation behaviour over time. For the L2 listeners, however, the /mVl/ context appeared to present difficulty, with listeners responding below chance level at the /Mal/ end of the continuum.
Our prediction that the D2 and L2 listeners would display different categorisation behaviour to the D1 listeners, due to a ‘perceptual filter’ from their native dialect/language (Best 1995; Best and Strange 1992; Escudero 2007), was supported somewhat, particularly for the D2 listeners in the /hit-het/ and /hVl/ and /mVl/ contexts. However, the D2 listeners also aligned somewhat with the D1 listeners when it came to their categorisation behaviour for the /het-hat/ contrast and their upshifting and downshifting behaviour in the /hVl/ and /mVl/ contexts respectively. This shows that D1 and D2 listeners patterned more closely together in their categorisation behaviour, which is understandable since both groups share the same native language. The L2 listeners generally behaved differently to the D1 and D2 listeners, except for the /het-hat/ contrast, where there were no significant inter-group differences. Since the L2 listeners showed evidence of perceptual difficulty and lack of agreement in all contexts but one, it can be deduced that they were still very much guided by their L1 in distinguishing between contrasts in the L2. The difficulty appeared to be more acute in the /mVl/ conditions (with very late crossovers) than in the /hVl/ conditions, as well as for /hit-het/. This could be explained by the fact that Mandarin speakers have been found to have less carryover of nasality into the following vowel than speakers of English (Li et al. 2020).
6.3 Study 2 Part 2: the effect of LOR, social networks, proficiency and gender
We predicted that, due to listening experience gained while living and working or studying in Australia, D2 and L2 listeners would have more Australian-like vowel categorisations (as established via the D1 benchmark group) if they had lived in Australia for longer; had more Australians in their social network; and in the case of the L2 listeners, a higher proficiency in English. We also predicted that listeners would have less Australian-like categorisations if they had a high proportion of people of their own nationality (Irish or Chinese) in their social network. We predicted no gender effects in line with Loakes et al. (2023).
Our prediction regarding LOR was not supported. For /hell-hal/, after step 4, D2 listeners with LOR of less than 3.5 years had more Hal responses than hell responses (more Australian-like), while those with LORs of longer than 3.5 years had more hell responses at step 4 or 5 (less Australian-like). This suggests little effect of LOR on the potential for an Australian-like categorisation behaviour among the D2 listeners. The finding supports similar (but not identical) work by e.g., Shaw et al. (2018), showing that vowel assimilations can be unaffected by exposure to other talkers’ accent-specific variation (in the Irish case, exposure is via living and working in Australia). It also supports work by Nycz (2019), showing that LOR in a D2 community has less of an effect on acquisition of a contrast than the effect of being married to a speaker of the D2 – in other words, exposure needs to be both frequent and sustained for D2-like contrasts to be acquired. Our findings and those of Nycz (2019) provide impetus for further studies to incorporate social network analyses and work focusing on the quality as well as quantity of input.
For the /hit-het/ stimulus, both LOR and gender had an effect on the D2 listeners’ categorisations, where above step 4 and among those with longer LORs, women had more het responses. The D1 listeners crossed over to het responses at step 4 in this condition, suggesting that, among the female listeners at least, LOR may have had some effect on attaining an Australian-like categorisation. However, an effect was also found for men with an LOR of 6 years or less having more het responses after Step 5. This suggests that neither LOR nor gender were positively correlated with Australian-like categorisations. Regarding the differences in gender, previous studies on AusE using these stimuli have shown no gender effects for listeners (e.g., Loakes et al. 2014a, 2023), leading us to predict that this result is likely based on differences in social networks and increased resultant exposure to AusE voices in our study. The overall weak effect of LOR suggests that simply residing in another country is less important than the type and quality of exposure that a D2 listener receives during this time, which supports work by Ingram and Park (1997) and Polka (1995) on the role of listener experience in perception.
Similarly, for the L2 listeners with the /hit-het/ stimulus, at and below step four of the continuum, listeners with a low degree of Chinese people in their social network provided more hit than het responses (somewhat more Australian-like), but those with more Chinese people in their social network responded almost categorically with hit at or below step 4 of the continuum (not at all Australian-like). This suggests that having more Chinese in one’s social network may be an inhibiting factor in acquiring an Australian-like categorisation, which would see the crossover from hit to het occurring at the acoustic midpoint. This finding supports the role of experience (i.e., exposure) in perception of vowel contrasts (Cutler 2012; Pierrehumbert 2002). For the /het-hat/ stimulus, between steps 1 and 5, the L2 listeners with fewer Australians in their social network had slightly more hat responses than het responses (more Australian-like), while for those with higher scores, responses were primarily conditioned by continuum step (with hat responses gradually increasing across the continuum). This shows little support for the effect of a higher Australian SNS for this stimulus.
Furthermore, any effect of proficiency in English (for the L2 listeners only) was only found in interaction with social network. For /hill-hell/ below Step 5, for those with IELTS ≤6.5, some of those with fewer Chinese people in their network displayed a tendency to respond slightly more with hell (more Australian-like), while those with more Chinese in their network responded almost categorically with hill (less Australian-like). For those with higher IELTS scores (>6.5), there was a small difference between those with fewer Chinese in their network, who provided a few hell responses at or below step 4 (more Australian-like), while those with more Chinese in their network all responded entirely with hill (less Australian-like). Overall, these nuances suggest that the perception of vowel contrasts is a complex task, most likely supported by experience and exposure with the L1, rather than proficiency. Perception can also be affected specifically by L2 vocabulary size, as found by Wang et al. (2023). As with L2 production, there are myriad factors that predict success in native-like acquisition (see Ellis 2008: Ch. 13 for an overview) that go beyond proficiency as measured in standardised tests. It should be noted, however, that the Chinese participants did have a high overall average proficiency in English, making it more difficult to measure the effect of e.g., low versus high proficiency in this study.
7 Conclusions
Our findings from study 1 show that our categorisation task works well for AusE D1 listeners, who in all conditions except one, had crossovers at the acoustic midpoint. We found little evidence of the /el/-/æl/ merger in our cohort, despite the AusE D1 listeners being born and raised in Victoria. An overall effect of coarticulation across the three groups of speakers was found, with the lateral coda lowering the vowel in perception, resulting in ‘downshifting’ and later category crossovers.
Study 2 shows that L2 listeners’ exposure and experience with the L2 (AusE) can promote more native-like perceptual behaviour, in line with Best and Strange (1992: 328). This experience is crucially not reflected in the length of time spent in the L1 community per se, nor in their overall proficiency in English, but specifically in time spent with people other than their own nationality (Chinese). Our social network analysis showed that by spending less time with other Chinese speakers, listeners may begin to gradually adopt more Australian-like categorisation behaviour. Conversely, spending extended or exclusive time with other L1 speakers results in the L1 continuing to be reinforced. The social network analysis emerged as a meaningful aspect of listener’s experience and one that could be given more attention in future research (see also Nycz 2019).
Regarding experience, a different trend emerged for D2 listeners, whereby only a weak effect of LOR in interaction with gender emerged as significant for one of the stimuli. Indeed, the majority of our analyses showed that D2 listeners continue to rely on categorisations from their D1 to guide their perception, reflecting their behaviour in production (see Diskin et al. 2019b; Evans and Iverson 2007). Our findings suggest that categorisation is likely still driven by native categories, with increased exposure leading to better mapping, but not to a restructuring of underlying phonetic categories (see e.g., Iverson and Evans 2009).[5]
Naturally, the question remains as to whether the listeners in the present study were consciously adapting their perception since they knew they were listening to AusE, and whether their perceptual behaviour shifts categorically to AusE, or simply becomes more flexible over time. Future work incorporating different kinds of perception and processing tasks, further inclusion of extralinguistic factors, and different contrasts, both among D2 and L2 listeners, could further elucidate this.
Funding source: University of Melbourne
Award Identifier / Grant number: A sociolinguistic investigation of the adoption of
Acknowledgements
The authors would like to thank the audiences at the Variation in Language Processing (VALP) conference (2019) and at Language Variation and Change-Australia (2019) for their questions and feedback. We would also like to thank the Superdiversity project team at the University of Melbourne, particularly Rosey Billington and Hywel Stoakes, for their assistance with data collection.
-
Author contributions: Conceptualization, Authors 1 and 2; methodology, Authors 1 and 2; software, Authors 1, 2 and 3; formal analysis, Author 3; investigation, Authors 1 and 2; resources, Authors 1 and 2; data curation, Authors 1 and 2; writing – original draft preparation, Author 1; writing – review and editing, Authors 1, 2 and 3; visualization, Author 3; supervision, Authors 1 and 2; project administration, Author 1; funding acquisition, Authors 1 and 2. All authors have read and agreed to the published version of the manuscript.
-
Competing interests: The authors have no conflicts of interest to declare. This research was funded by The University of Melbourne, who had no role in the design of the study; in the collection, analyses, or interpretation of data; in the writing of the manuscript, or in the decision to publish the results.
-
Ethics statement: The study was conducted according to the guidelines of the Declaration of Helsinki and approved by the Ethics Committee at the University of Melbourne (reference number 1648323; date of approval 2nd December 2016). Informed consent was obtained from all subjects involved in the study.
References
Baayen, HaraldR. 2008. Analyzing linguistic data : a practical introduction to statistics using R. Cambridge: Cambridge University Press.10.1017/CBO9780511801686Search in Google Scholar
Barth, Danielle & Stefan Schnell. 2022. Understanding corpus linguistics. New York: Routledge.10.4324/9780429269035Search in Google Scholar
Bates, Douglas, Martin Maechler, Ben Bolker & Steve Walker. 2015. Fitting linear mixed-effects models using lme4. Journal of Statistical Software 67(1). 1–48. https://doi.org/10.18637/jss.v067.i01.Search in Google Scholar
Best, Catherine T. 1995. A direct realist perspective of cross-language speech perception. In Winifred Strange (ed.), Speech perception and linguistic experience: Issues in cross-language research, 167–200. Baltimore: York Press.Search in Google Scholar
Best, Catherine & Winifred Strange. 1992. Effects of phonological and phonetic perception on cross-language perception of approximants. Journal of Phonetics 20. 305–330. https://doi.org/10.1016/s0095-4470(19)30637-0.Search in Google Scholar
Boersma, Paul & David Weenink. 2018. Praat: Doing phonetics by computer [Computer program], Version 6.0.40. Available at: http://www.praat.org/.Search in Google Scholar
Bradley, David. 1989. Regional differences in Australian English phonology. University of Melbourne Working Papers in Linguistics 6. 73–92.Search in Google Scholar
Chen, Yang, Michael Robb, Harvey Gilbert & Jay Lerman. 2001. Vowel production by Mandarin speakers of English. Clinical Linguistics 15(6). 427–440. https://doi.org/10.1080/02699200110044804.Search in Google Scholar
Clopper, Cynthia G. 2014. Sound change in the individual: Effects of exposure on cross-dialect speech processing. Laboratory Phonology 5(1). 69–90. https://doi.org/10.1515/lp-2014-0004.Search in Google Scholar
Corrigan, Karen P. 2010. Irish English. Volume 1 – Northern Ireland. Edinburgh: Edinburgh University Press.10.3366/edinburgh/9780748634286.001.0001Search in Google Scholar
Cox, Felicity & Sallyanne Palethorpe. 2003. The border effect: Vowel differences across the NSW – Victorian border. Proceedings of the 2003 conference of the Australian Linguistic Society.Search in Google Scholar
Cox, Felicity & Sallyanne Palethorpe. 2008. Reversal of short front vowel raising in Australian English. Proceedings of Interspeech 2008, 342–345. Brisbane, Australia: International Speech Communication Association (ISCA).10.21437/Interspeech.2008-144Search in Google Scholar
Cox, Felicity & Janet Fletcher. 2017. Australian English: Pronunciation and transcription. Cambridge: Cambridge University Press.10.1017/9781316995631Search in Google Scholar
Cutler, Anne. 2012. Native listening: Language experience and the recognition of spoken words. Cambridge, MA: MIT Press.10.7551/mitpress/9012.001.0001Search in Google Scholar
Diskin, Chloé, Debbie Loakes, Rosey Billington, Simon Gonzalez, Ben Volchok & Josh Clothier. 2019a. Sociophonetic variability in the /el/-/ael/ merger in Australian (Melbourne) English: Comparing wordlist and conversational data. Poster presented at New Ways of Analyzing Variation 48, University of Oregon, USA.Search in Google Scholar
Diskin, Chloé, Deborah Loakes & Josh Clothier. 2018. Varietal differences in categorisation of /ɪ e æ/ : A case study of Irish and Australian English listeners in Melbourne. Proceedings of the 17th Australasian International Conference on Speech Science and Technology 105–108.Search in Google Scholar
Diskin, Chloé, Debbie Loakes, Josh Clothier & Ben Volchok. 2019b. A sociophonetic analysis of vowels produced by female Irish migrants: Investigating second dialect contact in Melbourne. In Proceedings of the International Congress for the Phonetic Sciences, 1873–1877. Melbourne, Australia: Australasian Speech Science and Technology Association Inc.Search in Google Scholar
Diskin, Chloé, Debbie Loakes, Rosey Billington, Hywel Stoakes, Simon Gonzalez & Sam Kirkham. 2019c. The /el/-/æl/ merger in Australian English: Acoustic and articulatory insights. In Proceedings of the International Congress for the Phonetic Sciences, 1764–1768. Melbourne, Australia: Australasian Speech Science and Technology Association Inc.Search in Google Scholar
Diskin, Chloé, Debbie Loakes & Josh Clothier. 2018. Varietal differences in categorisation of /ɪ e æ/: A case study of Irish and Australian English listeners in Melbourne. In Proceedings of the 17th Australasian Speech Science and Technology Conference (SST), 105–108. Sydney, Australia: Coogee.Search in Google Scholar
Duanmu, San. 2007. The phonology of standard Chinese. Oxford: Oxford University Press.10.1093/oso/9780199215782.001.0001Search in Google Scholar
Ellis, Rod. 2008. The study of second language acquisition, 2nd edn. Oxford: Oxford University Press.Search in Google Scholar
Escudero, Paola. 2007. Second language phonology: The role of perception. In Martha C. Pennington (ed.), Phonology in context, 109–134. London: Palgrave Macmillan.10.1057/9780230625396_5Search in Google Scholar
Evans, Bronwen G. & Paul Iverson. 2004. Vowel normalization for accent: An investigation of best exemplar locations in northern and southern British English sentences. Journal of the Acoustical Society of America 115(1). 352–361. https://doi.org/10.1121/1.1635413.Search in Google Scholar
Evans, Bronwen G. & Paul Iverson. 2007. Plasticity in vowel perception and production: A study of accent change in young adults. Journal of the Acoustical Society of America 121. 3814–3826. https://doi.org/10.1121/1.2722209.Search in Google Scholar
Ferragne, Emmanuel & Francois Pellegrino. 2010. Vowel systems and accent similarity in the British Isles: Exploiting multidimensional acoustic distances in phonetics. Journal of Phonetics 38(4). 526–539. https://doi.org/10.1016/j.wocn.2010.07.002.Search in Google Scholar
Flege, James, Bocke Ocke-Schwen & Yang Sun-Young. 1997. Effects of experience on non-native speakers’ production and perception of English vowels. Journal of Phonetics 89(6). 437–470.10.1006/jpho.1997.0052Search in Google Scholar
Harrington, Jonathan, Felicitas Kleber & Ulrich Reubold. 2008. Compensation for coarticulation, /u/-fronting, and sound change in standard southern British: An acoustic and perceptual study. Journal of the Acoustical Society of America 123(5). 2825–2835. https://doi.org/10.1121/1.2897042.Search in Google Scholar
Hickey, Raymond. 2005. Dublin English: Evolution and change. Amsterdam: John Benjamins.10.1075/veaw.g35Search in Google Scholar
Hickey, Raymond. 2008. Irish English: Phonology. In Bernd Kortmann, Clive Upton & Edgar W. Schneider (eds.), Varieties of English 1: The British Isles, 71–104. Berlin, New York: De Gruyter Mouton.10.1515/9783110208399.1.71Search in Google Scholar
Hickey, Raymond. 2018. ‘Yes, that’s the best’: Short front vowel lowering in English today: Young people across the Anglophone world are changing their pronunciation of vowels according to a change which started in North America. English Today 34(2). 9–16. https://doi.org/10.1017/S0266078417000487.Search in Google Scholar
Horvath, Barbara M. 1985. Variation in Australian English: The sociolects of Sydney. Cambridge; New York: Cambridge University Press.Search in Google Scholar
Ingram, John & See-Gyoon Park. 1997. Cross-language vowel perception and production by Japanese and Korean learners of English. Journal of Phonetics 25. 343–370. https://doi.org/10.1006/jpho.1997.0048.Search in Google Scholar
Iverson, Paul & Bronwen G. Evans. 2009. Learning English vowels with different first-language vowel systems II: Auditory training for native Spanish and German speakers. Journal of the Acoustical Society of America 126(2). 866–877. https://doi.org/10.1121/1.3148196.Search in Google Scholar
Jia, Gisela, Winifred Strange, Yanhong Wu, Julissa Collado & Qi Guan. 2006. Perception and production of English vowels by Mandarin speakers: Age-related differences vary with amount of L2 exposure. The Journal of the Acoustical Society of America 119. 1118. https://doi.org/10.1121/1.2151806.Search in Google Scholar
Kallen, Jeffrey L. 2013. Irish English, volume 2: The Republic of Ireland. Berlin: Mouton de Gruyter.10.1515/9781614511298Search in Google Scholar
Kendall, Tyler & Valerie Fridland. 2012. Variation in perception and production of mid-front vowels in the U.S. Southern Vowel Shift. Journal of Phonetics 40(2). 289–306. https://doi.org/10.1016/j.wocn.2011.12.002.Search in Google Scholar
Kleber, Felicitas, Jonathan Harrington & Ulrich Reubold. 2011. The relationship between the perception and production of coarticulation during a sound change in progress. Language and Speech 55(3). 383–405. https://doi.org/10.1177/0023830911422194.Search in Google Scholar
Labov, William. 2001. Principles of linguistic change. Volume II: Social factors. Oxford: Basil Blackwell.Search in Google Scholar
Levshina, Natalia. 2015. How to do linguistics with R: Data exploration and statistical analysis. Amsterdam & Philadelphia: John Benjamins.10.1075/z.195Search in Google Scholar
Levshina, Natalia. 2020. Conditional inference trees and random forests. In Magali Paquot & Stefan Th Gries (eds.), A practical handbook of corpus linguistics, 611–643. Cham: Springer International Publishing.10.1007/978-3-030-46216-1_25Search in Google Scholar
Li, Hongmei, Sahyang Kim & Taehong Cho. 2020. Prosodic structurally conditioned variation of coarticulatory vowel nasalization in Mandarin Chinese: Its language specificity and cross-linguistic generalizability. Journal of the Acoustical Society of America 148. EL240. https://doi.org/10.1121/10.0001743.Search in Google Scholar
Lively, Scott, John Logan & David Pisoni. 1993. Training Japanese listeners to identify English /r/ and /l/. II: The role of phonetic environment and talker variability in learning new perceptual categories. Journal of the Acoustical Society of America 94(3). 1242–1255. https://doi.org/10.1121/1.408177.Search in Google Scholar
Llamas, Carmen. 1999. A new methodology: Data elicitation for social and regional language variation studies. Leeds Working Papers in Linguistics and Phonetics 7. 95–118.Search in Google Scholar
Loakes, Debbie. 2019. Sociophonetics of Australian English. In Louisa Willoughby & Howard Manns (eds.), Australian English Reimagined: Structure, features and developments, 103–119. London: Routledge.10.4324/9780429019692-9Search in Google Scholar
Loakes, Debbie, Josh Clothier, John Hajek & Janet Fletcher. 2014a. Identifying /el/-/æl/: A comparison between two regional Australian towns. In Jen Hay & Emma Parnell (eds.), Proceedings of the 15th Australasian International Conference on Speech Science and Technology, 41–44. Canterbury: ASSTA.Search in Google Scholar
Loakes, Debbie, Josh Clothier, John Hajek & Janet Fletcher. 2014b. An investigation of the /el/-/æl/ merger in Australian English: A pilot study on production and perception in South-West Victoria. Australian Journal of Linguistics 34(4). 436–452. https://doi.org/10.1080/07268602.2014.929078.Search in Google Scholar
Loakes, Debbie, Josh Clothier, John Hajek & Janet Fletcher. 2023. Sociophonetic variation in vowel categorization of Australian English. Language and Speech 0(0). https://doi.org/10.1177/00238309231198520.Search in Google Scholar
Loakes, Debbie, John Hajek & Janet Fletcher. 2017. An overview of the dress and trap vowels before /l/ as a regional accent marker in Australian English. English World-Wide 38(1). 29–49. https://doi.org/10.1075/eww.38.1.03loa.Search in Google Scholar
Loakes, Debbie, Paola Escudero, Josh Clothier & John Hajek. 2019. Tracking vowel categorisation behaviour longitudinally: A study across three x three-year increments (2012, 2015, 2018). Proceedings of the International Congress for the Phonetic Sciences, 2787–2891. Melbourne, Australia: Australasian Speech Science and Technology Association Inc.Search in Google Scholar
Lonergan, John. 2013. An Acoustic and perceptual study of Dublin English phonology. Dublin: University College Dublin PhD thesis.Search in Google Scholar
Mannell, Robert. 2004. Perceptual vowel space for Australian English lax vowels: 1988 and 2004. In Proceedings of the 10th Australasian International Conference on Speech Science and Technology, 221–226. Sydney, Australia: Macquarie University.Search in Google Scholar
Milroy, Lesley. 1987. Language and social networks, vol. 2. Oxford & New York: Basil Blackwell.Search in Google Scholar
Nycz, Jennifer. 2019. Linguistic and social factors favoring acquisition of contrast in a new dialect. Proceedings of the International Congress for the Phonetic Sciences, 1480–1484. Melbourne, Australia: Australasian Speech Science and Technology Association Inc.Search in Google Scholar
Nycz, Jennifer. 2013. New contrast acquisition: Methodological issues and theoretical implications. English Language & Linguistics 17(2). 325–357. https://doi.org/10.1017/S1360674313000051.Search in Google Scholar
Pierrehumbert, Janet. 2002. Word-specific phonetics. In Carlos Gussenhoven & Natasha Warner (eds.), Laboratory phonology VII, 101–140. Berlin: Mouton de Gruyter.10.1515/9783110197105.1.101Search in Google Scholar
Pinet, Melanie, Yuanlin Gan, Bronwen Evans & Paul Iverson. 2015. Intelligibility of British English accents in noise for second-language learners. In Proceedings of the 18th International Congress of Phonetic Sciences. Glasgow, UK.Search in Google Scholar
Plichta, Bartek & Dennis Preston. 2004. Akustyk for PRAAT [Computer program], Version 1.7.2. East Lansing: Michigan State University.Search in Google Scholar
Polka, Linda. 1995. Cross-language speech perception in adults: Phonemic, phonetic, and acoustic contributions. The Journal of the Acoustical Society of America 97. 2961–2977. https://doi.org/10.1121/1.400734.Search in Google Scholar
R Core Team. 2020. R: A language and environment for statistical computing. Vienna, Austria: R Foundation for Statistical Computing.Search in Google Scholar
RStudio Team. 2020. RStudio: Integrated development for R. Boston, MA: RStudio, Inc. (Version 1.3.1056). Available at: http://www.rstudio.com/.10.1007/978-3-662-62518-7_1Search in Google Scholar
Schmidt, Penelope, Chloé Diskin-Holdaway & Debbie Loakes. 2021. New insights into /el/-/æl/ merging in Australian English. Australian Journal of Linguistics 41(1). 66–95. https://doi.org/10.1080/07268602.2021.1905607.Search in Google Scholar
Schweinberger, Martin. 2021. The language technology and data analysis laboratory (LADAL). Version 2021.10.09. Available at: https://slcladal.github.io/index.html.Search in Google Scholar
Shaw, Jason A., Catherine T. Best, Gerard Docherty, Bronwen G. Evans, Paul Foulkes, Jennifer Hay & Karen E. Mulak. 2018. Resilience of English vowel perception across regional accent variation. Laboratory Phonology 9(1). 1–36. https://doi.org/10.5334/labphon.87.Search in Google Scholar
Sumner, Meghan & Arthur G. Samuel. 2009. The effect of experience on the perception and representation of dialect variation. Journal of Memory and Language 60(4). 487–501. https://doi.org/10.1016/j.jml.2009.01.001.Search in Google Scholar
Tagliamonte, SaliA. & Harald BaayenR. 2012. Models, forests, and trees of york English: Was/were variation as a case study for statistical practice. Language Variation and Change 24(2). 135–178. https://doi.org/10.1017/S0954394512000129.Search in Google Scholar
Wang, Yizhou, Rikke Bundgaard-Nielsen, Brett Baker & Olga Maxwell. 2022. Accuracy-latency association in discrimination of L2 vowel contrasts. In Rosey Billington (ed.), Proceedings of the Eighteenth Australasian International Conference on Speech Science and Technology, 161–165. Canberra: Australasian Speech Science and Technology Association.Search in Google Scholar
Wang, Yizhou, Rikke L. Bundgaard-Nielsen, Brett J. Baker & Olga Maxwell. 2023. Same vowels but different contrasts: Mandarin listeners’ perception of English /ei/-/iː/ in unfamiliar phonotactic contexts. Journal of Phonetics 97. 101221. https://doi.org/10.1016/j.wocn.2023.101221.Search in Google Scholar
Weber, Andrea & Anne Cutler. 2006. First-language phonotactics in second language listening. Journal of the Acoustical Society of America 119(1). 597–607. https://doi.org/10.1121/1.2141003.Search in Google Scholar
© 2023 the author(s), published by De Gruyter, Berlin/Boston
This work is licensed under the Creative Commons Attribution 4.0 International License.
Articles in the same Issue
- Frontmatter
- Research Articles
- Variability in cross-language and cross-dialect perception. How Irish and Chinese migrants process Australian English vowels
- On the two rhotic schwas in Southwestern Mandarin: when homophony meets morphology in articulation
- To stress or not to stress: what can Mandarin pronouns inform us of the accessibility of topic and focus?