Geopolitical Risk and the LNG-LPG Trade
-
Nektarios A. Michail


Abstract
We explore the relationship between Liquified Natural Gas (LNG) and Liquified Petroleum Gas (LPG) carrier freight rates and global geopolitical risk, while also controlling for the macro environment. Our results show that a shock in geopolitical risk significantly increases the cost of the spot charter rates for both LNG and LPG carriers, with the impact reaching around 25% for the former and 18% for the latter. Our results bear significant implications for both the companies and the countries involved in the liquefied gas trade, with its importance growing as the use of this energy source is likely to continue substituting other fossil fuels in the future.
1 Introduction
The shipping industry (i.e. the sea-going transportation services) can be separated in four different segments, namely dry bulk, wet bulk, containerships, and liquefied gas carriers (Liquified Natural Gas (LNG, thereafter) & Liquified Petroleum Gas (LPG, thereafter)), as per `Stopford (2013). While the first three segments have been extensively researched, a lack in studies with regards to the fourth segment exists, something that contradicts the increased importance of the LNG and LPG trade across the world (Angelopoulos et al. 2020).
The main reason for the increase of interest in the field is the global shift that has occurred in energy production. More specifically, the Kyoto Protocol has pledged the reduction of CO2-emitting fossil fuels (namely coal and petroleum) as energy sources, in order to minimize global warming (Sinn 2008). Through the lens of a global shift towards “greener” alternatives, the European Union has led the way with an ambitious carbon emissions reduction target by 2030 (Skjærseth 2018).
While neither natural nor petroleum gas are considered to be the most environmentally friendly energy resources, they are a middle ground solution between the sustainable, renewable, energy sources, (e.g. solar, wind, hydro, etc.,) and the long standing, heavy carbon-emitting fossil fuel resources like coal or oil. These gases are still within the spectrum of fossil fuels, however, they are both considered as the least environmentally interventional among their alternatives. Even though renewable energy resources can have a negative effect on the LNG and LPG trades (Najm and Matsumoto 2020), the rate of substitution of fossil fuels with greener alternatives appears not to be fast enough: over the past 30 years demand for seaborne LNG transport has increased by 553%, while LPG has seen a 232% increase (Figure 1). Studies have shown that while renewable energy resources can benefit the economy as a whole, the large amounts needed for the initial investment make both governments and corporations reluctant to cover for them (Lin et al. 2017; Nurul Hossain and Serletis 2017; Wesseh and Lin 2020). Hence, for the time being, the use of LNG and LPG as alternatives to oil and coal appears to become more attractive.

World Seaborne Gas Trade.
This increase in attractiveness is not only environmentally important but, given the significance that natural resources have on a geopolitical perspective, both resources are vital on a national security level. Natural resources are considered the prime paragon of stability of each country given the importance that they have on the production process. Furthermore, the latter increase is economically intuitive since the gas sector is price-inelastic concerning demand, especially in the short-run (Girardi 2021).
Numerous studies that have looked into the topic of energy security from various viewpoints (see Ang et al. 2015). Energy security is important for policy makers as it promotes peace among countries (Chuang and Ma 2013; Ediger and Berk 2011; Jewell et al. 2014). Additionally, given that businesses are the largest energy consumers, they rely on a steady flow of energy in order to keep their production undisrupted (Streimikiene et al. 2007). Finally, households, alike businesses, care for an undisrupted supply of energy in order to have a stable quality of life (Angelis-Dimakis et al. 2012). However, when instability arises (due to conflicts, acts of aggression, etc.), the economic activity of both the involved countries as well as those that depend on them are also affected. The literature has already shown that geopolitical factors affect the price of crude oil (Li et al. 2020), employment and investments (Baker et al. 2016), asset prices (Brogaard and Detzel 2015), and eventually the global GDP (Soybilgen et al. 2019).
Thus, in this study, we explore how geopolitical risk affects the freight rates of the LNG and the LPG vessels. The research question that we are addressing is particularly important in the current turbulent times since there is limited research concerning the supply chain economics that affect the LNG and the LPG markets (see also Al-Yafei et al. 2021). As is well known, as supply-side (i.e. transportation) costs increase, so will the economic burden assumed by the importing country’s businesses and households, via an increase in the inflation rate. To examine this, we have employed data from three LPG routes (Gulf to Japan, Houston to Chiba, and Houston to Flushing) and three LNG routes (Sabine Pass to Zeebrugge, Sabine Pass to Tianjin, and Gladstone to Tokyo). Our results show that geopolitical risk affects the freight rates of all the above-mentioned trade routes freight rates significantly. More precisely, LNG freight rates increase by 25% on average when a geopolitical shock arises, while LPG freight rates increase by an average of 18%.
Our results bear significant implications not solely for the maritime sector but also for the political stability of the relevant regions. Large increases in energy prices have long been documented to act as catalysts in a spiral of political upheaval (Taghizadeh-Hesary et al. 2019; Tergin 2006; Thorbecke 2019). As such, while some market players can benefit from these off-equilibrium deviations, countries that rely more on gas resources face both potential political upheaval as a result of a rise in social costs, as well as, economic trade imbalances (Goodarzi et al. 2019; Wu et al. 2019). As such, countries that would like to minimize their exposure to geopolitical risk, may consider a diversification of their gas suppliers by employing more vessels and not relying solely to pipeline transportation, as is the case nowadays. In addition, the use of long-term charters could also tie costs at a particular level, thus allowing them to be less affected by unexpected events.
Following this introduction, the remainder of this paper is organized as follows: Section 2 provides a review of the literature on the issue, Section 3 describes the methodology and the data used, Section 4 discusses the empirical results obtained, and Section 5 concludes on the findings.
2 Review of the Related Literature
2.1 The LNG Trade
Natural gas is generally extracted in specific countries and its transport can take two different forms, either via pipelines or via ocean-going vessels. The major country in natural gas exports is Qatar since it accounts for 30% of the total global exports, while the largest LNG importers are China’s mainland, India, South Korea, Japan and Taiwan (Shaikh et al. 2016). Nevertheless, unlike the oil market where transportation contracts are fixed for long periods of time, the natural gas market is dominated by short-term contracts where the exporter is looking for the best offer in the market (Jensen and Oxford Institute for Energy Studies 2004; Maxwell and Zhu 2011).
The novel findings of Geng et al. (2014) show that there are three different markets when it comes to LNG, namely North America, Europe and Asia. In Graph 1, we can observe that there are various pipelines in the above mentioned areas that are transporting natural gas from the initial source to the required places. Nevertheless, if the supply and demand is within the same country, there are no political frictions.
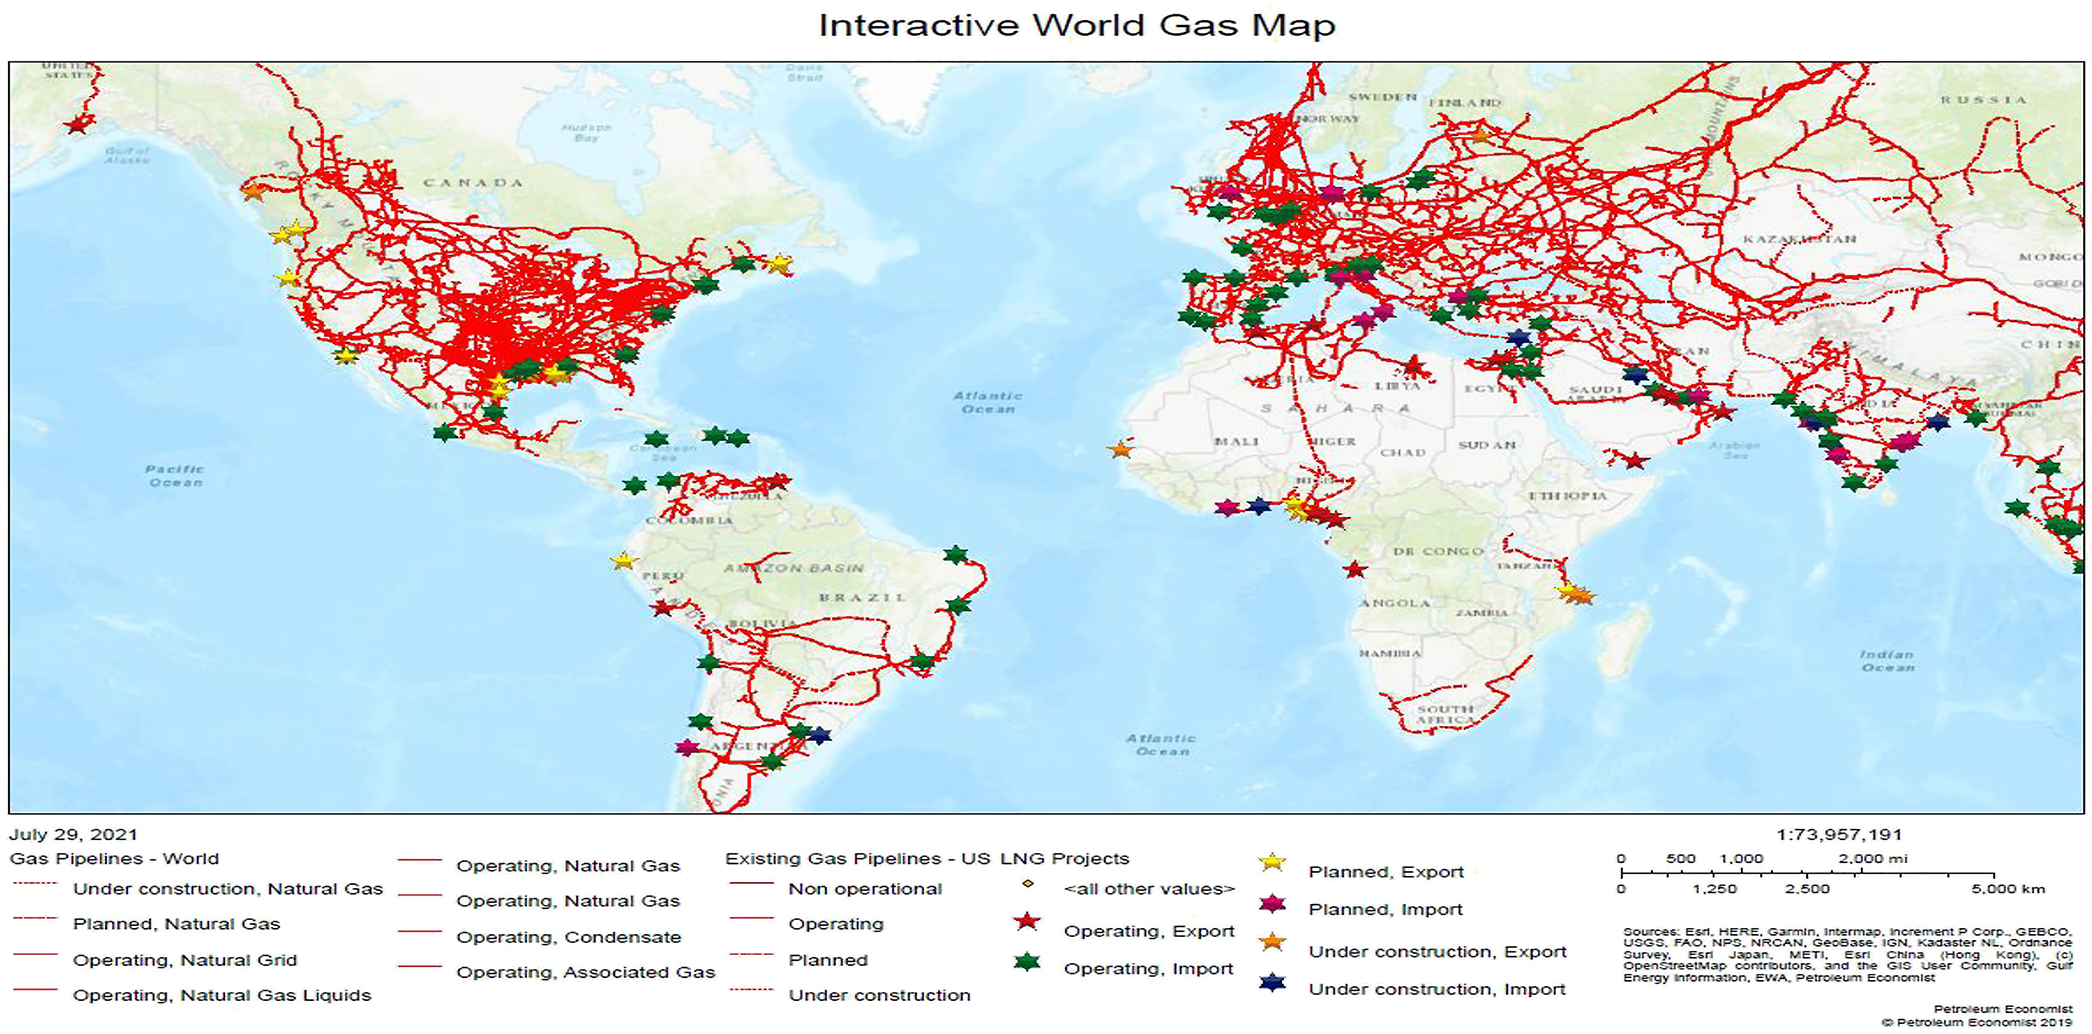
Interactive World Gas Map. Extract from the Interactive World Gas Map © Petroleum Economist.
On the contrary, when pipelines are running through different countries, quite often, political tensions arise (Goldman 2008; Liu et al. 2017; Winrow 2016). A country now, or a group of countries, like Europe, can avoid such conflicts given that it is not solely depended from a single supplier, which will ultimately act as a monopolistic seller. This option is primarily given by the fact that natural gas can also be transported via ocean going vessels. Nevertheless, the above mentioned capability has been under-researched and only in the context of supply and demand and the equivalent prices of freight rates or vessel prices (Bai and Lam 2019a, 2019b). To our knowledge, the only study concerning the energy efficiency of LNG demand is conducted by Yin and Lam (2021), who suggest that the trade between China and other countries concerning LNG should be further enhanced, in order for China to be sustainable on this matter. Nevertheless, on the economic end, researchers have conflicted views between the final outcome of the LNG trade when it comes to which country will benefit in the long-run. Lin and Brooks (2021) provide evidence that the scenario for a low-carbon Europe in 2050 will ultimately harm the US economic trade flows to the EU region while the Russian and the Middle East gas trade will benefit from the trade in the Asian region. On the contrary, Karachalios (2021) suggests that the US gas companies are the ones that are going to have big gains in the long run from the LNG trade between the US and the EU.
2.2 The LPG Trade
Liquefied petroleum gas is a by-product of the oil refining and the natural gas processing. By these two processes there are three different light hydrocarbon gases that are being extracted namely: propane, butane, and isobutene (Bai and Lam 2019c). These gases are of prime importance in the energy sector primarily for cooking and heating and additionally as a petrochemical feedstock. There are studies that have looked into the LPG phenomenon as a natural resources, but the mainly focus on the transportation risks (Guersola et al. 2017), its handling and storage (Bariha et al. 2017) the shipping destination behaviour (Ådland et al. 2008; Bai and Lam 2019a) and finally the LPG global flows (Chen et al. 2018; Zhong et al. 2017). The bibliography, describes that LPG can act as a great diversification alternative both for energy security risks (Lesbirel 2004) and for the minimization of CO2 emissions too (Lin and Raza 2020).
2.3 The Geo-Political Aspects of the LNG and the LPG Trade
Regardless of the economic perspectives of the two trades, one should not ignore the security issues that arise when it comes to energy. Since the nineteenth century, when oil became the major energy resource for the global economy there have been many armed conflicts for natural resources. However, since the Second World War, armed conflicts have both minimized and downsized over time. Nevertheless, apart from armed conflicts per se, political tensions arise frequently for the matter of natural resources.
More prominent are the tensions that have recently arisen between the European Union and the Russian Federation. While the demand for natural gas is expected to increase in the EU until 2030 (Lise et al. 2008), the supply from the EU countries cannot match demand. This is why the EU is obliged to import natural gas from other countries. Up until now, the primary supplier of natural gas to the European Union has been the Russian Federation while further negotiations have been taking place with Azerbaijan, Kazakhstan, Turkmenistan, Iran, Iraq and Egypt (Bilgin 2009).
Nevertheless, while talks between the EU and the rest of countries have been progressing on the establishment of pipelines, the Russian Federation has been criticized for weaponizing its natural gas resources, through its prominent gas corporation, Gazprom, in political occasions (Goldman 2008), like the war with Ukraine in 2006 (Bilgin 2009). The supply cuts that occurred in 2006 during the Russia – Ukraine war were heavily discussed both in the media and academia (Finon and Locatelli 2008). More recently, the pipelines that run through the Balkan area (Kovacevic 2017) as well as potential disruptions that may occur in the gas supply in the whole Europe area have been heavily researched from both academics and practitioners (Deane et al. 2017; Prontera 2018).
Similar to the European Union, China has been facing relevant problems when it comes to its demand of natural gas. While China has been a net exporter of natural gas until 2006, after that period the demand of natural gas has increased substantially. Currently, China imports natural gas primarily from Turkmenistan and secondarily from Qatar, Australia. Malaysia, Uzbekistan Indonesia, Yemen and Myanmar (Dong and Kong 2016).
While with the rest of the countries China has established a non-interventional approach to its domestic policy, this is not the case for Myanmar. China has been openly supporting the political establishment of the country, while at the same time, India, another major importer of gas, has been opposing it. As a result, the pipeline between China and Myanmar is already operational while the pipeline between Indian and Myanmar is not (Liu et al. 2017). This gives a comparative advantage to China over India, when it comes to access to natural resources and thus a comparative cost advantage on its production (Kulkarni and Nathan 2016).
Finally, one should not forget the Mediterranean region when it comes to the gas supplies. Countries that have been having long-standing disputes, (e.g. Greece, Turkey, Cyprus, Egypt, and Israel) are lately trying to establish natural gas pipelines that will supply the European Union. Nevertheless, the latter discussions are prolonged due to different opinions on matters like sea borders, percentages of sales and power over the supply of gas. Thus, the construction and the function of these pipelines is still unclear (Winrow 2016). However, Oguz Dirioz et al. (2020) in their recent paper propose that a potential interconnectivity of the liquefied natural gas trade would improve significantly the energy security in the Balkan area.
In the current paper, we propose an alternative way that the gas trade can take place especially when geo-political risks arise. We suggest that particularly for countries that are net importers of LNG and LPG should have long term contracts of LPG and LNG transportation via ocean-going vessels in order to minimize the risk of exposure to energy shortage of supply.
3 Methodology and Dataset
To examine the relationship between geopolitical risk and vessel freight rates, we propose the use of a Vector Error Correction specification, as per the seminal work of Johansen and Juselius (1990), defined as:
where the total number of variables is K, Mj,t is the natural logarithm of variable j, and W t is a (K − 1 × N) matrix that contains all variables included in the estimation, other than variable j. Δ is the first difference operator, while. βi,i,j and γk,i,j refer to the own and other variable coefficient values in the estimations, with j again signifying that the coefficient refers to the equation identified with variable j, while k refers to the specific variable within matrix W t . εj,t refer to the error processes in each equation.
The long-run relationship between the two variables is found within the brackets of equation (1) with δ j determining the speed of adjustment to the long-run equilibrium. The long run, as per Johansen and Juselius (1990), refers to the equilibrium relationship between the variables, i.e. the one that exists in the absence of any external shocks to the system of equations in the estimation model. Similarly, short run refers to the fluctuations that take place and allow for deviations from the equilibrium value. As such, it should be noted that the terms “long run” and “short run” do not refer to any predetermined time period, but rather as an equilibrium relationship.
In this specification, Mj,t refers to the freight rates of three LPG routes (Gulf to Japan, Houston to Chiba, and Houston to Flushing) and denoted as LPG i , i = 1, …, 3 in the subsequent estimations. Similarly, we also employ and three LNG routes (Sabine Pass to Zeebrugge, Sabine Pass to Tianjin, and Gladstone to Tokyo), denoted as LNG i , i = 1, …, 3. The number of routes is limited by data availability. To avoid the over-parameterization of the VECM, we run each trade route individually on the same variables.
Matrix W t consists of K = 4 variables, and more specifically, the world Geopolitical Risk Index (GPR), the Henry Hub price of Natural Gas to account for any price spillover (Michail and Melas 2020a), the LNG (and LPG respectively) fleet as a proxy of supply pressures on the freight rate, and the stock market (Wilshire 5000 index) as a proxy of the global macroeconomic situation (Kamal et al. 2021; Michail and Melas 2020b). Data for the GPR were obtained from obtained by Caldara and Iacoviello (2018), freight rates for the routes from Clarksons Shipping Intelligence Network, and the Natural Gas and Wilshire 5000 data from the Federal Reserve of St. Luis database. The data are of monthly frequency and range from January 2018 to May 2021, constricted by the availability of freight rate data, with 41 observations per VECM. A detailed table of the variables included and the sources of data, as well as a table with descriptive statistics of the data and a correlation matrix can be found in the “Appendix” section.
With regards to the Geopolitical Risk Index, this was constructed by Caldara and Iacoviello (2018), who construct their measure of adverse geopolitical events based on a tally of newspaper articles covering geopolitical tensions, and examine its evolution and economic effects since 1900. The geopolitical risk (GPR) index spikes around the two world wars, at the beginning of the Korean War, during the Cuban Missile Crisis, and after 9/11. The authors calculate the index by counting the number of articles related to adverse geopolitical events in each newspaper for each month (as a share of the total number of news articles).[1]
With regards to the rationale behind the use of the VEC model, we note that Vector Autoregressive (VAR) models allow for the interplay between variables, meaning that one variable is allowed to have an impact on the other, versus the standard uni-directional view of causality in standard regressions. This was solved by the seminal work of Sims (1980), who posited that in order for a model to be realistic, one needs to account for the fact that variables which change following a shock, can feed that impact through to the others in a system of equations, allowing for a more realistic approach to econometric modelling. For example, it would not be realistic to observe an increase in price of natural gas freight rates, without this impact being transmitted to the rest of the economy (e.g. stock market), as the recent events (e.g. Ukraine war) have demonstrated.
Building on the above, the Vector Error Correction Model (VECM) extends the standard framework of the VAR by allowing for the presence of a co-integrating relationship between the variables. In effect, a co-integrating relationship suggests that two or more variables have a strong equilibrium relationship and, despite any potential short-term deviations caused by any such disturbances, things will revert to that relationship over a period of time (see Hendry and Juselius 2000, 2001). The presence of a co-integrating relationship suggests that the variables are well connected, and allows for a more detailed elaboration of their common paths. Other researchers in the field of maritime economics have extensively used a similar econometric setup (Michail and Melas 2019, 2021, 2022).
To empirically examine whether a cointegrating relationship exists between the set of variables employed in the estimation, we first need to have an empirical justification for the use of the term in the brackets. However, before we are able to perform the Johansen test for cointegration we first need to establish that both variables are I(1), i.e. they follow a unit root process (for more details see Hendry and Juselius 2000, 2001). Table 1 presents the results from such an estimation.
Unit Root Tests.
| ADF test | PP test | |||
|---|---|---|---|---|
| Levels | First differences | Levels | First differences | |
| LPG1 | −3.00b | −6.04c | −2.07 | −5.95c |
| LPG2 | −2.84a | −6.03c | −2.14 | −5.14c |
| LPG3 | −3.01a | −4.73c | −2.29 | −4.43c |
| LNG1 | −3.19b | −5.32c | −2.59 | −5.25c |
| LNG2 | −3.23b | −5.06c | −2.44 | −4.99c |
| LNG3 | −3.47b | −4.85c | −2.51 | −4.69c |
| Stock market | −0.21 | −5.72c | 0.81 | −5.80c |
| GPR | −3.46b | −7.02c | −3.47b | −14.69c |
| NatGas | −3.02b | −8.97c | −3.04a | −8.97c |
| LPG fleet | 1.58 | −5.64c | 1.55 | −5.78c |
| LNG fleet | −1.96 | −7.22c | −2.03 | −7.22c |
-
The critical values for both the ADF and the PP unit root tests are −3.61, 2.93, and 2.61 for the 1%c, 5%b, and 10%a level respectively.
In particular, in Table 1, we test for the presence of a unit root using both the Augmented Dickey–Fuller test (Dickey and Fuller 1979; MacKinnon 1996) and the Philips and Perron (1988) tests at the levels and the first differences. The main difference between the two tests is that the first uses a parametric approach based on the residuals while the second is nonparametric. In particular, the PP test is non-parametric and just needs the residuals to be stationary. However, the ADF requires the residuals to be independent and identically distributed, leading to problems when the series is autocorrelated, as this is the case with a series that is not very long, such as ours. Hence, while we present both test, we focus mainly on the PP test results. The results suggest that there is evidence of a unit root in all the tested variables given that neither test rejects the unit root hypothesis. The fact that the series are I(1) is confirmed in the lower panel of Table 1 as the null of a unit root is rejected in the first differences of the variables. As such, given that both variables follow a unit root process, we can proceed with testing for a cointegrating relationship.
Using the Johansen (1991) method, we test for the presence of a cointegrating relationship in a vector autoregressive setup. The rank of the error-correction matrix δ is found to be one in most cases, in both the maximum eigenvalue and the trace tests, hence confirming the existence of one co-integrating relationship. Table 2 presents the cointegration results, where LNG i and LPG i denote the respective model. As per Hendry and Juselius (2000, 2001, in the case where two cointegrating equations were found, we examined for their economic importance. In all cases, the trends of both cointegrating equations were similar and hence one was discarded.
Cointegration tests.
| Trace test | Max eigenvalue test | |||
|---|---|---|---|---|
| K = 1 | K = 2 | K = 1 | K = 2 | |
| LPG1 | 92.56a | 50.83a | 41.72a | 27.21 |
| LPG2 | 88.53a | 45.63 | 42.90a | 23.48 |
| LPG3 | 59.21a | 25.91 | 33.29a | 14.94 |
| LNG1 | 79.38a | 38.31 | 34.21a | 23.85 |
| LNG2 | 69.89a | 44.87 | 24.10 | 19.35 |
| LNG3 | 70.21a | 43.79 | 34.92a | 17.86 |
-
The 5% critical values for the trace test are 69.82 and 47.85 for the first and second cointegrating vectors, and 33.87 and 27.58 for the respective vectors in the max eigenvalue test. aSignificance at the 5% level.
Following the Granger representation theorem (Engle and Granger 1987), if two variables are cointegrated, then at least one variable should Granger-cause the other. As such, the use of a VEC model is justified by the data generating processes and we proceed with a estimating such a model, using one lag as per the AIC and BIC information criteria. The following section presents the results from the estimation.
4 Estimation Results
Figure 2 starts with the responses of LNG freight rates after a shock in the W t variables, namely fleet, GPR, LNG price, and the Stock Market. Each row in the table represents a specific route, denoted by LNG i , as discussed in the previous section. The shaded areas represent a 90% confidence interval.
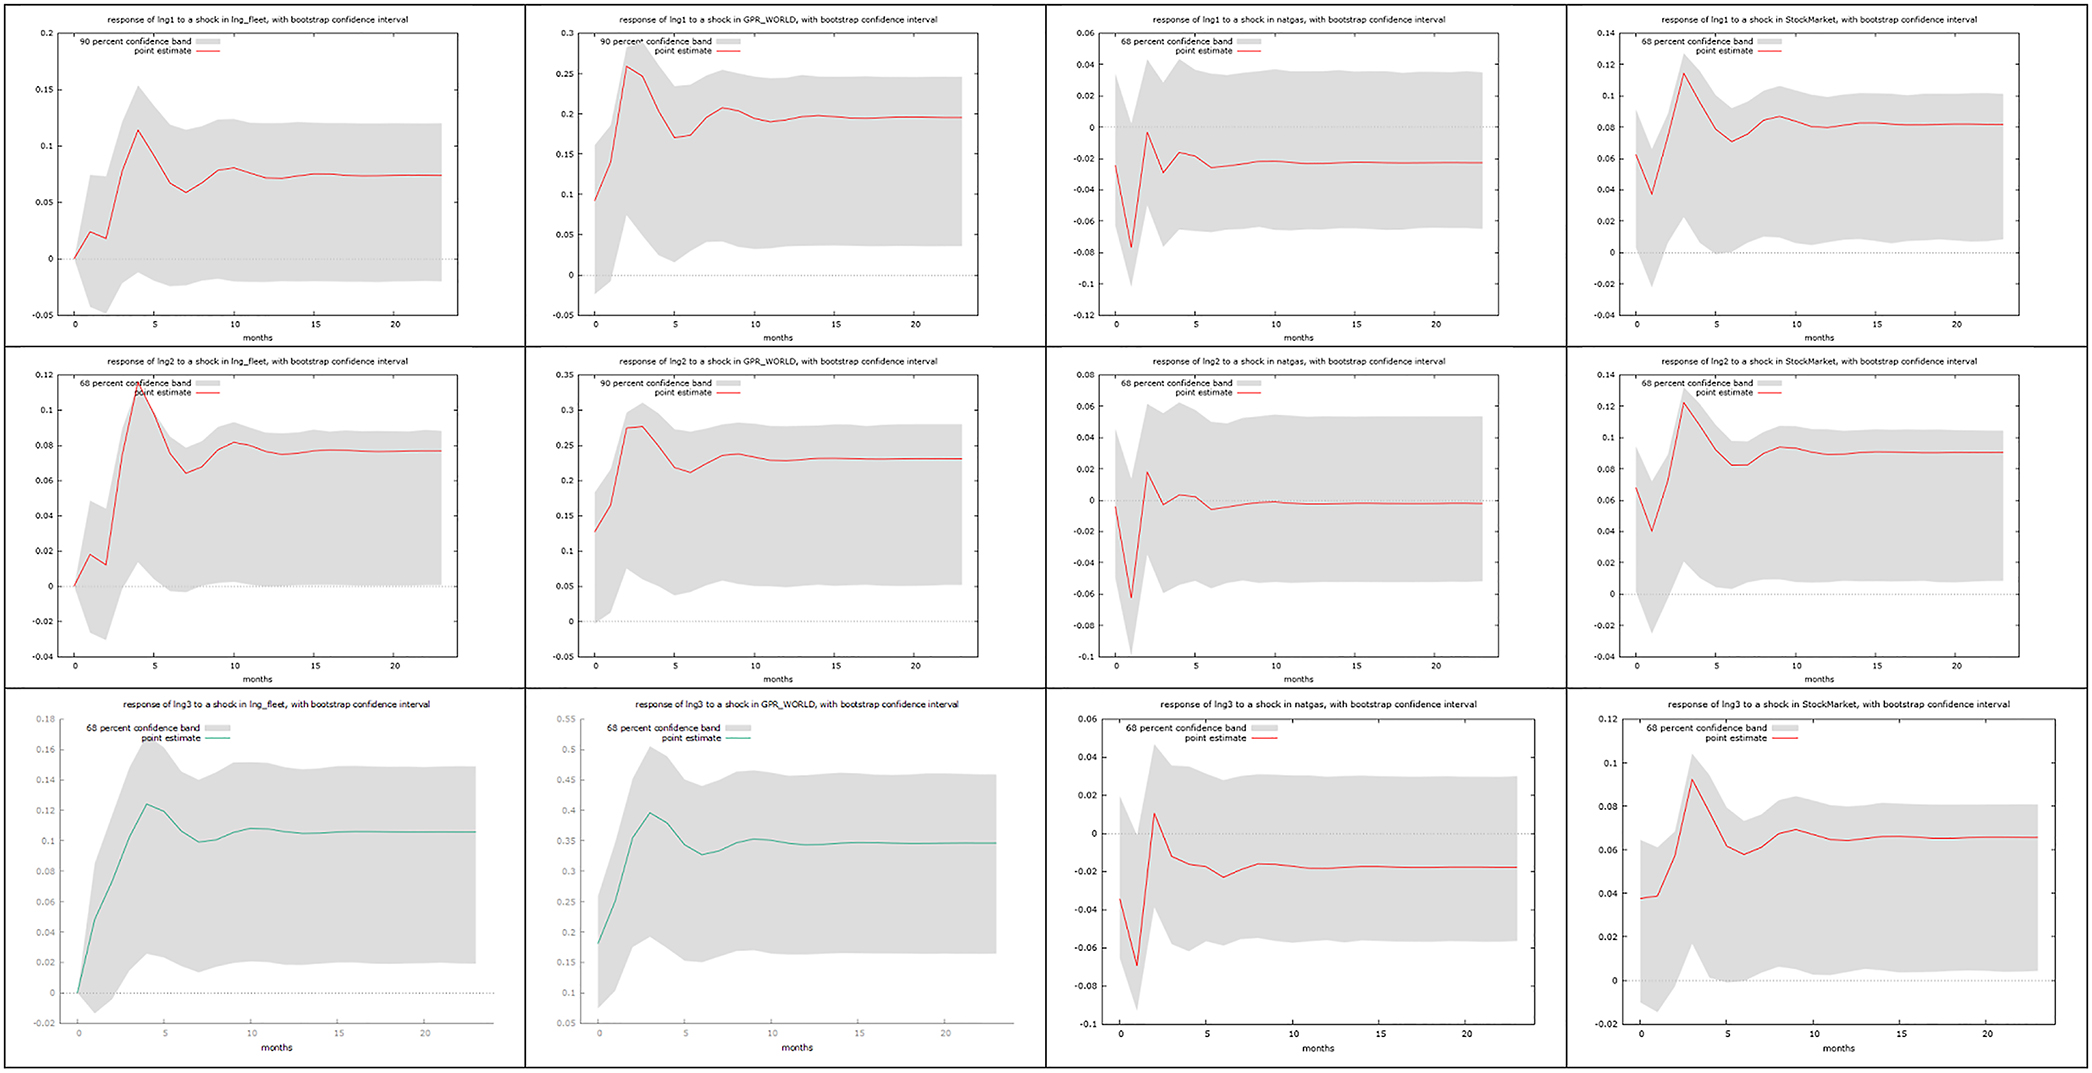
LNG estimates. The figures present the response of the first variable (e.g. LNG1) to a shock in the second variable (e.g. GPR) in a VECM setup with 1 lag, as per the information criteria. Dashed lines are the 68% confidence intervals.
The first row of Figure 2 shows that freight rates for the Sabine Pass to Zeebrugge (i.e. Gulf of Mexico to Europe) route are not dependent on either the developments in the LNG fleet or the price of natural gas. On the other hand, we see that a 1% increase the world GPR would lead to a 0.2% increase in freight rates, underlining the importance of geopolitical risk when it comes to trade routes. Similar to previous researchers (Kamal et al. 2021; Melas and Michail 2021), we also find that the global macroeconomic environment, as proxied by the stock market, also plays a significant role, with a 1% increase in the market leading to a 0.1% increase in the freight rates for the route.
In the second row and the Sabine Pass to Tianjin (i.e. Gulf of Mexico to China) route, we still find freight rates not to react to a shock in prices and the LNG fleet. Again, we find that GPR is significant, with a stronger impact as well, as an increase in geopolitical risk would lead to a 0.25% increase in freight rates. On the other hand, the reaction to the stock market remains roughly the same, with a 0.1% increase to a 1% positive shock. The Gladstone to Tokyo (i.e. Australia to Japan) route in row 3 shows a more intense reaction than the first two, with GPR and the stock market having a 0.35% and a 0.06% reaction respectively. This finding is in line with Michail and Melas (2022), who show that the longer the route, the larger the impact from a macroeconomic shock.
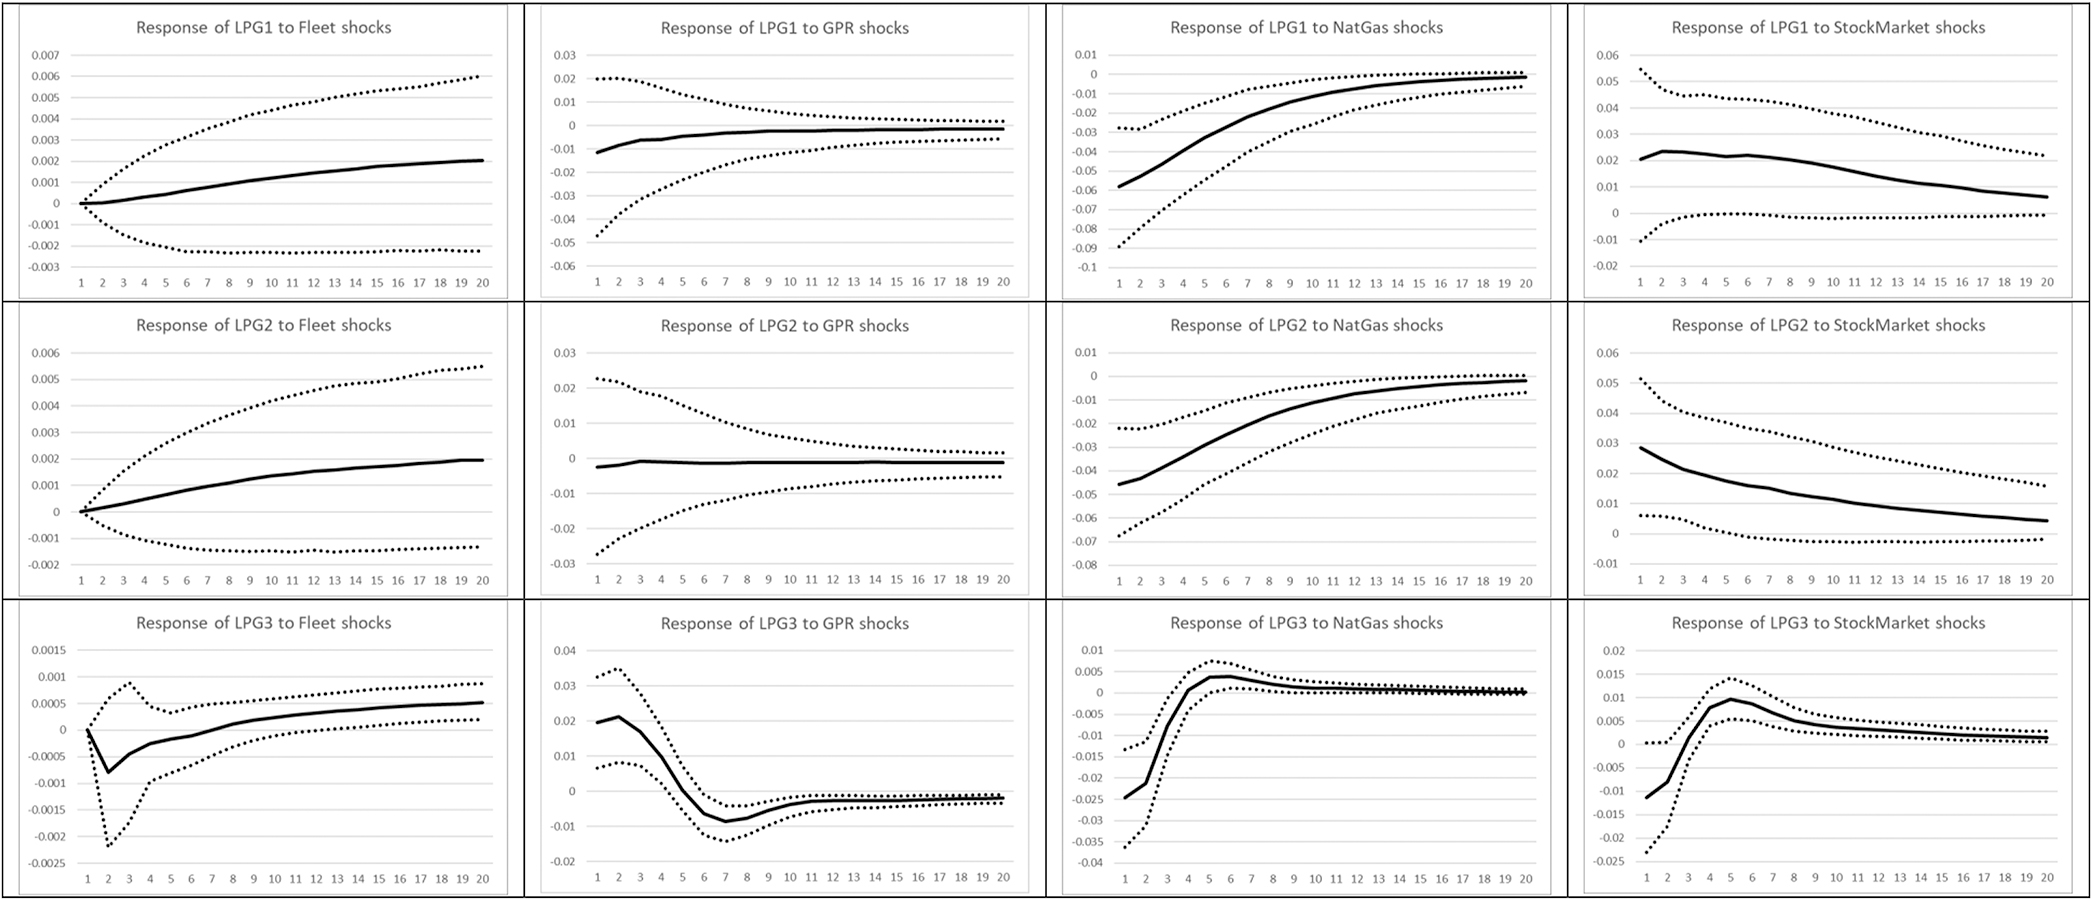
Moving to Figure 3, we see that the LPG routes are more sensitive to changes in the LPG fleet, at least for the first two routes (Gulf to Japan and Houston to Chiba), where a 1% increase in the fleet would cause an a 0.05% decrease in the freight rates. On the other hand, the first two rows report a lower sensitivity to geopolitical risk, with the impact standing at 0.12–0.08% respectively. Similar to the LNG findings, the LNG price does not appear to have any impact on freight rates. Finally, the stock market has the expected positive impact, with the effect standing at 0.12 and 0.09% respectively.
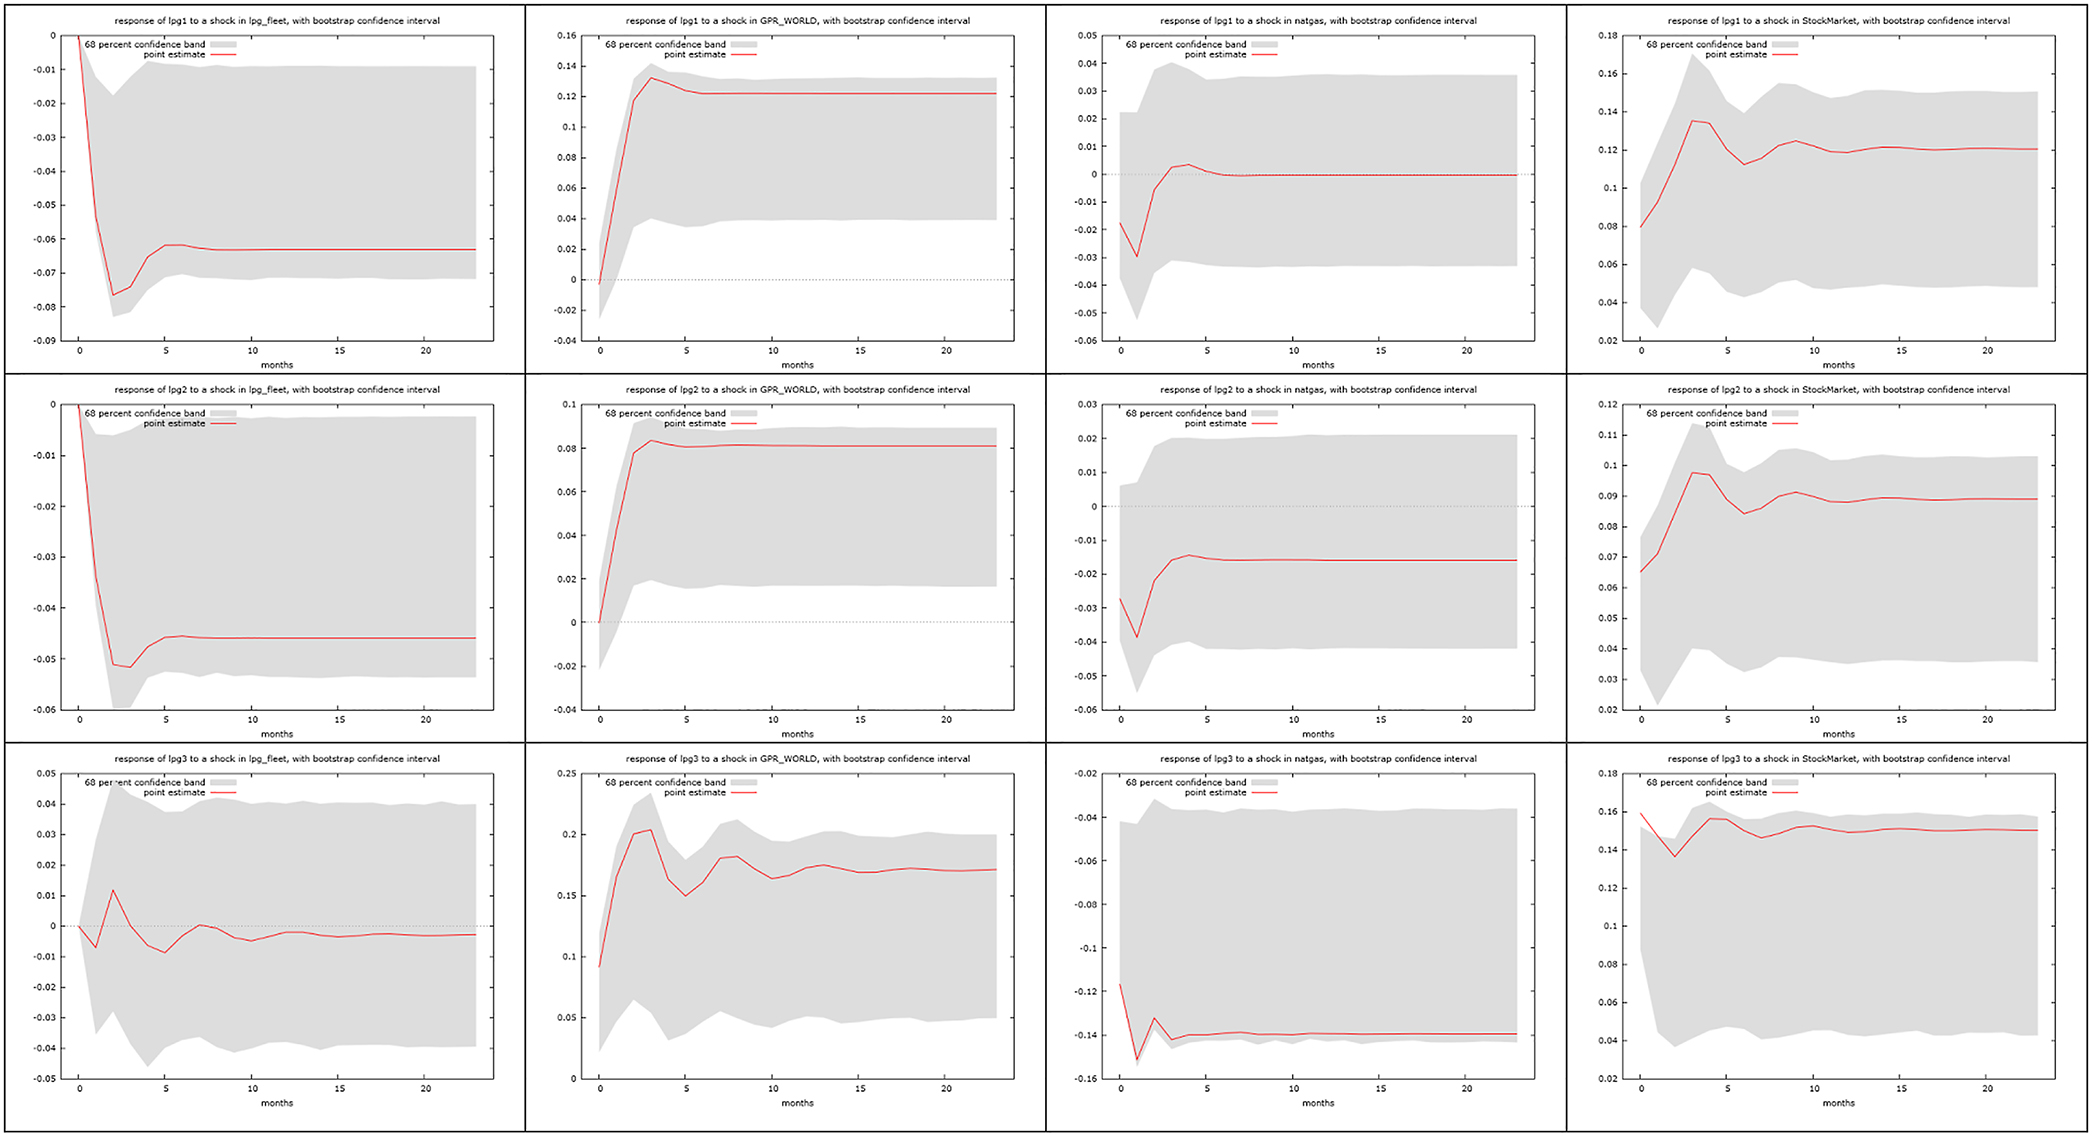
LPG estimates. The figures present the response of the first variable (e.g. LNG1) to a shock in the second variable (e.g. GPR) in a VECM setup with 1 lag, as per the information criteria. Dashed lines are the 68% confidence intervals.
In the final row of Figure 3 (Houston to Flushing), freight rates do not appear to be affected by the LPG fleet, but the price of LNG has a strong negative impact on them, suggesting a complementarity effect between the two gases. Unlike the previous two routes, this one is more sensitive to changes in the GPR, with the impact from a shock being in excess of 0.15%. A similar-sized impact is found for a stock market shock, in which case the LPG freight rate is expected to increase by 0.15%.
As the results suggest, geopolitical risk has a strong impact on freight rates, with the effect reaching its maximum around three months after the shock. Naturally, the GPR shock needs to be of a relatively permanent basis for the freight rate to reflect it; in the case of short-term tensions, any change will most likely be attributed to noise. The lag that freight rates require before they incorporate new information is a mechanism that has also been explored by Michail and Melas (2022), where the authors suggest that a time lag exists between a shock in freight rates and the shipbuilders’ action to build more vessels.
Also, important is the fact that the stock market has a strong impact on freight rates, suggesting that the macroeconomic environment is well correlated with the state of the shipping industry. Naturally, the relationship between energy and GDP growth is known, and given that stock markets tend to lead GDP developments, the impact does not come as a surprise. Still, a perhaps contradictory result could occur in the case where we observe an increase in the stock market complemented by a decline in geopolitical risk. In such a scenario, while freight rates would decline as risk drops, they would also be affected by higher demand, implying that they could possibly remain stable. This would not be a lack of reaction though, but of two opposing forces having a similar impact, naturally depending on the size of each change.
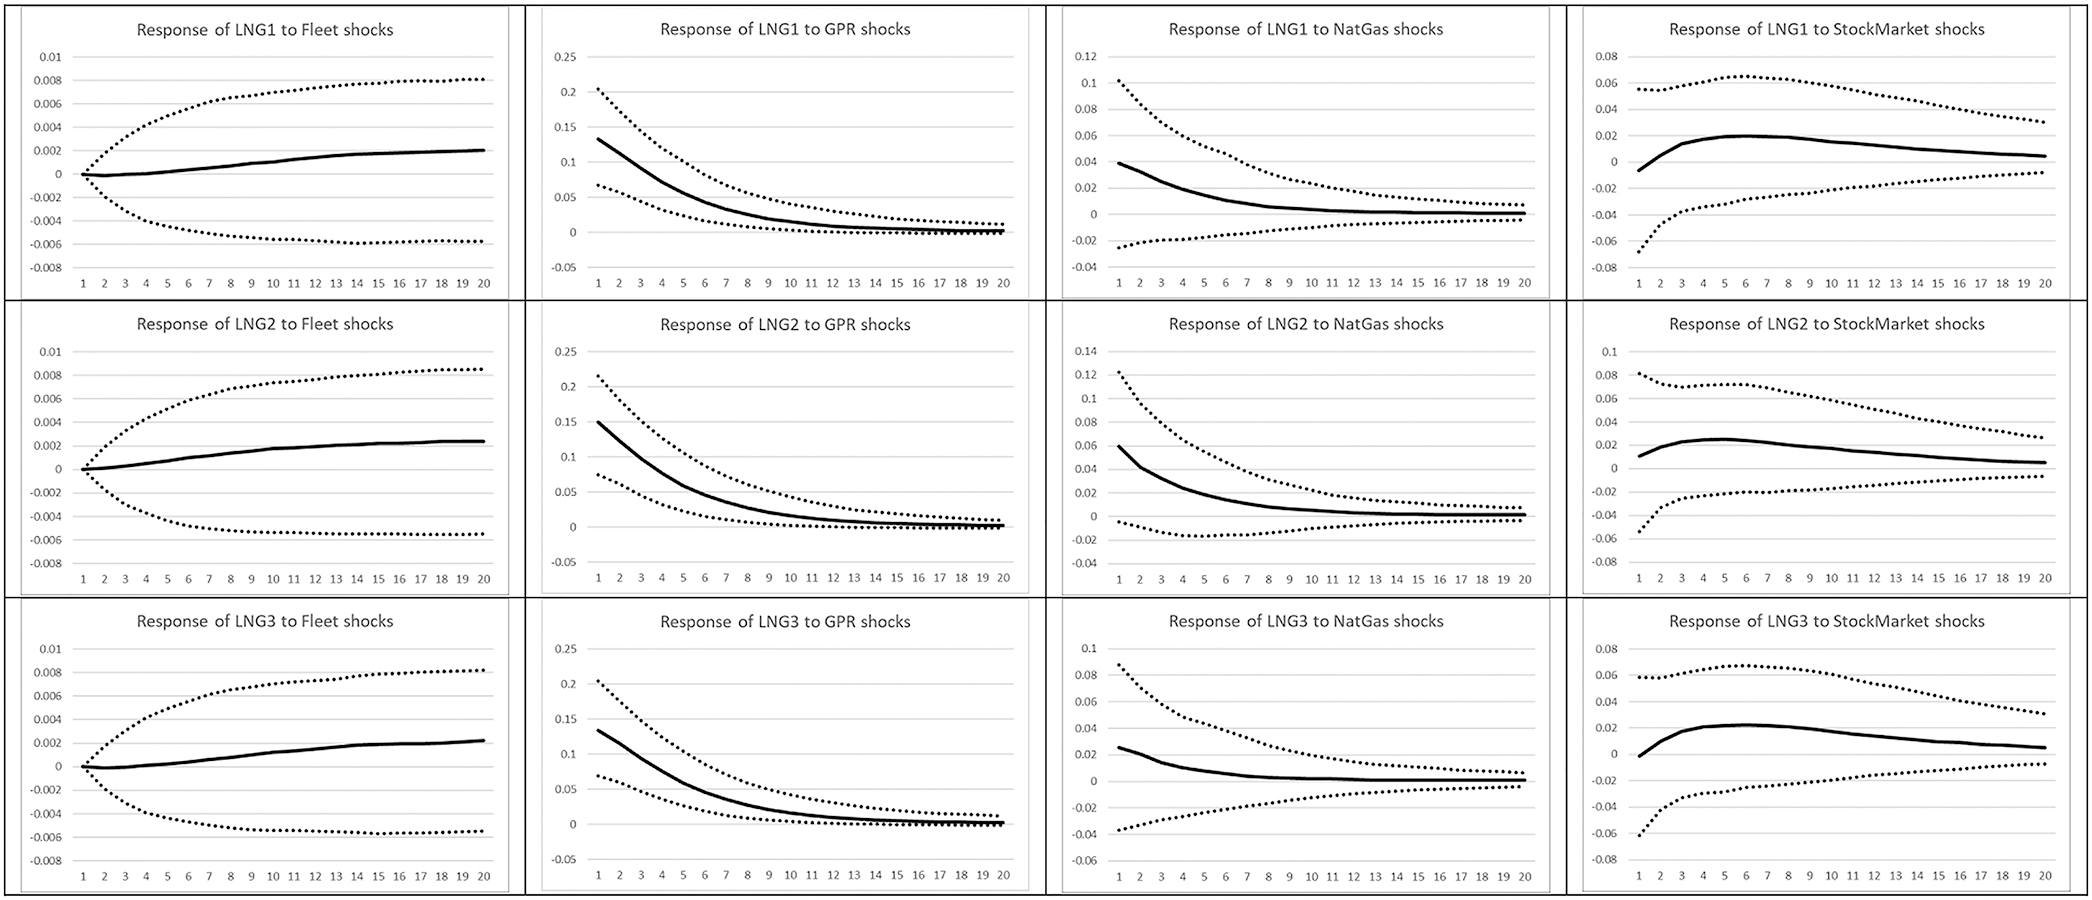
BVAR LNG estimates. The figures present the response of the first variable (e.g. LNG1) to a shock in the second variable (e.g. GPR) in a BVAR setup with 1 lag, as per the information criteria. Dashed lines are the 68% confidence intervals.
BVAR LPG estimates. The figures present the response of the first variable (e.g. LPG1) to a shock in the second variable (e.g. GPR) in a BVAR setup with 1 lag, as per the information criteria. Dashed lines are the 68% confidence intervals.
5 Robustness Checks
Given the small sample available for our estimation, we also proceed with a robustness check in order to further solidify the validity of our results. In particular, we employ a Bayesian Vector Auto Regression (BVAR) model, which allows us to overcome the small sample issues, given the use of a prior distribution. While we will not delve into the technical details here, the interested reader may refer to Dieppe et al. (2016), while Michail and Melas (2020a), offer a detailed overview with an empirical application to shipping demand. Figures 4 and 5 present the impulse responses from the BVAR setup.
As the two figures suggest, the conclusions reached from the VECM estimates still hold. However, we note that there appears to be no long-run impact in the BVAR estimates. This occurs because, in the BVAR setup, there is no particular equation that explicitly affects the behaviour of the model in an equilibrium setup. Hence, in the absence of the co-integrating equation, there is nothing to enforce the model to maintain the impact over time. This, naturally, does not suggest that the impact from a GPR shock is zero, but it suggests that overall model dynamics result in a different long-run picture. It should be noted here that in a well-behaved, non-explosive model, the responses should move to zero (or very close to it) over time.
In more detail, the LNG route freight rates react positively to a shock that increases geopolitical risk, with the responses standing around 0.15. At the same time, their response to stock market shocks remains close to zero, while insignificant responses are also registered for the natural gas price and the fleet. With regards to LPG routes, perhaps the most interesting response is that freight rates respond negatively to natural gas prices, most likely given a substitution effect between the two. At the same time, LPG freight rates register a route-specific response to geopolitical risk shocks. In general, the results from the BVAR estimation support the conclusions reached in the previous section and offer a clearer view of the relationship between them.
6 Conclusions
In this paper, we have explored the relationship between Liquified Natural Gas (LNG) and Liquified Petroleum Gas (LPG) vessel freight rates and global geopolitical risk. Our results show that a shock in geopolitical risk increases the cost of the spot charter rates both for the LNG and the LPG carriers.
Our results bear significant implications for both the companies and the countries involved in the liquefied gas trade, since this energy trade is rising fast due to the global environmental crisis. Given the fact that the use of gas (either in LNG or LPG form) is likely to continue substituting the more pervasive natural resources like oil and coal, all participants, including the energy suppliers, the countries, and the market players involved, need to acknowledge in depth the market dynamics. Apart from the purely financial and trading perspectives, which are directly evident, natural resources are also highly correlated with economic development and energy security in the importing countries. Therefore, any risks that arise and that may potentially disrupt the flow of natural resources create a downward spiral of recession given the high increase of prices.
As a potential caveat, we note that our study has focused primarily in six ocean trade routes for the gas trade. Further research could potentially focus on additional ocean routes, with potentially more available data, and additionally provide a comparison between them and the pipeline trade. The latter would benefit the literature since it could give valuable insights on the optimization of trade, especially in turbulent times.
Appendix: Description of data
| Variable | Description | Source | Units of measurement |
|---|---|---|---|
| FLEET | LNG (and LPG respectively) fleet | Clarksons Shipping Intelligence Network | Number of Vessels |
| GPR | World Geopolitical Risk Index | Caldara and Iacoviello | Index |
| NATGAS | Henry Hub price | Federal Reserve of St. Louis Database (FRED) | US Dollars |
| STOCK | Stock Market | Federal Reserve of St. Louis Database (FRED) | Wilshire 5000 index |
| LNG1 | Sabine Pass to Zeebrugge route | Clarksons Shipping Intelligence Network | US Dollars per day |
| LNG2 | Sabine Pass to Tianjin route | Clarksons Shipping Intelligence Network | US Dollars per day |
| LNG3 | Gladstone to Tokyo route | Clarksons Shipping Intelligence Network | US Dollars per day |
| LPG1 | Gulf to Japan route | Clarksons Shipping Intelligence Network | US Dollars per day |
| LPG2 | Houston to Chiba route | Clarksons Shipping Intelligence Network | US Dollars per day |
| LPG3 | Houston to Flushing route | Clarksons Shipping Intelligence Network | US Dollars per day |
Descriptive statistics
| FLEET | GPR | NATGAS | STOCK | LNG1 | LNG2 | LNG3 | LPG1 | LPG2 | LPG3 | |
|---|---|---|---|---|---|---|---|---|---|---|
| Mean | 0.68 | −1.39 | −0.71 | 1.18 | −1.44 | −0.24 | −0.71 | 1.68 | 1.02 | 16.36 |
| Median | 0.63 | −5.68 | −0.07 | 2.28 | 6.12 | 3.17 | 1.16 | 1.71 | 1.30 | 2.22 |
| Max | 2.04 | 114.1 | 67.99 | 7.02 | 148.4 | 159.0 | 133.1 | 52.29 | 32.49 | 414.0 |
| Min | −0.24 | −110.7 | −71.53 | −22.25 | −145.8 | −126.1 | −149.2 | −88.83 | −68.30 | −73.29 |
| Std. Dev. | 0.51 | 37.77 | 20.07 | 4.87 | 51.70 | 52.79 | 50.49 | 26.20 | 19.53 | 88.15 |
| Skewness | 0.73 | 0.36 | −0.19 | −2.87 | −0.09 | 0.15 | −0.26 | −0.81 | −1.04 | 4.00 |
| Kurtosis | 3.84 | 5.14 | 8.27 | 14.49 | 4.41 | 4.08 | 4.07 | 5.23 | 5.59 | 18.86 |
| Jarque–Bera | 4.77(0.09) | 8.52(0.01) | 46.57(0.00) | 275.1(0.00) | 3.37(0.19) | 2.07(0.35) | 2.38(0.30) | 12.66(0.00) | 18.46(0.00) | 315.5(0.00) |
| Observations | 40 | 40 | 40 | 40 | 40 | 40 | 40 | 40 | 40 | 24 |
Correlation matrix
| FLEET | GPR | NATGAS | STOCK | LNG1 | LNG2 | LNG3 | LPG1 | LPG2 | LPG3 | |
|---|---|---|---|---|---|---|---|---|---|---|
| FLEET | 1 | 0.177 | 0.285 | −0.084 | −0.168 | −0.145 | −0.171 | −0.322 | −0.324 | 0.064 |
| GPR | 1 | −0.196 | 0.262 | 0.137 | 0.174 | 0.167 | 0.024 | 0.080 | 0.098 | |
| NATGAS | 1 | 0.205 | −0.069 | 0.002 | −0.092 | −0.159 | −0.141 | −0.124 | ||
| STOCK | 1 | 0.079 | 0.181 | 0.108 | 0.150 | 0.222 | 0.036 | |||
| LNG1 | 1 | 0.976 | 0.968 | 0.760 | 0.793 | 0.303 | ||||
| LNG2 | 1 | 0.947 | 0.762 | 0.817 | 0.313 | |||||
| LNG3 | 1 | 0.780 | 0.804 | 0.278 | ||||||
| LPG1 | 1 | 0.978 | 0.427 | |||||||
| LPG2 | 1 | 0.438 | ||||||||
| LPG3 | 1 |
References
Ådland, R. O., H. Jia, and J. Lu. 2008. “Price Dynamics in the Market for Liquid Petroleum Gas Transport.” Energy Economics 30 (3): 818–28.10.1016/j.eneco.2007.02.008Search in Google Scholar
Al-Yafei, H., S. Aseel, M. Kucukvar, N. C. Onat, A. Al-Sulaiti, and A. Al-Hajri. 2021. “A Systematic Review for Sustainability of Global Liquified Natural Gas Industry: A 10-Year Update.” Energy Strategy Reviews 38, https://doi.org/10.1016/j.esr.2021.100768.Search in Google Scholar
Ang, B. W., W. L. Choong, and T. S. Ng. 2015. “Energy Security: Definitions, Dimensions and Indexes.” Renewable and Sustainable Energy Reviews 42: 1077–93, doi:https://doi.org/10.1016/j.rser.2014.10.064.Search in Google Scholar
Angelis-Dimakis, A., G. Arampatzis, and D. Assimacopoulos. 2012. “Monitoring the Sustainability of the Greek Energy System.” Energy for Sustainable Development 16 (1): 51–6, https://doi.org/10.1016/j.esd.2011.10.003.Search in Google Scholar
Angelopoulos, J., S. Sahoo, and I. D. Visvikis. 2020. “Commodity and Transportation Economic Market Interactions Revisited: New Evidence from a Dynamic Factor Model.” Transportation Research Part E: Logistics and Transportation Review 133: 101836, https://doi.org/10.1016/j.tre.2019.101836.Search in Google Scholar
Bai, X., and J. S. L. Lam. 2019a. “A Destination Choice Model for Very Large Gas Carriers (VLGC) Loading from the US Gulf.” Energy 174: 1267–75, https://doi.org/10.1016/j.energy.2019.02.148.Search in Google Scholar
Bai, X., and J. S. L. Lam. 2019b. “An Integrated Analysis of Interrelationships Within the Very Large Gas Carrier (VLGC) Shipping Market.” Maritime Economics and Logistics 21 (3): 372–89, https://doi.org/10.1057/s41278-017-0087-3.Search in Google Scholar
Bai, X., and J. S. L. Lam. 2019c. “A Copula-GARCH Approach for Analyzing Dynamic Conditional Dependency Structure Between Liquefied Petroleum Gas Freight Rate, Product Price Arbitrage and Crude Oil Price.” Energy Economics 78: 412–27, https://doi.org/10.1016/j.eneco.2018.10.032.Search in Google Scholar
Baker, S. R., N. Bloom, and S. J. Davis. 2016. “Measuring Economic Policy Uncertainty.” The Quarterly Journal of Economics 131 (4): 1593–636, https://doi.org/10.1093/qje/qjw024.Search in Google Scholar
Bariha, N., V. C. Srivastava, and I. M. Mishra. 2017. “Theoretical and Experimental Studies on Hazard Analysis of LPG/LNG Release: A Review.” Reviews in Chemical Engineering 33 (4): 387–432, https://doi.org/10.1515/revce-2016-0006.Search in Google Scholar
Bilgin, M. 2009. “Geopolitics of European Natural Gas Demand: Supplies from Russia, Caspian and the Middle East.” Energy Policy 37 (11): 4482–92, https://doi.org/10.1016/j.enpol.2009.05.070.Search in Google Scholar
Brogaard, J., and A. Detzel. 2015. “The Asset-Pricing Implications of Government Economic Policy Uncertainty.” Management Science 61 (1): 3–18, https://doi.org/10.1287/mnsc.2014.2044.Search in Google Scholar
Caldara, D., and M. Iacoviello. 2018. “Measuring Geopolitical Risk.” International Finance Discussion Paper 2018 (1222): 1–66, https://doi.org/10.17016/ifdp.2018.1222.Search in Google Scholar
Chen, B., J. S. Li, X. F. Wu, M. Y. Han, L. Zeng, Z. Li, and G. Q. Chen. 2018. “Global Energy Flows Embodied in International Trade: A Combination of Environmentally Extended Input–Output Analysis and Complex Network Analysis.” Applied Energy 210: 98–107, https://doi.org/10.1016/j.apenergy.2017.10.113.Search in Google Scholar
Chuang, M. C., and H. W. Ma. 2013. “An Assessment of Taiwan’s Energy Policy Using Multi-Dimensional Energy Security Indicators.” Renewable and Sustainable Energy Reviews 17: 301–11, doi:https://doi.org/10.1016/j.rser.2012.09.034.Search in Google Scholar
Deane, J. P., M. Ó Ciaráin, and B. P. Ó Gallachóir. 2017. “An Integrated Gas and Electricity Model of the EU Energy System to Examine Supply Interruptions.” Applied Energy 193: 479–90, https://doi.org/10.1016/j.apenergy.2017.02.039.Search in Google Scholar
Dickey, D. A., and W. A. Fuller. 1979. “Distribution of the Estimators for Autoregressive Time Series with a Unit Root.” Journal of the American Statistical Association 74 (366): 427, https://doi.org/10.2307/2286348.Search in Google Scholar
Dieppe, A., R. Legrand, and B. van 2016. The BEAR Toolbox (Working Paper 1934). Frankfurt, Germany: European Central Bank.10.2139/ssrn.2811020Search in Google Scholar
Dong, X., and Z. Kong. 2016. “The Impact of China’s Natural Gas Import Risks on the National Economy.” Journal of Natural Gas Science and Engineering 36: 97–107, https://doi.org/10.1016/j.jngse.2016.10.028.Search in Google Scholar
Ediger, V. Ş., and I. Berk. 2011. “Crude Oil Import Policy of Turkey: Historical Analysis of Determinants and Implications since 1968.” Energy Policy 39 (4): 2132–42, https://doi.org/10.1016/j.enpol.2011.01.058.Search in Google Scholar
Engle, R. F., and C. W. J. Granger. 1987. “Co-Integration and Error Correction: Representation, Estimation, and Testing.” Econometrica 55 (2): 251, https://doi.org/10.2307/1913236.Search in Google Scholar
Finon, D., and C. Locatelli. 2008. “Russian and European Gas Interdependence: Could Contractual Trade Channel Geopolitics?” Energy Policy 36 (1): 423–42, https://doi.org/10.1016/j.enpol.2007.08.038.Search in Google Scholar
Geng, J. B., Q. Ji, and Y. Fan. 2014. “A Dynamic Analysis on Global Natural Gas Trade Network.” Applied Energy 132: 23–33, https://doi.org/10.1016/j.apenergy.2014.06.064.Search in Google Scholar
Girardi, O. N. 2021. Fundamentals and Elasticities of Demand in the Domestic Wholesale Natural Gas Market, East Coast of Australia. Queensland: The University of Queensland.Search in Google Scholar
Goldman, M. I. 2008. Petrostate: Putin, Power and the New Russia, 1st ed. Oxford: Oxford University Press.Search in Google Scholar
Goodarzi, S., H. N. Perera, and D. Bunn. 2019. “The Impact of Renewable Energy Forecast Errors on Imbalance Volumes and Electricity Spot Prices.” Energy Policy 134: 110827, https://doi.org/10.1016/j.enpol.2019.06.035.Search in Google Scholar
Guersola, M., M. T. Arns Steiner, and C. T. Scarpin. 2017. “A Methodology for Minimizing LPG Transportation Impact.” Management of Environmental Quality: An International Journal 28 (6): 807–20, https://doi.org/10.1108/meq-07-2016-0050.Search in Google Scholar
Hendry, D. F., and K. Juselius. 2000. “Explaining Cointegration Analysis: Part I.” The Energy Journal 21 (1): 1–42, https://doi.org/10.5547/issn0195-6574-ej-vol21-no1-1.Search in Google Scholar
Hendry, D. F., and K. Juselius. 2001. “Explaining Cointegration Analysis: Part II.” The Energy Journal 21 (1): 75–120, doi:https://doi.org/10.2307/41322908.Search in Google Scholar
Jensen, J. T., Oxford Institute for Energy Studies. 2004. The Development of a Global LNG Market: Is it Likely? If So, When. Oxford, UK: Oxford Institute for Energy Studies.Search in Google Scholar
Jewell, J., A. Cherp, and K. Riahi. 2014. “Energy Security Under De-carbonization Scenarios: An Assessment Framework and Evaluation Under Different Technology and Policy Choices.” Energy Policy 65: 743–60, https://doi.org/10.1016/j.enpol.2013.10.051.Search in Google Scholar
Johansen, S. 1991. “Estimation and Hypothesis Testing of Cointegration Vectors in Gaussian Vector Autoregressive Models.” Econometrica 59 (6): 1551–80, https://doi.org/10.2307/2938278.Search in Google Scholar
Johansen, S., and K. Juselius. 1990. “Maximum Likelihood Estimation and Inference on Cointegration—With Applications to the Demand for Money.” Oxford Bulletin of Economics and Statistics 52 (2): 169–210.10.1111/j.1468-0084.1990.mp52002003.xSearch in Google Scholar
Kamal, M. R., M. A. F. Chowdhury, and M. M. Hosain. 2021. Stock Market Reactions of Maritime Shipping Industry in the Time of COVID-19 Pandemic Crisis: An Empirical Investigation. Maritime Policy and Management.10.1080/03088839.2021.1954255Search in Google Scholar
Karachalios, I. 2021. Geopolitical and Financial Analysis of the Rising LNG Industry and Gas Market Trends. Athens: University of Piraeus.Search in Google Scholar
Kovacevic, A. 2017. Towards a Balkan Gas Hub: The Interplay Between Pipeline Gas, LNG and Renewable Energy in South East Europe. Oxford: Oxford Institute for Energy Studies.10.26889/9781784670757Search in Google Scholar
Kulkarni, S. S., and H. S. K. Nathan. 2016. “The Elephant and the Tiger: Energy Security, Geopolitics, and National Strategy in China and India’s Cross Border Gas Pipelines.” Energy Research and Social Science 11: 183–94, https://doi.org/10.1016/j.erss.2015.09.010.Search in Google Scholar
Lesbirel, S. H. 2004. “Diversification and Energy Security Risks: The Japanese Case.” Japanese Journal of Political Science 5 (1): 1–22, https://doi.org/10.1017/s146810990400129x.Search in Google Scholar
Li, F., Z. Huang, J. Zhong, and K. Albitar. 2020. “Do Tense Geopolitical Factors Drive Crude Oil Prices?” Energies 13 (6), https://doi.org/10.3390/en13164277.Search in Google Scholar
Lin, B., I. Ankrah, and S. A. Manu. 2017. “Brazilian Energy Efficiency and Energy Substitution: A Road to Cleaner National Energy System.” Journal of Cleaner Production 162: 1275–84, https://doi.org/10.1016/j.jclepro.2017.06.011.Search in Google Scholar
Lin, B., and M. Y. Raza. 2020. “Analysis of Energy Security Indicators and CO2 Emissions. A Case from a Developing Economy.” Energy 200.10.1016/j.energy.2020.117575Search in Google Scholar
Lin, N., and R. E. Brooks. 2021. “Global Liquified Natural Gas Trade Under Energy Transition.” Energies 2021 14 (20): 6617. https://doi.org/10.3390/en14206617.Search in Google Scholar
Lise, W., B. F. Hobbs, and F. van Oostvoorn. 2008. “Natural Gas Corridors Between the EU and its Main Suppliers: Simulation Results with the Dynamic GASTALE Model.” Energy Policy 36 (6): 1890–906, https://doi.org/10.1016/j.enpol.2008.01.042.Search in Google Scholar
Liu, D., K. Yamaguchi, and H. Yoshikawa. 2017. “Understanding the Motivations behind the Myanmar-China Energy Pipeline: Multiple Streams and Energy Politics in China.” Energy Policy 107: 403–12, https://doi.org/10.1016/j.enpol.2017.05.005.Search in Google Scholar
Mackinnon, J. G. 1996. “Numerical Distribution Functions for Unit Root and Cointegration Tests.” Journal of Applied Econometrics 11 (6): 601–18, https://doi.org/10.1002/(sici)1099-1255(199611)11:6<601::aid-jae417>3.0.co;2-t.10.1002/(SICI)1099-1255(199611)11:6<601::AID-JAE417>3.0.CO;2-TSearch in Google Scholar
Maxwell, D., and Z. Zhu. 2011. “Natural Gas Prices, LNG Transport Costs, and the Dynamics of LNG Imports.” Energy Economics 33 (2): 217–26, https://doi.org/10.1016/j.eneco.2010.06.012.Search in Google Scholar
Melas, K. D., and N. A. Michail. 2021. “The Relationship Between Commodity Prices and Freight Rates in the Dry Bulk Shipping Segment: A Threshold Regression Approach.” Maritime Transport Research 2: 100025, https://doi.org/10.1016/j.martra.2021.100025.Search in Google Scholar
Michail, N. A., and K. D. Melas. 2019. “A Cointegrating Stock Trading Strategy: Application to Listed Tanker Shipping Companies.” Journal of Shipping and Trade 4 (1): 9, https://doi.org/10.1186/s41072-019-0049-2.Search in Google Scholar
Michail, N. A., and K. D. Melas. 2020a. “Quantifying the Relationship Between Seaborne Trade and Shipping Freight Rates: A Bayesian Vector Autoregressive Approach.” Maritime Transport Research 1: 100001, https://doi.org/10.1016/j.martra.2020.100001.Search in Google Scholar
Michail, N. A., and K. D. Melas. 2020b. “Shipping Markets in Turmoil: An Analysis of the Covid-19 Outbreak and its Implications.” Transportation Research Interdisciplinary Perspectives 7 (7): 100178, https://doi.org/10.1016/j.trip.2020.100178.Search in Google Scholar
Michail, N. A., and K. D. Melas. 2021. “Can Commodity Prices Affect the Stock Market Returns of Dry Bulk Shipping Companies?” SSRN Electronic Journal, https://doi.org/10.2139/ssrn.3960098.Search in Google Scholar
Michail, N. A., and K. D. Melas. 2022. “Covid-19 and the Energy Trade: Evidence from Tanker Trade Routes.” The Asian Journal of Shipping and Logistics 38 (2): 51–60.10.1016/j.ajsl.2021.12.001Search in Google Scholar
Najm, S., and K. Matsumoto. 2020. “Does Renewable Energy Substitute LNG International Trade in the Energy Transition?” Energy Economics 92: 104964, doi:https://doi.org/10.1016/j.eneco.2020.104964.Search in Google Scholar
Nurul Hossain, A. K. M., and A. Serletis. 2017. “A Century of Interfuel Substitution.” Journal of Commodity Markets 8: 28–42, https://doi.org/10.1016/j.jcomm.2017.09.001.Search in Google Scholar
Oguz Dirioz, A., E. Erbil, and A. Babalola. 2020. “Regional Gas Interconnectivity and the Implications of Trade in Liquified Natural Gas for Energy Security of Non-EU Western Balkan States.” Journal of Sustainable Development Law and Policy (The) 10 (2): 133–57, https://doi.org/10.4314/jsdlp.v10i2.1.Search in Google Scholar
Philips, P. C. B., and P. Perron. 1988. “Testing for a Unit Root in Time Series Regression.” Biometrika Trust 75 (2): 335–46.10.1093/biomet/75.2.335Search in Google Scholar
Prontera, A. 2018. “Italian Energy Security, The Southern Gas Corridor and the New Pipeline Politics in Western Europe: From the Partner State to the Catalytic State Oa.” Journal of International Relations and Development 21 (2): 464–94, doi:https://doi.org/10.1057/jird.2015.31.Search in Google Scholar
Shaikh, F., Q. Ji, and Y. Fan. 2016. “Assessing the Stability of the LNG Supply in the Asia Pacific Region.” Journal of Natural Gas Science and Engineering 34: 376–86, https://doi.org/10.1016/j.jngse.2016.07.011.Search in Google Scholar
Sims, C. A. 1980. “Macroeconomics and Reality.” Econometrica 48 (1): 1, doi:https://doi.org/10.2307/1912017.Search in Google Scholar
Sinn, H. W. 2008. “Public Policies Against Global Warming: A Supply Side Approach.” International Tax and Public Finance 15 (4): 360–94, https://doi.org/10.1007/s10797-008-9082-z.Search in Google Scholar
Skjærseth, J. B. 2018. “Implementing EU Climate and Energy Policies in Poland: Policy Feedback and Reform.” Environmental Politics 27 (3): 498–518.10.1080/09644016.2018.1429046Search in Google Scholar
Soybilgen, B., H. Kaya, and D. Dedeoglu. 2019. “Evaluating the Effect of Geopolitical Risks on the Growth Rates of Emerging Countries.” Economics Bulletin 39 (1): 715–25.Search in Google Scholar
Stopford, M. 2013. Maritime Economics, 3rd ed. New York: Routledge.10.4324/9780203442661Search in Google Scholar
Streimikiene, D., R. Ciegis, and D. Grundey. 2007. “Energy Indicators for Sustainable Development in Baltic States.” Renewable and Sustainable Energy Reviews 11 (5): 877–93, doi:https://doi.org/10.1016/j.rser.2005.06.004.Search in Google Scholar
Taghizadeh-Hesary, F., E. Rasoulinezhad, and N. Yoshino. 2019. “Energy and Food Security: Linkages Through Price Volatility.” Energy Policy 128: 796–806, https://doi.org/10.1016/j.enpol.2018.12.043.Search in Google Scholar
Tergin, D. 2006. “Ensuring Energy Security.” Foreign Affairs 85 (2): 69.10.2307/20031912Search in Google Scholar
Thorbecke, W. 2019. “How Oil Prices Affect East and Southeast Asian Economies: Evidence from Financial Markets and Implications for Energy Security.” Energy Policy 128: 628–38, https://doi.org/10.1016/j.enpol.2019.01.044.Search in Google Scholar
Wesseh, P. K., and B. Lin. 2020. “Energy Substitution and Technology Costs in a Transitional Economy.” Energy 203: 117828, https://doi.org/10.1016/j.energy.2020.117828.Search in Google Scholar
Winrow, G. M. 2016. “The Anatomy of a Possible Pipeline: The Case of Turkey and Leviathan and Gas Politics in the Eastern Mediterranean.” Journal of Balkan and Near Eastern Studies 18 (5): 431–47, https://doi.org/10.1080/19448953.2016.1196012.Search in Google Scholar
Wu, X. D., J. L. Guo, X. Ji, and G. Q. Chen. 2019. “Energy Use in World Economy from Household-Consumption-Based Perspective.” Energy Policy 127: 287–98, https://doi.org/10.1016/j.enpol.2018.12.005.Search in Google Scholar
Yin, Y., and J. S. L. Lam. 2021. “Energy Strategies of China and their Impacts on Energy Shipping Import Through the Straits of Malacca and Singapore.” Maritime Business Review 7 (2): 145–60, doi:https://doi.org/10.1108/MABR-12-2020-0070.Search in Google Scholar
Zhong, W., H. An, L. Shen, W. Fang, X. Gao, and D. Dong. 2017. “The Roles of Countries in the International Fossil Fuel Trade: An Emergy and Network Analysis.” Energy Policy 100: 365–76, https://doi.org/10.1016/j.enpol.2016.07.025.Search in Google Scholar
© 2022 the author(s), published by De Gruyter, Berlin/Boston
This work is licensed under the Creative Commons Attribution 4.0 International License.
Articles in the same Issue
- Frontmatter
- Research Articles
- Conflict or Cooperation: A Survival Analysis of the Relationship between Regional Trade Agreements and Military Conflict
- Temperature Variability and Trust in Vietnamese Rural Households
- Geopolitical Risk and the LNG-LPG Trade
- Militarization and Income Inequality in European Countries (2000–2017)