
Military Expenditures and Income Inequality among a Panel of OECD Countries in the Post-Cold War Era, 1990–2007
-
Jeremy C. Graham
 and
Danielle Mueller
and
Danielle Mueller

Abstract
Does military spending exacerbate income inequality? After the Cold War, many developed countries sought to reduce military expenditures in the face of a new security environment without the clear and present threat of large-scale international conflict. The literature has presented mixed evidence on the economic effects of military spending. Moreover, during this era analysts in the OECD have become preoccupied with the economic indicator of income equality. Our study examines the relationship between military expenditures and income inequality. Complementing the established literature on the subject, we find that these two phenomena indeed possess a positive relationship and it is unlikely that this association is due to random chance. Our results are robust to the inclusion of control variables common in the literature. These findings lead us to contemplate the historical and theoretical account of the peace dividend narrative.
Funding source: Division of Graduate Education
Award Identifier / Grant number: DGE-1313583
Funding statement: This material is based upon work supported by the National Science Foundation Graduate Research Fellowship Program, Division of Graduate Education, Funder Id: 10.13039/100000082, under Grant Number: DGE-1313583. Any opinions, findings, and conclusions or recommendations expressed in this material are those of the author(s) and do not necessarily reflect the views of the National Science Foundation.
Appendix
This section contains analyses that may be of interest to readers or reviewers that are not meant to be featured in the study itself. Because they are not simply meant to be inserted into the paper (where an explanation of the results is already present) we will briefly describe each figure or table and where or how it relates to our paper.
Alternative Tables for the Mann Whitney U Test
Inclusion of Portugal as a higher military spender
Portugal’s average military expenditures per GDP over the period of study are 2.07999%. Because it is so close to our average, Table 8 includes Portugal’s membership among these states. As you can see, including Portugal actually lowers the p-value.
Mann-Whitney U Test of Avg. Inequality grouped according to whether Avg. Military Expenditure is Higher than the OECD Avg.
| Country | Avg. EHII (1989–2007) | Avg. country mil. exp. > avg. OECD mil. exp. |
|---|---|---|
| Australia | 36.13 | No |
| Austria | 35.55 | No |
| Belgium | 38.15 | No |
| Canada | 38.02 | No |
| Chile | 47.8 | Yes |
| Czech Rep. | 28.76 | No |
| Denmark | 31.57 | No |
| Estonia | 34.89 | No |
| Finland | 33.22 | No |
| France | 36.74 | Yes |
| Germany | 34.73 | No |
| Greece | 43.29 | Yes |
| Hungary | 38.56 | No |
| Ireland | 36.18 | No |
| Israel | 43.13 | Yes |
| Italy | 36.83 | No |
| Japan | 40.05 | No |
| Luxembourg | 35.03 | No |
| Mexico | 45.39 | No |
| Netherlands | 35.94 | No |
| New Zeal. | 39.39 | No |
| Norway | 35.04 | Yes |
| Poland | 36.95 | No |
| Portugal | 38.62 | Yes |
| Slovakia | 36.16 | No |
| Slovenia | 31.74 | No |
| South Korea | 37.8 | Yes |
| Spain | 39.41 | No |
| Sweden | 29.59 | No |
| Switzerland | 31.97 | No |
| Turkey | 48.18 | Yes |
| UK | 36.06 | Yes |
| USA | 38.61 | Yes |
Mann-Whitney U Test Results: Z = −2.468, p = 0.0136.
Above NATO mandated average for Military average
European countries’ propensity to under-contribute to NATO military spending has remained a contentious issue for decades. Framing the presentation of the table in this way, in terms of countries at or exceeding the NATO target agreed to in 2006 and reaffirmed in 2014 of countries to target military spending at 2% of GDP. Although this move is mostly after the dataset, it may be a useful datapoint from a framing perspective (given that an “average of averages” measure may seem to some as convoluted).
Doing so adds Portugal and Australia to the list. As you can see in Table 9, there are no substantive changes from the Mann Whitney U test results presented in the paper.
Mann-Whitney U test of avg. inequality grouped according to whether avg. military expenditure is higher than NATO target.
| Country | Avg. EHII (1989–2007) | Avg. country mil. exp. > NATO target |
|---|---|---|
| Australia | 36.13 | Yes |
| Austria | 35.55 | No |
| Belgium | 38.15 | No |
| Canada | 38.02 | No |
| Chile | 47.8 | Yes |
| Czech Rep. | 28.76 | No |
| Denmark | 31.57 | No |
| Estonia | 34.89 | No |
| Finland | 33.22 | No |
| France | 36.74 | Yes |
| Germany | 34.73 | No |
| Greece | 43.29 | Yes |
| Hungary | 38.56 | No |
| Ireland | 36.18 | No |
| Israel | 43.13 | Yes |
| Italy | 36.83 | No |
| Japan | 40.05 | No |
| Luxembourg | 35.03 | No |
| Mexico | 45.39 | No |
| Netherlands | 35.94 | No |
| New Zeal. | 39.39 | No |
| Norway | 35.04 | Yes |
| Poland | 36.95 | No |
| Portugal | 38.62 | Yes |
| Slovakia | 36.16 | No |
| Slovenia | 31.74 | No |
| South Korea | 37.8 | Yes |
| Spain | 39.41 | No |
| Sweden | 29.59 | No |
| Switzerland | 31.97 | No |
| Turkey | 48.18 | Yes |
| UK | 36.06 | Yes |
| USA | 38.61 | Yes |
Mann-Whitney U Test Results: Z = −2.291, p = 0.0219.
Random Effects models w/AR(1) disturbances
Table 10 is essentially applying the model specification of Kentor et al. (2012), intended for scholars who are interested in a similar phenomenon. We opt to present the Driscoll-Kraay SEs due to the close proximity (and therefore virtual certainty of cross-sectional dependence) of our countries, making them a most sensible choice. The Kentor et al. (2012) study is more of a global sample and therefore it may not be as necessary to assume cross-sectional dependence. Nevertheless, we feel re-running our results using a similar model class serves as an appropriate robs.
RE GLS w/AR(1) disturbances
| Variables | (1) | (2) | (3) | (4) |
|---|---|---|---|---|
| EHII Gini | EHII Gini | EHII Gini | EHII Gini | |
| Military exp. % GDP | 0.545** | 0.541** | 0.589** | 0.409 |
| (0.236) | (0.235) | (0.239) | (0.221) | |
| Net. FDI out. % GDP | 0.00311 | 0.00311 | 0.00411 | 0.00246 |
| (0.00462) | (0.00463) | (0.00468) | (0.00465) | |
| Government consumption | 0.0977 | 0.0998 | 0.0935 | 0.111 |
| (0.0776) | (0.0777) | (0.0784) | (0.0774) | |
| Soc. welfare exp. % GDP | −0.108 | −0.109 | −0.0988 | −0.105 |
| (0.0555) | (0.0556) | (0.0565) | (0.0573) | |
| GDP growth | −0.0393** | −0.0391** | −0.0363** | −0.0395** |
| (0.0181) | (0.0182) | (0.0183) | (0.0183) | |
| Labor force part. | −0.189*** | −0.186*** | −0.188*** | −0.220*** |
| (0.0396) | (0.0404) | (0.0408) | (0.0386) | |
| Population (millions) | 0.00459 | 0.00424 | 0.00125 | −0.00364 |
| (0.00804) | (0.00792) | (0.00814) | (0.00714) | |
| GDP per capita (thousands) | 0.0128 | 0.0130 | 0.00574 | −0.00287 |
| (0.0164) | (0.0164) | (0.0169) | (0.0169) | |
| Trade union density | −0.0507*** | −0.0433** | −0.0459** | −0.0544*** |
| (0.0183) | (0.0210) | (0.0197) | (0.0187) | |
| Taxation % GDP | −0.0552 | −0.0537 | −0.0491 | −0.0599** |
| (0.0304) | (0.0305) | (0.0308) | (0.0304) | |
| Debt % GDP | 0.0104 | 0.0104 | 0.00802 | 0.00825 |
| (0.00736) | (0.00737) | (0.00747) | (0.00743) | |
| Imports % GDP | −7.282e + 07 | −9.053e + 07 | −6.547e + 08 | −1.260e + 06 |
| (1.476e + 08) | (1.485e + 08) | (3.645e + 08) | (1.447e + 08) | |
| Corporatist | 0.113 | |||
| (1.171) | ||||
| Liberal | 2.528 | |||
| (1.309) | ||||
| Post-communist | −2.960** | |||
| (1.327) | ||||
| Productivist | −0.126 | |||
| (1.917) | ||||
| SDEM | −1.362 | |||
| (1.462) | ||||
| CDEM | −0.556 | |||
| (0.733) | ||||
| Social democratic | −1.127 | |||
| (1.580) | ||||
| Constant | 52.69*** | 52.34*** | 53.66*** | 55.84*** |
| (2.899) | (2.998) | (3.037) | (3.291) | |
| Observations | 402 | 402 | 394 | 402 |
| Number of countries | 33 | 33 | 32 | 33 |
| N | 402 | 402 | 394 | 402 |
| Overall R-squared | 0.552 | 0.535 | 0.559 | 0.663 |
Standard errors in parentheses. Time dummies not reported.
*** p < 0.01, ** p < 0.05, * p < 0.01.
Prais-Winsten w/correlated PCSEs and panel-specific AR(1)
As an alternative to RE, in Table 11 we use Prais-Winsten regression with panel corrected standard errors (PCSE). If no autocorrelation were specified, this would be an OLS model. We use pairwise selection due to the unbalanced nature of the panel. Although we don’t report the results in this appendix (but do include the code in our replication file), whether we choose to allow the AR(1) coefficients of correlation to vary across panels or not, it does not make a substantive difference. One point we would like to note, regarding possible issue, is the high R2. We witnessed similar R2 even when the AR(1) does not vary. This may deserve further investigation, and at this point we will simply take note of it.
Prais-Winsten regression.
| Variables | (1) | (2) | (3) | (4) |
|---|---|---|---|---|
| EHII Gini | EHII Gini | EHII Gini | EHII Gini | |
| Military exp. % GDP | 0.541*** | 0.517*** | 0.602*** | 0.285** |
| (0.133) | (0.142) | (0.128) | (0.133) | |
| Net. FDI out. % GDP | 0.00804 | 0.00815 | 0.00900** | 0.00734 |
| (0.00454) | (0.00472) | (0.00441) | (0.00487) | |
| Government consumption | −0.00334 | −0.0115 | −0.0157 | 0.0203 |
| (0.0686) | (0.0682) | (0.0672) | (0.0731) | |
| Soc. welfare exp. % GDP | −0.225*** | −0.233*** | −0.206*** | −0.182*** |
| (0.0386) | (0.0377) | (0.0374) | (0.0548) | |
| GDP growth | −0.0628** | −0.0670** | −0.0580 | −0.0545** |
| (0.0318) | (0.0332) | (0.0310) | (0.0274) | |
| Labor force part. | −0.260*** | −0.275*** | −0.256*** | −0.308*** |
| (0.0341) | (0.0344) | (0.0376) | (0.0335) | |
| Population (millions) | −0.00208 | −0.00298 | −0.00352 | −0.00832*** |
| (0.00253) | (0.00241) | (0.00275) | (0.00270) | |
| GDP per capita (thousands) | 0.0328*** | 0.0342*** | 0.0347*** | 0.0244 |
| (0.0127) | (0.0127) | (0.0129) | (0.0135) | |
| Trade union density | −0.0639*** | −0.0912*** | −0.0668*** | −0.0989*** |
| (0.0127) | (0.0155) | (0.0133) | (0.0185) | |
| Taxation % GDP | 0.0172 | 0.0167 | 0.0222 | −0.0453 |
| (0.0367) | (0.0355) | (0.0380) | (0.0339) | |
| Debt % GDP | 0.0265*** | 0.0303*** | 0.0245*** | 0.0322*** |
| (0.00708) | (0.00668) | (0.00705) | (0.00554) | |
| Imports % GDP | −3.347e + 08*** | −3.036e + 08*** | −5.730e + 08*** | −7.252e + 07 |
| (1.127e + 08) | (1.154e + 08) | (1.971e + 08) | (9.827e + 07) | |
| Corporatist | −2.684** | |||
| (1.151) | ||||
| Liberal | −0.284 | |||
| (0.913) | ||||
| Post-communist | −4.351*** | |||
| (1.152) | ||||
| Productivist | −4.416*** | |||
| (1.310) | ||||
| CDEM | −1.608 | |||
| (1.263) | ||||
| SDEM | −1.726 | |||
| (1.291) | ||||
| Social democratic | 2.136*** | |||
| (0.705) | ||||
| Constant | 59.07*** | 60.89*** | 60.32*** | 66.15*** |
| (2.294) | (2.469) | (2.666) | (3.072) | |
| Observations | 402 | 402 | 394 | 402 |
| R-squared | 0.960 | 0.959 | 0.961 | 0.966 |
| Number of countries | 33 | 33 | 32 | 33 |
| Chi-squared statistic | 646.3 | 751.0 | 656.7 | 1114 |
| Chi-squared p-value | 0 | 0 | 0 | 0 |
Panel-Corrected Standard errors in parentheses.
*** p < 0.01, ** p < 0.05, * p < 0.01.
Robust Twostep Estimator “collapse” re-specification w/xtabond2
In Table 12 we present results using our base model of the DPD estimator with the user-created STATA package xtabond, using Windmeijer (2005) corrected standard errors. Despite the fact that using the collapse featuring drastically reduces the number of instruments (38) so that we have likely avoided overfitting, in our opinion, there are a couple reasons to nevertheless remain cautious this estimator. First, the estimator does not calculate the AR(1) statistic. This may not be important since it is not AR(1) violations that cause the mis-specification and the AR(2) statistic is calculated and we do not reject the null hypothesis, which is good for the model. Second, while passing the Sargan test is a good sign, the Hansen test statistic (0.042) yields a p-value of 1.00, which likely indicates inability of detection (though does not necessarily constitute a failure of the test). As we mention in the paper and others have mentioned elsewhere, these models are notoriously sensitive to specification. As with all the inferential models in the paper, we are conservative regarding their individual explanatory power.
System DPD estimation w/collapse feature and twostep.
| Variables | (1) |
|---|---|
| EHII Gini | |
| EHII Gini (lagged) | 0.753** |
| (0.306) | |
| Military exp. % GDP | 3.180*** |
| (0.920) | |
| Net. FDI out. % GDP | 0.0260*** |
| (0.00803) | |
| Government consumption | −2.052** |
| (0.994) | |
| Soc. welfare exp. % GDP | 0.0632 |
| (0.528) | |
| Debt % GDP | 0.0789* |
| (0.0447) | |
| MIDS onset | 1.033** |
| (0.429) | |
| GDP growth | −0.438*** |
| (0.0986) | |
| Labor force part. | 0.187* |
| (0.101) | |
| Population (millions) | −0.0646*** |
| (0.0202) | |
| GDP per capita (thousands) | 0.0512 |
| (0.0606) | |
| Trade union density | 0.0771 |
| (0.0542) | |
| Taxation % GDP | 0.00210 |
| (0.0280) | |
| Imports % GDP | 1.868e + 08 |
| (1.843e + 08) | |
| Constant | 26.69*** |
| (9.161) | |
| Observations | 385 |
| Number of countries | 33 |
| Chi-squared statistic | 104.7 |
| Chi-squared p-value | 2.16e−09 |
| AR(1) statistic | . |
| AR(1) p-value | . |
| AR(2) statistic | −0.938 |
| AR(2) p-value | 0.348 |
| Sargan test statistic | 3.895 |
| Hansen test statistic | 0.0402 |
Figure 3 shows the predicted value of Y from the base models – i.e. without political and welfare regime covariates – as they vary with the military spending % GDP variable.
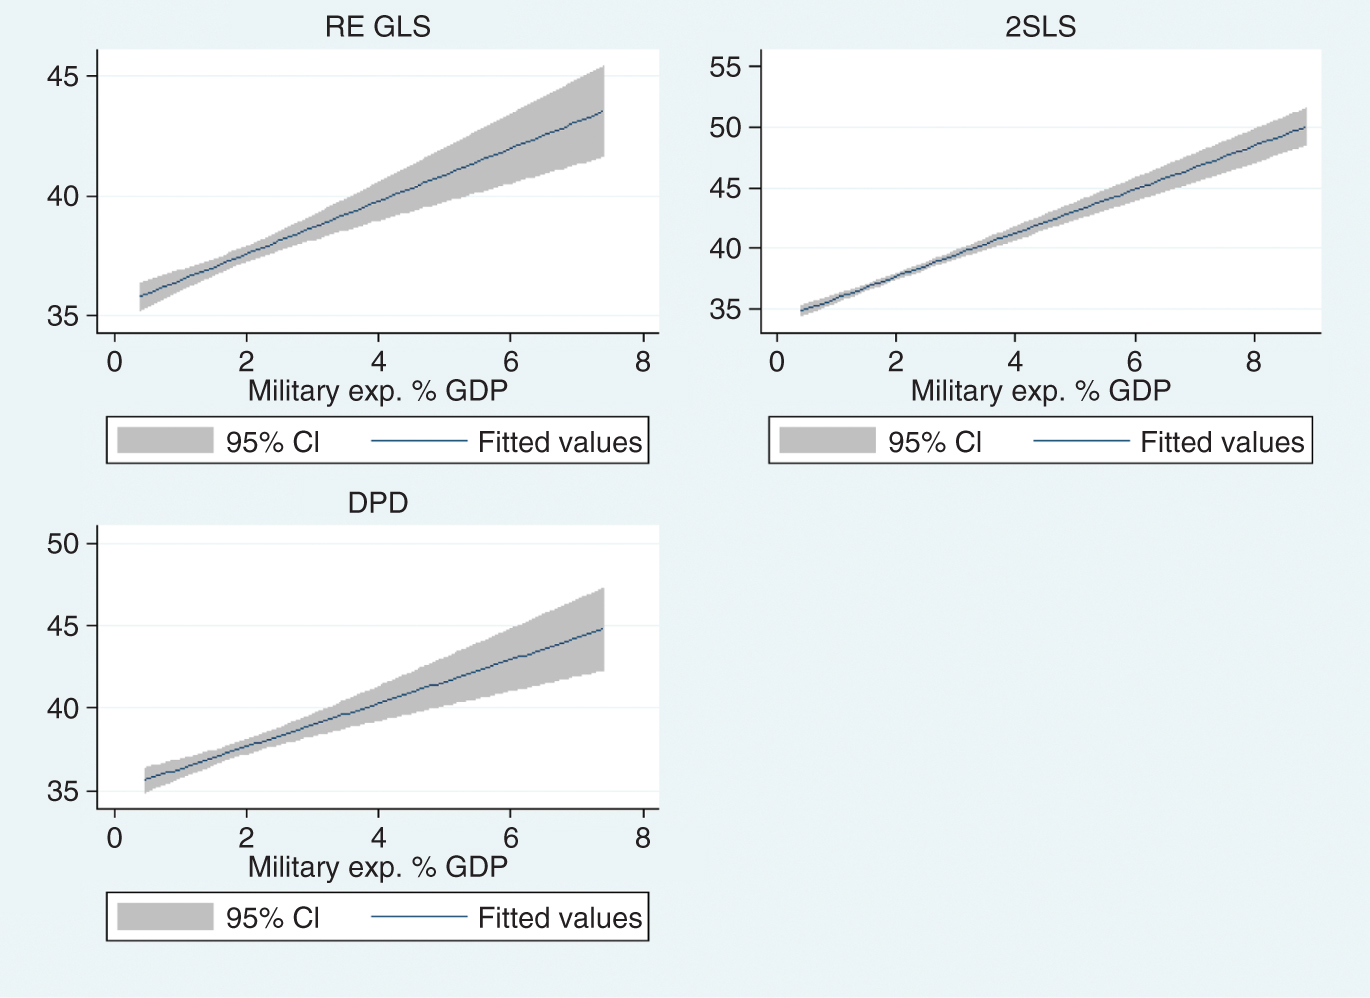
The predicted value of Y from the base models – i.e. without political and welfare regime covariates – as they vary with the military spending % GDP variable.
References
Abell, J. D. (1994). Military Spending and Income Inequality. Journal of Peace Research, 31(1), 35–43.10.1177/0022343394031001004Search in Google Scholar
Adair, B. (2008). The peace dividend began with a Bush. PolitiFact. Retrieved May 30, 2018 (http://www.politifact.com/truth-o-meter/statements/2008/jan/24/rudy-giuliani/the-peace-dividend-began-with-a-bush/).Search in Google Scholar
Adema, W., Fron, P., & Ladique, M. (2011). Is the European welfare state really more expensive? Indicators on social spending, 1980–2012; and a manual to the OECD social expenditure database (SOCX). OECD Social, Employment and Migration Working Papers No. 124. Retrieved May 21, 2018 (http://dx.doi.org/10.1787/5kg2d2d4pbf0-en).Search in Google Scholar
Ali, H. E. (2007). Military expenditures and inequality: empirical evidence from global data. Defence and Peace Economics, 18(6), 519–535.10.1080/10242690701331501Search in Google Scholar
Ali, H. E. (2011). Military expenditures and human development: guns and butter arguments revisited: a case study from Egypt. Peace Economics, Peace Science, and Public Policy, 17(1), 1–19.10.2202/1554-8597.1240Search in Google Scholar
Ali, H. E. (2012). Military Expenditures and Inequality in the Middle East and North Africa: A Panel Analysis. Defence and Peace Economics, 23(6), 575–589.10.1080/10242694.2012.663578Search in Google Scholar
Ali, H. E., & Galbraith, J. (2003). Military expenditures and inequality: empirical evidence from global data. The University of Texas at Austin UTIP Working Paper No. 24.Search in Google Scholar
Allison, P. (2015). Don’t put lagged dependent variables in mixed models. Statistical Horizons. 2 June 2015. Retrieved 18 August 2018 (https://statisticalhorizons.com/lagged-dependent-variables).Search in Google Scholar
Angrist, J. D. & Pischke, J.-S. (2008). Mostly Harmless Econometrics. Princeton, NJ: Princeton University Press.10.2307/j.ctvcm4j72Search in Google Scholar
Apostokalis, B. (1992). Warfare-welfare expenditure substitutions in Latin America, 1953–1987. Journal of Peace Research, 29(1), 85–98.10.1177/0022343392029001007Search in Google Scholar
Arellano, M., & Bond, S. (1991). Some tests of specification for panel data: monte carlo evidence and an application to employment equations. The Review of Economic Studies, 58(2), 277–297.10.2307/2297968Search in Google Scholar
Arellano, M., & Bover, O. (1995). Another look at the instrumental variable estimation of error-components models. Journal of Econometrics, 68(1), 29–51.10.1016/0304-4076(94)01642-DSearch in Google Scholar
Arriola, L. R., & Johnson, M. C. (2014). Ethnic politics and women’s empowerment in Africa: ministerial appointments to executive cabinets. American Journal of Political Science, 58(2), 495–510.10.1111/ajps.12075Search in Google Scholar
Baltagi, B., & Li, Q. (1992). A note on the estimation of simultaneous equations with error components. Econometric Theory, 8(1), 113–119.10.1017/S0266466600010768Search in Google Scholar
Baran, P. & Sweezy, P. (1966). Monopoly Capital. New York and London: Monthly Review Press.Search in Google Scholar
Barbieri, K., & Keshk, O. M. G. (2016). Correlates of war project trade data set codebook, Version 4.0. Online: http://correlatesofwar.org.Search in Google Scholar
Barbieri, K., Keshk, O. M. G., & Pollins, B. (2009). Trading data: evaluating our assumptions and coding rules. Conflict Management and Peace Science, 26(5), 471–491.10.1177/0738894209343887Search in Google Scholar
Barro, R. J. (2000). Inequality and growth in a panel of countries. Journal of Economic Growth, 5(1), 5–32.10.1023/A:1009850119329Search in Google Scholar
Benoit, E. (1978). Growth and defense in developing countries, Economic Development and Cultural Change, 26(2), 271–280.10.1086/451015Search in Google Scholar
Blundell, R., & Bond, S. (1998). Initial conditions and moment restrictions in dynamic panel data models. Journal of Econometrics, 87(1), 115–143.10.1920/wp.ifs.1995.9517Search in Google Scholar
Bulletin of the Atomic Scientists. (2018). Doomsday Clock > Timeline. Retrieved May 31, 2018 (https://thebulletin.org/timeline).Search in Google Scholar
Brauer, J. (2002). Survey and review of the defense economics literature on Greece and Turkey: what have we learned? Defence and Peace Economics, 13(2), 85–107.10.1080/10242690210969Search in Google Scholar
Borch, C., & Wallace, M. (2010). Military spending and economic well-being in the American states: the post-Vietnam war era. Social Forces, 88(4), 1727–1752.10.1353/sof.2010.0002Search in Google Scholar
Bush, G. (1991). Address to the nation on reducing the United States and Soviet weapons, 27 September 1991. Online by Gerhard Peters and John T. Woolley. Retrieved May 28, 2018 (http://presidency.ucsb.edu/ws/?pid=20035).Search in Google Scholar
Cappelen, Å., Gleditsch, N. P., & Bjerkholt, O. (1984). Military spending and economic growth in the OECD countries. Journal of Peace Research, 21(4), 361–373.10.1177/002234338402100404Search in Google Scholar
Caruso, R., & Di Domizio, M. (2016). Interdependence between US and European military spending: a panel cointegration analysis (1988–2013). Applied Economics Letters, 23(4), 302–305.10.1080/13504851.2015.1071466Search in Google Scholar
Caruso, R., & Di Domizio, M. (2017). Military spending and budget deficits: the impact of US military spending on public debt in Europe (1988–2013). Defence and Peace Economics, 28(5), 534–549.10.1080/10242694.2016.1228259Search in Google Scholar
Caputo, D. (1975). New perspectives on the public policy implications of defense and welfare expenditures in four modern democracies: 1950–1970. Policy Sciences, 6(4), 423–446.10.1007/BF00142383Search in Google Scholar
Chauvel, L., & Bar-Haim, E. (2016). Varieties of capitalism (VoC) and varieties of distributions (VoD): How welfare regimes affect the pre‐ and post‐transfer shapes of inequalities? Luxembourg Income Study Working Paper Series 677.Search in Google Scholar
Checchi, D., Visser, J., & van de Werfhorst, H. G. (2007). Inequality and union membership: the impact of relative earnings position and inequality attitudes. IZA Discussion Paper No. 2691. Available at SSRN: https://ssrn-com.proxy.library.nd.edu/abstract=980747.10.2139/ssrn.980747Search in Google Scholar
Cingano, F. (2014). Trends in income inequality and its impact on economic growth. OECD Social, Employment and Migration Working Papers, No. 163, OECD Publishing. doi: http://dx.doi.org/10.1787/5jxrjncwxv6j-en.10.1787/5jxrjncwxv6j-enSearch in Google Scholar
Cleveland, W. S. (1979). Robust locally weighted regression and smoothing scatterplots. Journal of the American Statistical Association, 74(368), 829–836.10.1080/01621459.1979.10481038Search in Google Scholar
Dabelko, D., & McCormick, J. M. (1977). Opportunity costs of defence: some cross-national evidence. Journal of Peace Research, 14(2), 145–154.10.1177/002234337701400204Search in Google Scholar
Davis, D. R., & Chan, S. (1990). The security-welfare relationship: longitudinal evidence from Taiwan. Journal of Peace Research, 27(1), 87–100.10.1177/0022343390027001008Search in Google Scholar
Deininger, K., & Squire, L. (1996). A new data set measuring income inequality. World Bank Economic Review, 10(3), 565–591.10.1093/wber/10.3.565Search in Google Scholar
Deger S., & Smith, R. (1983). Military expenditure and growth in less developed countries. Journal of Conflict Resolution, 27(2), 335–353.10.1177/0022002783027002006Search in Google Scholar
Domke, W. K., Eichenberg, R. C., & Kelleher, C. M. (1983). The illusion of choice: defense and welfare in advanced industrial democracies, 1948–1978. American Political Science Review, 77(1), 19–35.10.2307/1956009Search in Google Scholar
Driscoll, J. C., & Kraay, A. C. (1998). Consistent covariance matrix estimation with spatially dependent panel data. Review of Economics and Statistics, 80(4), 549–560.10.1162/003465398557825Search in Google Scholar
Dunne, J. P., & Tian, N. (2015). Military expenditure, economic growth and heterogeneity. Defence and Peace Economics, 26(1), 15–31.10.1080/10242694.2013.848575Search in Google Scholar
Faini, R., Annez, P., & Taylor, L. (1984). Defense spending, economic structure, and growth: evidence among countries and over time. Economic Development and Cultural Change, 32(3), 487–498.10.1086/451402Search in Google Scholar
Fisher, R. A. (1935). The Design of Experiments. Edinburgh: Oliver and Boyd.Search in Google Scholar
Galbraith, J. K., Priest, C., & Purcell, G. (2007). Economic equality and victory in war: an empirical investigation. Defence and Peace Economics, 18(5), 431–449.10.1080/10242690701455482Search in Google Scholar
Gholz, E., Press D. G., & Sapolsky, H. M. (1997). Come home, America: the strategy of restraint in the face of temptation. International Security, 21(4), 5–48.10.1162/isec.21.4.5Search in Google Scholar
Griffin, L. J., Devine, J. A., & Wallace, M. (1982). Monopoly capital, organized labor, and military expenditures in the United States, 1949–(1976). American Journal of Sociology, 88, S113–S153.10.1086/649254Search in Google Scholar
Helpman, E., Itskhoki, O., & Redding, S. (2010). Inequality and unemployment in a global economy. Econometrica, 78(4), 1239–1283.10.3386/w14478Search in Google Scholar
Henderson, E. A. (1998). Military spending and poverty. Journal of Politics, 60(2), 503–520.10.2307/2647920Search in Google Scholar
Higgs, R. (2006). Depression, war, and cold war: studies in political economy. Oxford, UK: Oxford University Press.10.1093/oso/9780195182927.001.0001Search in Google Scholar
Hoechle, D. (2007). Robust standard errors for panel regressions with cross-sectional dependence. The Stata Journal, 7(3), 281–312.10.1177/1536867X0700700301Search in Google Scholar
Hossein-zadeh, I. (2009). Social vs. military spending: how the escalating pentagon budget crowds out public infrastructure and aggravates natural disasters – the case of hurricane Katrina. Review of Social Economy, 67(2), 149–173.10.1080/00346760801932718Search in Google Scholar
Hossein-zadeh, I. (2010). Social vs. military spending – A Rejoinder. Review of Social Economy, 68(2), 221–225.10.1080/00346761003637154Search in Google Scholar
Hou, N., & Chen, B. (2013). Military expenditure and economic growth in developing countries: evidence from system GMM estimates. Defence and Peace Economics, 24(3), 183–193.10.1080/10242694.2012.710813Search in Google Scholar
Hsu, S. (2009). The effect of political regimes on inequality, 1963–2002. UNRISD flagship report. Combating poverty and inequality. Geneva: UNRISD.Search in Google Scholar
Intriligator, M. (1996). The peace dividend: myth or reality? In N. P. Dledistch, O. Bjerkholt, Å. Capellan, R. P. Smith, & J. P. Dunne (Eds.), The peace dividend (pp. 1–13). Amsterdam: Elsevier Science.10.1108/S0573-8555(1996)0000235003Search in Google Scholar
Judson, R., & Owen, A. (1999). Estimating dynamic panel models: a guide for macroeconomists. Economics Letters, 65(1), 9–15.10.1016/S0165-1765(99)00130-5Search in Google Scholar
Kagan, R. (2002). Power and weakness. Policy Review, 113, 3–28.Search in Google Scholar
Karagol, E. (2005). Defence expenditures and external debt in Turkey. Defence and Peace Economics, 16(2), 117–125.10.1080/10242690500070045Search in Google Scholar
Karagal. E. (2006). The relationship between external debt, defence expenditures and GNP revisited: the case of Turkey. Defence and Peace Economics, 17(1), 47–57.10.1080/10242690500369199Search in Google Scholar
Kentor, J., Jorgenson, A. K., & Kick, E. (2012). The “new” military and income inequality: a cross national analysis. Social Science Research, 41, 514–526.10.1016/j.ssresearch.2011.12.005Search in Google Scholar
Kennedy, P. (1987). The rise and fall of great powers. New York: Random House.Search in Google Scholar
Knight, M., Laoyza, N., & Villanueva, D. (1996). The peace dividend: military spending cuts and economic growth. Staff Papers (International Monetary Fund), 43(1), 1–37.10.2307/3867351Search in Google Scholar
Koehler, U. & Kreuter, F. (2009). Data analysis using stata. College Station, TX: Stata Press.Search in Google Scholar
Krugman, P. (2010). 1938 in 2010. The New York Times, 5 Sept 2010.Search in Google Scholar
Kurtz, M. J. (2002). Understanding the third world welfare state after neoliberalism: the politics of social provision in Chile and Mexico. Comparative Politics, 34(3), 293–313.10.2307/4146955Search in Google Scholar
Lin, E. S., & Ali, H. E. (2009). Military spending and inequality: panel granger causality test. Journal of Peace Research, 46(5), 671–685.10.1177/0022343309339247Search in Google Scholar
Lin, E. S., Ali, H. E., & Lu, Y.-L. (2015). Does military spending crowd out social welfare expenditures? Evidence from a panel of OECD countries. Defence and Peace Economics, 26(1), 33–48.10.1080/10242694.2013.848576Search in Google Scholar
Kus, B. (2012). Financialisation and income inequality in OECD nations: 1995–2007. The Economic and Social Review, 43(4), 477–495.Search in Google Scholar
Markusen, A. (1992). Dismantling the cold war economy. World Policy Journal, 9(3), 389–399.Search in Google Scholar
Markusen, A. (1997). How we lost the peace dividend. The American prospect. Retrieved 25 May, 2018 (http://prospect.org/article/how-we-lost-peace-dividend).Search in Google Scholar
Minnich, D. J. (2003). Corporatism and income inequality in the global economy: a panel study of 17 OECD countries. European Journal of Political Research, 42(1), 23–53.10.1111/1475-6765.00073Search in Google Scholar
Mintz, A. (1989). Guns versus butter: a disaggregated analysis. The American Political Science Review, 83(4), 1285–1293.10.1017/S0003055400088158Search in Google Scholar
Mintz, A., & Hicks, A. (1984). Military keynesianism in the United States, 1949–1976: disaggregating military expenditures and their determination. American Journal of Sociology, 90(2), 411–417.10.1086/228086Search in Google Scholar
Mintz, A., & Stevenson, R. T. (1995). Defense expenditures, economic growth, and the ‘peace dividend’. Journal of Conflict Resolution, 39(2), 283–305.10.1177/0022002795039002004Search in Google Scholar
Mishel, L. (2012). Unions, inequality, and faltering middle-class wages. Economic Policy Institute, Issue Brief #342.Search in Google Scholar
O’Boyle, E. (2010). ‘Social vs. military spending’: a different perspective. Review of Social Economy, 68(2), 205–219.10.1080/00346760903480921Search in Google Scholar
OECD. (2011). An overview of growing income inequalities in OECD countries: main findings. Divided We Stand: Why Inequality Keeps Rising. http://www.oecd.org/els/soc/dividedwestandwhyinequalitykeepsrising.htm.Search in Google Scholar
Özsoy, O. (2002). Budgetary trade-offs between defense, education and health expenditures: the case of Turkey. Defence and Peace Economics, 13(2), 129–136.10.1080/10242690210968Search in Google Scholar
Palme, O. (1982). Military spending: the economic and social consequences. Challenge, 25(4), 4–21.10.1080/05775132.1982.11470786Search in Google Scholar
Peroff, K. (1977). The warfare-welfare tradeoff: health, public aid and housing. Journal of Sociology and Social Welfare, 4(3-4), 366–381.Search in Google Scholar
Roodman, D. (2009). Practitioner’s corner: a note on the theme of too many instruments. Oxford Bulletin of Economics and Statistics, 71(1), 135–158.10.1111/j.1468-0084.2008.00542.xSearch in Google Scholar
Russett, B. (1982). Defense expenditures and national well-being. American Political Science Review, 76(4), 767–777.10.1007/978-3-319-13850-3_7Search in Google Scholar
Sarafidis, V., & Wansbeek, T. (2012). Cross-sectional dependence in panel data analysis. Econometric Reviews, 31(5), 483–531.10.1080/07474938.2011.611458Search in Google Scholar
Seiglie, C. (1997). Deficits, defense, and income redistribution. Cato Journal, 17(1), 11–21.Search in Google Scholar
Sen, A. (1997). Inequality, unemployment and contemporary Europe. International Labour Review, 136(2), 155–172.Search in Google Scholar
Sezgin, S., & Yildirim, J. (2002). The demand for Turkish defence expenditure. Defence and Peace Economics, 13(2), 121–128.10.1080/10242690210973Search in Google Scholar
Slemrod, J. (1992). Taxation and inequality: a time-exposure perspective. Paper prepared for the National Bureau of Economic Research Conference, November 19, Washington, DC.10.3386/w3999Search in Google Scholar
Streeten, P. (1993). The special problems of small countries. World Development, 21(2), 197–202.10.1016/0305-750X(93)90014-ZSearch in Google Scholar
Szymanski, A. (1973). Military spending and economic stagnation. American Journal of Sociology, 79(1), 1–14.10.1086/225503Search in Google Scholar
Thatcher, M. (1994). Speech in Mexico. Margaret Thatcher Foundation. Retrieved May 28, 2018 (https://www.margaretthatcher.org/document/108332).Search in Google Scholar
Töngür, Ü., & Elveren, A. Y. (2015). Military expenditures, income inequality, welfare and political regimes: a dynamic panel data analysis. Defence and Peace Economics, 26(1), 49–74.10.1080/10242694.2013.848577Search in Google Scholar
Wallace, M., Borch, C., & Gauchat, G. (2008). Military keynesianism in the post-vietnam war era: a view from the American states. Journal of Political and Military Sociology, 36(2), 215–245.Search in Google Scholar
Wijeweera, A., & Webb, M. J. (2011). Military spending and economic growth in South Asia: a panel data analysis. Defence and Peace Economics, 22(5), 545–554.10.1080/10242694.2010.533905Search in Google Scholar
Windmeijer, F. (2005). A finite sample correction for the variance of linear efficient two-step GMM estimators. Journal of Econometrics, 126(1), 25–51.10.1016/j.jeconom.2004.02.005Search in Google Scholar
Wolde-Rafael, Y. (2016). Military expenditure and income distribution in South Korea. Defence and Peace Economics, 27(4), 571–581.10.1080/10242694.2014.960247Search in Google Scholar
Yildirim, J., Sezgin, S., & Öcal, N. (2005). Military expenditure and economic growth in Middle Eastern countries: a dynamic panel data analysis. Defence and Peace Economics, 16(4), 283–295.10.1080/10242690500114751Search in Google Scholar
Yilgör, M., Karagöl, E. T., & Saygili, Ç. A. (2014). Panel causality analysis between defence expenditure and economic growth in developed countries. Defence and Peace Economics, 25(2), 193–203.10.1080/10242694.2012.724879Search in Google Scholar
Zhang, Y., Liu, X., Xu, J., & Wang, R. (2017). Does military spending promote social welfare? A comparative analysis of the BRICS and G7 countries. Defence and Peace Economics, 28(6), 686–702.10.1080/10242694.2016.1144899Search in Google Scholar
©2019 Walter de Gruyter GmbH, Berlin/Boston
Articles in the same Issue
- Editorial
- 2nd Walter Isard Annual Award for the Best Article in Peace Economics Peace Science and Public Policy
- Research Articles
- Armed Conflict and Schooling in Rwanda: Digging Deeper
- Sounding the Alarm: The Political Economy of Whistleblowing in the US Security State
- Military Expenditures and Income Inequality among a Panel of OECD Countries in the Post-Cold War Era, 1990–2007
- Polity Stability, Economic Growth, and Investment: A Dynamic Panel Analysis
- Government Debt and Economic Growth. A Threshold Analysis for Greece