Education program for controversial defect of recent X-ray instrument termed as a simultaneous small angle X-ray scattering and wide angle X-ray diffraction measuring instrument
-
Masaru Matsuo
 and
Yuezhen Bin
and
Yuezhen Bin

Abstract
Simultaneous rotations of sample and X-ray detected counter are needed to evaluate orientation distribution of crystallites and amorphous chains oriented predominantly parallel to the film surface in addition to exact diffraction peak profiles obtained without the complicated intensity corrections. The rotation mode is known as “θ–2θ scanning” system (θ: film, 2θ: counter). The system has been mainly used in research and development institutes. However, such instruments are not produced at present. Recently, small angle X-ray scattering (SAXS) and wide angle X-ray diffraction (WAXD) intensities have been measured by using X-ray beam generated along one direction. The brand name of the instrument is “a simultaneous SAXS and WAXD measuring instrument”. The X-ray beam generated by the instrument has surely high luminance providing high degree resolution of peak profiles by diffraction and/or scattering. The sample stage and detector, however, are fixed, since the intensities for SAXS and WAXD are obtained by the digital display of the number of X-ray photons detected on the imaging plate. Such optical system contains controversial defect on evaluating orientation of crystal planes parallel to the surface of films prepared by T-die and inflation methods as well as the exact profile. The imaging plate cannot detect the diffraction intensity from the crystal planes existing in the angle range between incident beam and Bragg angle associated with the diffraction peak position of the individual crystal planes.
Introduction
There are a number of investigations for polymer films by using wide angle X-ray diffraction (WAXD) and small angle X-ray scattering (SAXS). Most of works have been carried out by using two different X-ray beams generated along the opposite directions from one common source. The sample stage and detected counter under WAXD and SAXS measurements can be rotated with relationship termed as “θ–2θ scanning” [1], [2], [3]. The diffraction peaks from all crystal planes independent of extinction rule appear when crystal planes within a sample satisfy their own Bragg condition by the scanning. Unfortunately, such X-ray instruments assuring the high accuracy evaluation tend to fewer year by year, since the main users of the X-ray instruments investigate about SAXS profile and single crystal powders and their investigations are hardly affected by the following controversial defect. For the recent X-ray instrument with high luminance beam, the intensities for SAXS and WAXD are presented by the direct digital display of the number of X-ray photons detected on the imaging plate.
This paper warns strongly the defects of the recent instrument termed as “a simultaneous SAXS and WAXD measuring instrument”, to polymer scientists who investigate orientation of crystallites in polymer films prepared by T-die and inflation methods. The orientation of crystallites is important to investigate mechanical property of polymer materials but the recent evaluation have been done by imaging plate of WAXD providing intuitive understanding about the rough orientation behavior of crystallites.
The general evaluation for orientation function of crystallites was established by Roe and Krigbaum [4], [5] and the applications have been proposed for orthorhombic [6], [7], [8], monoclinic [9], [10] and triclinic crystal unites [11], [12]. The orientation functions of reciprocal vector for a number of crystal planes are indispensable to evaluate the orientation distribution function of crystallites. When the crystal planes are oriented parallel to the film surface predominantly, the evaluation for crystallite orientation is impossible by using a so-called “a simultaneous SAXS and WAXD measuring instrument” independent of the θ–2θ scanning. The detailed illustration for the defect of the recent machines shall be shown later in Results and Discussion.
The optical path of the recent instrument is much longer than that of the classical machine type because of high brightness of X-ray beam. The recent instrument is suitable for evaluating SAXS profile as well as single-crystal powder. This instrument, however, has the controversial defect to evaluate orientation of crystallites whose particular crystal planes are oriented predominantly parallel to the film surface. This is attributed to the essential geometrical problem concerning X-ray diffraction. The young’s scientists should understand that the orientation modes of reciprocal vector for a number of crystal planes can be obtained only by using the classical instrument with the θ–2θ scanning.
The subjects in this paper have been developed as one of the teaching programs to study polymer materials by X-ray at Dalian University of Technology in addition to the generation of characteristic X-ray [13]. Except the main illustrations interpreting the defect, the experimental results listed in references, which have been published elsewhere, are utilized to establish the justification of this paper.
Results and discussion
Controversial defect of recent X-ray instruments for evaluating orientation of crystallites whose chain axes are oriented predominantly parallel to the film surface
The schematic outline for the recent X-ray instrument with X-ray beam with high brightness is shown in Fig. 1a. The optical path of the recent instrument is much longer than the classical instrument type assuring simultaneous rotations of sample (θ) and counter (2θ). As described already, the recent instrument type is certainly suitable for evaluating SAXS intensity which is presented by the direct digital display of the number of X-ray photons detected on the imaging plate.

(a): A recent X-ray instrument to measure SAXS and WAXD, termed as “a simultaneous SAXS and WAXD measuring instrument”. (b): Geometrical arrangement between crystal plane and diffraction arc appeared in WAXD imaging plate.
This instrument, however, has the controversial defect to evaluate the orientation of crystallites whose particular crystal planes are oriented predominantly parallel to the film surface, because of geometrical coordinate of X-ray diffraction. Strictly speaking, the exact evaluation is impossible by “a simultaneous SAXS and WAXD measuring instrument” shown in Fig. 1a.
Figure 1b shows the schematic diagram to interpret the reason. The arcs on the imaging plate reflect the projection views of reciprocal points in the reciprocal space. Generally, in the coordinate, the polar angle between the reciprocal lattice vector rj of the jth crystal plane and reference axis of the specimen is termed as θj and the diffraction angle is termed as 2θB. The angle φB is the angle between OP and OX2 axes. Considering spherical triangle LMN, the following relationship can be constructed.
Equation (1) points out the defect of the recent instrument. Let’s consider the diffraction intensity represented by the digital display of the number of photons detected on the imaging plate in the range φB=θ~90°.
Equation (2) indicates that the diffraction arc on the imaging plate is associated with θj in the range from θB to π/2 (90°) and then diffraction intensity from the crystal plane existed in the range of θj from 0° to θB cannot be detected. In other words, the imaging plate cannot detect the diffraction intensity from crystal planes existed in the above angle range.
Instead of Fig. 1b represented for the general case, let’s consider simpler diagrams shown in Fig. 2, in which a number of pieces of thin films prepared by simultaneous biaxial stretching are stacked in a small exquisite instrument [8], [12]. In each film, the crystal chain axes are oriented randomly with respect to the film normal direction (the X3 axis). The frames (a) represents the measurement method for orientation of crystal planes parallel to the film surface, while the frame (b) represents the measuring method for the orientation of crystal planes perpendicular to the film surface. θj is the rotating angle around the X1 axis in the range 0~90°. The frames (c) and (d) indicate that the diffraction intensity from the crystal planes parallel to the film surface must be detected by θ–2θ scanning at angle θj fixed with suitable interval in the range of 0~90°. Without this treatment, the diffraction from crystal planes parallel to the film surface cannot be detected. That is, when the crystal planes orient parallel to the film surface, the incident X-ray beam passes through without diffraction. At θj, the diffraction intensity peak appears when the film is tilted at θB with respect to incident beam. The evaluation about orientation of crystallites by WAXD image causes the controversial defect except films and/or fibers with random orientation of crystal chain axes with respect to the stretching and/or spinning direction.

A number of stacked thin films to measure X-ray diffraction intensity distribution as a function of twice the Bragg angle 2θB at (a) θj=0° and (b) θj=90°. The condition to detect X-ray diffraction intensity from crystal planes parallel to the film surface, (c) geometrical diagram of diffraction intensity from crystal plane parallel to film surface, (d) geometrical arrangement to detect the intensity by counter.
Figure 3a and b show the examples of WAXD image (through view) for uniaxial stretching polyethylene (PE) films and WAXD image (end view) for simultaneous biaxial stretching films, respectively, observed on flat imaging plate. The observation was done by classical instrument but the principle is the same as that for the recent instrument. The images are shown to point out the controversial defect of WAXD image. The image (a) can reflect the highly preferential orientation of the c-axes with respect to the X3 axis (the reference axis along stretching direction), in which the crystal chain axes orient randomly with respect to the X3 axis.
![Fig. 3: (a) WAXD image from uniaxial stretching PE film elongated to 50 times, in which the X3 is the stretching direction [14]. (b) WAXD image (end view) from PE film elongated to λ=8.7×8.7 times by simultaneous biaxial stretching, in which the X3 is the film normal direction [8].](/document/doi/10.1515/pac-2017-0801/asset/graphic/j_pac-2017-0801_fig_003.jpg)
The photographic image as shown in Fig. 3a reflects accurate orientation behavior of crystallites whose crystal chain axes orient randomly with respect to the stretching direction (the X3 axis). That is, for stretching films and fibers, the image provides the almost correct information in the range of 2θ<40° except in the case where the c-axes are oriented almost parallel to the stretching direction for the PE films with draw ratio beyond 50 times [14]. In such films, the (002) planes are oriented almost parallel to an incident X-ray beam.
In contrast, the X3 axis in the image (b) is taken along the film normal direction setting in the same coordinate as Fig. 2, which is different from stretching direction in the image (a). The image (b) contains the same controversial defect because of no diffraction from the crystal plane existed in the Bragg angle range between 0 and θB for the intrinsic crystal plane at θj=0°. In other words, the information about orientation of reciprocal vectors between π/2−θB and π/2 cannot be obtained as shown in Fig. 2d.
To resolve the defect discussed above, the θ–2θ scanning must be acquired at fixed angle θj in the range from 0 to 90° as shown in Fig. 3b. The orientation function 2πqj(cosθj) of the reciprocal lattice vector for individual crystal planes is shown in Fig. 4. The function 2πqj(cosθj) of the reciprocal lattice vector of the jth crystal plane is given by
![Fig. 4: Orientation distribution function 2πqj(cosθj) for the reciprocal lattice vector rj of the jth crystal plane [j= (110), (210), (020)…] for the films with λ=8.7×8.7. Open circles are experimental results and the dotted lines are recalculated results by using the orientation distribution function ω(θ, η) of crystallites [8].](/document/doi/10.1515/pac-2017-0801/asset/graphic/j_pac-2017-0801_fig_004.jpg)
Orientation distribution function 2πqj(cosθj) for the reciprocal lattice vector rj of the jth crystal plane [j= (110), (210), (020)…] for the films with λ=8.7×8.7. Open circles are experimental results and the dotted lines are recalculated results by using the orientation distribution function ω(θ, η) of crystallites [8].
Hence,
where Ij(θj) for the jth crystal plane is the diffraction intensity distribution measured at a fixed angle θj. Ij(θj) can be obtained by many peak separations of X-ray diffraction intensity curve as a function of 2θB after corrections such as air scattering, absorption coefficient, polarization and amorphous halo corrections. Many peaks are located in the ranges of 2θB from 10 to 75° for PE. The measurements of Ij(θj) must be done by sample rotation around film normal direction at 2~5° intervals of θj from 0 to 90°. The function 2πqj(cosθj) for the reciprocal lattice vector of the (200) plane has a very sharp peak at θj=0°, while the function 2πqj(cosθj) for the (110) plane has two peaks at θj=0° and 60°, respectively. Such orientation modes reflect the symmetrical arcs of X-ray image in Fig. 3b.
The recent X-ray instrument gives the function 2πqj(cosθj) calculated by the measured intensity Ij(θj) for the digital display of the number of X-ray photons detected on the imaging plate in the range θj=0~90° (or φB=0~90° in Fig. 1b). As discussed before, however, it should be recognized that 2πqj(cosθj) at θj=0° does not count the diffraction intensity from the crystal plane existed in the range 0~θB. The intensity peak at θj=0° for the (200) plane appeared on the imaging plate in Fig. 3b is obviously attributed to the diffraction from the (200) plane of crystallites oriented at θB = −12.0°, while the peak at θj=180° corresponds to the diffraction at θB=12.0°. Hence the apparent maximum photographic density at θj=0° and 180° is slightly misaligned from the diffraction intensity distributions from the (200) planes oriented parallel to the film surface. The arcs at θj=0 and 180° in Fig. 3b are attributed to the diffraction from the (200) plane oriented at θB=±12°, respectively, with respect to the film normal direction. Then the preferential orientation of the (200) plane reflected as the two curves on the image does not provide the real orientation function of 2πqj(cosθj). Actually, the magnitude of broad blackness arcs around θj=0 and 180° in Fig. 3b is less accurate in comparison with the very sharp peak of 2πqj(cosθj) at θj=0° in Fig. 4 reflecting real preferential orientation of the (200) plane. Accordingly, the correct profile of 2πqj(cosθj) must be measured only by using the X-ray instrument with the θ–2θ scanning at the individual θj.
For the (110) plane, two arcs appear on the image in Fig. 3b and the corresponding function of 2πqj(cosθj) in Fig. 4 provides two peaks. Such complicated orientation mode must be evaluated by the θ–2θ scanning.
As described already, the accurate peak intensity cannot be measured by any image, since many diffraction peaks located in the 2θB range must be detected on the narrow area of the image plate. The functions 2πqj(cosθj) for individual crystal planes in Fig. 4 were obtained after the peak separations.
Question can be arisen as to why such detailed functions for many crystal planes are needed. Conclusively, the accurate evaluation of crystallite orientation mode must be analyzed by using orientation distribution function of crystallites. The common evaluation method is discussed for two representative polymers, PE with an orthorhombic unit and poly(ethylene terephthalate) (PET) with a triclinic unit in the following sentences.
To obtain the orientation distribution function ω(θ, η) of crystallites, three coordinates for the geometrical arrangement of crystallites are proposed in Fig. 5 to pursue the general description of ω(θ, η).
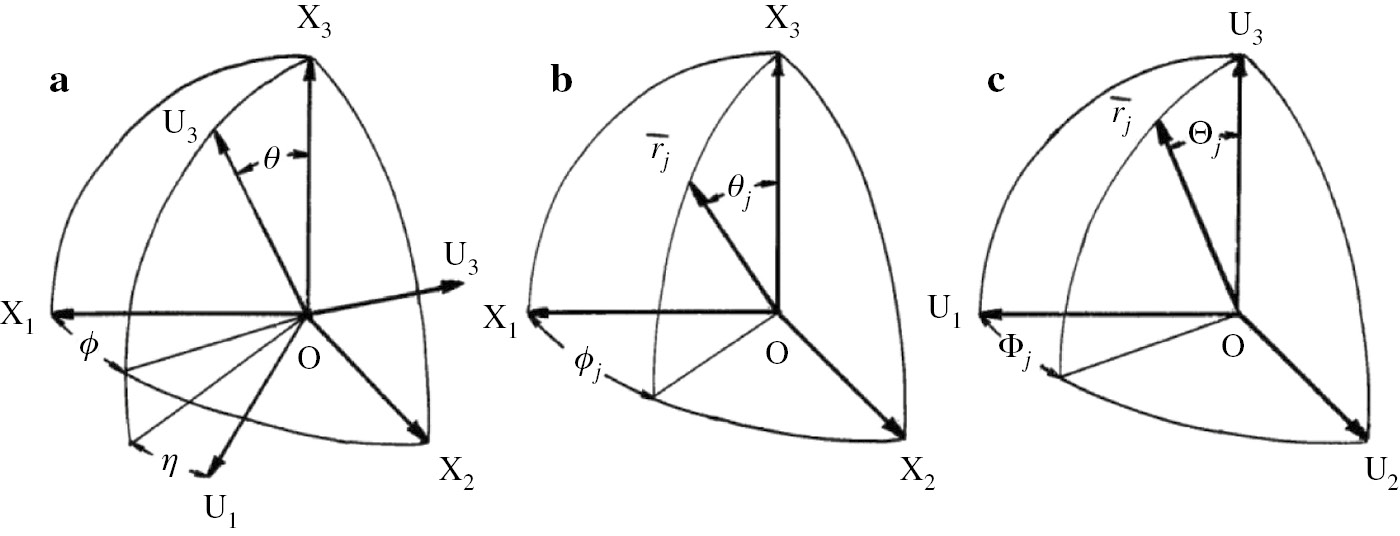
Cartesian coordinates illustrating the geometrical relation (a) Euler angles θ and η which specify the orientation of coordinate O-U1U2U3 of structural unit with respect to the coordinate O-X1X2X3 of a specimen. (b) Angles θj and ϕj which specify the orientation of the given jth axis of the structural unit with respect to the coordinate O-X1X2X3. (c) Angles Θj and Φj which specify the orientation of the given jth axis of the structural unit with respect to the coordinate O-U1U2U3.
For PE with an orthorhombic (a≠b≠c, α=β=γ=90°) unit, the U3, U2 and U1 axes may be taken along the c, b and a axes, respectively. For PET with a triclinic unit (a≠b≠c, α≠β≠γ≠90°), the U3 axis is taken perpendicular to the U1U2 plane. The U1 axis is taken along [100] axis (different from the a-axis) and then the U2 axis is taken perpendicular to the U3 and U1 axes. The U3 axis has a random orientation around the X3 axis (the film normal direction). The X3 axis is along film normal direction.
Under uniaxial system with respect to the X3 axis, the orientation factor
Based on Eq. (5), the orientation distribution function ω(θ, η) of crystallites can be obtained as follows:
where
In actual evaluation for the orientation distribution function ω(θ, η) of crystallites, it is important to consider the difficulty in achieving peak separation in WAXD intensity as a function of 2θB. Namely, there are some calculations in the case where Bragg angle reflections are located very close to each other. Especially, the separation is difficult for crystal planes with weak diffraction intensity. The individual functions 2πqj(cosθj) can be obtained clearly for the crystal planes with strong diffraction intensity, while the other functions must be estimated as an overlapped peak of two or three crystal planes. In this case, the composed function 2πqj(cosθj) includes the contribution from several planes as follows:
The concept underlying Eq. (9) was first presented by Roe and Krigbaum [4], [5]. Ni is the number of separate peaks for the jth superposed peak and Cij is the relative (normalized) weight for the vector rij. Namely, the peak profile of the jth crystal plane composes of the superposed profiles with i number crystal planes. Before the numerical calculation by computer, initial values of Cij are given by
where Fij is the structure factor of the jth crystal plane.
In this case, Eq. (6) may be rewritten as follows:
Subtracting Eq. (11) into Eq. (9), the function 2πqj(cosθj) can be calculated. The calculated curves must be in good agreement with the experimental results. For this purpose, weighting factors ρj were assumed initially to be nearly proportional to square of the structure factor and were subsequently varied to obtain the best fit between experimental and recalculated results by computer. The fitting was done by simplex method [15]. In actual calculation by computer, ρj is fixed to be unity for the crystal plane with the strongest diffraction intensity. For PET, the (100) plane is selected to be unity as listed in Table 1. A mean-square error R between the calculated factor
Weight parameters ρj and Cij as well as the second order orientation factor
| i | 2θB | hkl | ρj | Cij | |
|---|---|---|---|---|---|
| 1 | 16.42 | (01̅1) | 0.73793 | −0.200 | |
| 2 | 17.53 | 010 | 0.50035 | −0.107 | |
| 3 | 21.31 | (1̅11) | 0.43793 | 0.0743 | |
| 4 | 22.54 | (1̅10) | 0.00959 | 0.411 | |
| 5 | 23.57 | (011) | 0.21451 | 0.0124 | |
| 6 | 24.71 | (1̅12) | 0.39700 | −0.269 | |
| 7 | 25.69 | (100) | 1.00000 | 0.605 | |
| 8 | 26.44 | (1̅03) | 0.09775 | −0.407 | |
| 9 | 27.84 | (11̅1) | 0.07939 | 0.470 | |
| 10 | 28.75 | (01̅3) | 0.19120 | −0.357 | |
| 11 | 30.77 | (003) | 0.27201 | −0.106 | |
| 12 | 31.44 | (112̅) | 0.10076 | 0.1818 | 0.706 |
| (12̅0) | 0.4091 | −0.0053 | |||
| (012) | 0.4091 | 0.0042 | |||
| 13 | 32.80 | (1̅13) | 0.29521 | 0.2713 | −0.205 |
| (1̅21) | 0.4722 | −0.116 | |||
| (1̅21̅) | 0.2565 | −0.141 | |||
| 14 | 32.28 | (02̅2) | 0.15239 | 0.9417 | −0.200 |
| (12̅1) | 0.0583 | 0.107 | |||
| 15 | 42.70 | (1̅05) | 0.41677 | 0.0092 | −0.483 |
| (02̅4) | 0.9918 | −0.267 | |||
| 16 | 45.58 | (111) | 0.33893 | 0.0795 | 0.394 |
| (2̅10) | 0.9205 | 0.607 | |||
| 17 | 47.38 | (1̅24) | 0.000403 | −0.233 | |
| 18 | 48.45 | (13̅2) | 0.00256 | 0.5000 | −0.037 |
| (2̅05) | 0.5000 | −0.282 | |||
| 19 | 49.55 | (1̅31) | 0.00206 | 0.5088 | −0.157 |
| (121̅) | 0.2809 | 0.186 | |||
| (032̅) | 0.2103 | −0.145 |
As described above,
As for an orthorhombic unit like PE, Eqs. (6) (or Eq. 11) and (7) can be simplified as follows:
Returning to Fig. 4, the functions 2πqj(cosθj) for the PE film are represented as dotted lines by using the coefficients Fℓ0n (ℓ and n: even) recalculated by the orientation distribution function ω(θ, η) of crystallites. These dotted lines are in good agreement with the experimental plots, which supports the accuracy for ω(θ, η).
Of course, the above complicated evaluation for orientation mode of crystallites is impossible by using “a simultaneous SAXS and WAXD measuring instrument”, since there is no way to obtain accurate Ij(θj) for the jth crystal plane by imaging plate.
Figure 6a and b shows the orientation distribution function ω(θ, η) of crystallites within the PE films with biaxial elongation times 8.7×8.7 and PET films with 4×4, respectively. ω(θ, η) of PE provides ω(θ, η)=ω(θ, −η)=ω(θ, π−η)=ω(θ, π+η).
![Fig. 6: Orientation distribution function ω(θ, η) of crystallites for (a) PE with λ=8.7×8.7 (biaxial stretching) [8]; (b) PET films with λ=4×4 (biaxial stretching) [12].](/document/doi/10.1515/pac-2017-0801/asset/graphic/j_pac-2017-0801_fig_006.jpg)
For the PE film, the magnitude of the contour map in Fig. 6a is the highest at θ=90° and η=0°. The map indicates that the a- and c-axes orient parallel to the film surface predominantly. Actually, as shown in Fig. 4, 2πqj(cosθj) of rj for the (200) and (002) planes have one peak at θj=0° and 90°, respectively and the maximum density of 2πqj(cosθj) of rj (the b-axis) for the (020) plane appears at θj=90°. Accordingly, the peak around at θj=60° is reasonable for the (110) plane, since Θj is close to 53°. On the other hand, the large maximum peak at θj=0° for the reciprocal lattice vector of the (110) plane indicating the planer orientation reveals slightly complicated orientation behavior of crystallites. The peak is probably thought to be attributed to each small peak of the reciprocal lattice vector for the (002) and (020) planes appeared at θj=30°. Such complicated profiles of 2πqj(cosθj) for the crystal planes are attributed to the slightly complicated profile of ω(θ, η). The dotted lines of 2πqj(cosθj) recalculated from ω(θ, η) in Fig. 4 are in good agreement with the experimental plots. This indicates high reliability of the function ω= (θ, η) [8].
Based on the contour map, it is evident that the orientation of crystallites within simultaneous biaxial stretching PE films up to 8.7×8.7 is mainly due to the preferential orientation of the a- and c-axes on the film surface but a somewhat complicated profile suggests existence of another complicated orientation modes. The map indicates that the orientation of crystallites is different from a floating model associated with affine mode. If orientation follows affine mode, the contour map with maximum population must show a circular profile independent of η.
For the simultaneous biaxial stretching PET film with 4×4, 2πqj(cosθj) for the individual crystal planes are shown in Fig. 7 and 2πqj(cosθj) for two overlapped crystal planes are shown in Fig. 8. The overlapped peaks which are difficult to classify into two separate crystal planes are shown in Fig. 8. The representation in Fig. 8 is due to the difficulty for peak separation because of close proximity positions of the planes. The function ω(θ, η) of crystallites calculated by using 2πqj(cosθj) is shown in Fig. 6b.
![Fig. 7: The observed orientation functions of 2πqj(cosθj) (open circles) and the recalculated functions (solid curves) for the indicated crystal planes of the PET film with λ=4×4 (biaxial stretching) [12].](/document/doi/10.1515/pac-2017-0801/asset/graphic/j_pac-2017-0801_fig_007.jpg)
The observed orientation functions of 2πqj(cosθj) (open circles) and the recalculated functions (solid curves) for the indicated crystal planes of the PET film with λ=4×4 (biaxial stretching) [12].
![Fig. 8: The observed orientation functions of 2πqj(cosθj) (open circles) and the recalculated functions (solid curves) for the superposed crystal planes of the PET film with λ=4×4 (biaxial stretching) [12].](/document/doi/10.1515/pac-2017-0801/asset/graphic/j_pac-2017-0801_fig_008.jpg)
The observed orientation functions of 2πqj(cosθj) (open circles) and the recalculated functions (solid curves) for the superposed crystal planes of the PET film with λ=4×4 (biaxial stretching) [12].
Judging from the positions of many diffraction peaks from PET films located in the ranges of 2θB from 10 to 55°, the evaluation for correct profile of 2πqj(cosθj) by using the X-ray instrument with the θ–2θ scanning at the individual θj is much more difficult in comparison with the evaluation for the PE film.
The solid curves of 2πqj(cosθj) in Figs. 7 and 8 are the results recalculated from ω(θ, η). In Fig. 7, it is evident that good agreement between observed and recalculated functions for 2πqj(cosθj) was achieved, even for the less accurately crystal planes with weak diffraction intensity. The functions 2πqj(cosθj) for overlapped peaks in Fig. 8 provide fairly good agreement between observed and recalculated functions.
In preliminary experiment, the series expansion up to ℓ=14 is confirmed to be enough to realize good fitting between experimental and recalculated results for 2πqj(cosθj) as shown in Figs. 7 and 8. To do so, the jth orientation factors
Incidentally, the number of crystal planes used for calculating ω(θ, η) is 9 (see Fig. 4) for the PE film because of an orthorhombic crystal unit with high symmetry.
Returning to Fig. 6b, the contour map ω(θ, η) is very complicated because of no symmetry of a triclinic crystal unit [12]. Different from symmetry at η, −η+π, η+π and −η for an orthorhombic unit like PE, there is no symmetry for a triclinic unit like PET. The maximum population appears at around θ=85° and η=0°, indicating that the most probable orientation of crystallites deviates 5° from the film surface. Such orientation is different from the analysis that the c-axes and benzene rings are oriented predominantly parallel to the film surface. Strictly, the orientation of the c-axes is not parallel predominantly to the film surface, since the real chain axis is tilted at ca. 5° with respect to the U3-axis.
The orientation functions of the a-, b- and c-axes in addition to c*-axis corresponding to the U3 axis can be determined by substituting the values of Θj and Φj for the individual axes into Eq. (11) and subsequently by using Eq. (9) [12].
Figure 9 shows the results. The functions of the c-axis, the c*-axis and the b-axes show the similar orientation with respect to the stretching direction. The function of the c*-axis can be obtained by the integration of ω(θ, η) by η. The functions of the b-,c- and c*-axes have two peaks, a large peak at θj=90° and a small peak at θj=0° indicating two different orientation modes of crystallites. The individual large peaks at θj=90° predict the preferential orientation of benzene rings parallel to the film surface. This is usual case. On the other hand, the individual small peaks at θj=0° indicate the preferential orientation of the b-, c- and c*-axes (perpendicular to the film surface), although such unusual probability distribution is fewer. The orientation of the a-axis shows a very complicated curve having three peaks. The peak at θj=0° supports the orientation of benzene rings parallel to the film surface, while the rest two peaks at θj=35° and 90° remain unresolved problems. This is probably thought to be attributed to each unresolved peak for the c-axis and the b-axis appeared at θj=0°. Even so, such strange behavior must be considered to be reasonable because of the good fittings of 2πqj(cosθj) between experimental and recalculated results in Figs. 7 and 8.
![Fig. 9: Orientation distribution functions of the a-, b- and c-axes in addition to the c*-axis (corresponding to the U3 axis) of the PET film with λ=4×4 (biaxial stretching) [12]. (a) Orientation distribution function of the a-, b- and c-axes; (b) orientation distribution function of the c- and c*-axes.](/document/doi/10.1515/pac-2017-0801/asset/graphic/j_pac-2017-0801_fig_009.jpg)
Orientation distribution functions of the a-, b- and c-axes in addition to the c*-axis (corresponding to the U3 axis) of the PET film with λ=4×4 (biaxial stretching) [12]. (a) Orientation distribution function of the a-, b- and c-axes; (b) orientation distribution function of the c- and c*-axes.
As repeated several times, such important information provided by the θ–2θ scanning cannot be obtained by the digital display of the number of X-ray photons detected on the imaging plate of the recent X-ray instrument.
Controversial defect for evaluating for most probable distance between adjacent amorphous molecular chains taking preferred orientation with respect to the reference axis of the fiber or film
In this part, the first warning for “a simultaneous SAXS and WAXD measuring instrument” is the difficulty in evaluating most probable distance between adjacent amorphous chains with preferential orientation parallel to the film surface because of two factors. The one is the difficulty in measuring the scattered intensity from amorphous chains existed in the angle range between 0 and θB, as discussed for the crystal plane already. This is due to the geometrical problem similar to crystal planes. The second is the subtraction of incoherent scattering from experimental intensity [1], [16]. The discussion is concentrated on the second.
Let’s consider incoherent scattering. When X-ray incident beam with wavelength λo collide with stationary electrons in an atom, X-ray beam with λ, which is longer than λo, is scattered. As an approximation, the following relationship can be obtained (unit: nm).
where
h (Planck’s constant)=6.626×10⁻²⁷ (erg·s)
me (stationary electron mass)=9.109×10⁻²⁶ (g)
c (velocity of light)=2.998×10¹⁰ (cm/s).
The constant λc for incoherent (inelastic) scattering is termed as Compton wavelength. The characteristics are attributed to three points. The incoherent scattered intensity tends to be higher, when (1) the wavelength of X-ray incident is shorter, (2) scattering angle θ is wider, and (3) atomic number becomes lower.
For amorphous polymer solid, intensity distribution as a function of 2θ for Cu target has generally three peaks at least because of ordering of adjacent amorphous chains as shown in Fig. 10, in which frames (a) and (b) show the intensity distribution for PE. Frame (a) indicates X-ray scattering from the amorphous film with no crystal phase prepared by self-heating (Joule heat) under electric field [17], in which experimental curve is obtained after corrections for air scattering, background noise, polarization and absorption. The first, second and third peaks appeared at 2θ=18.5, 43.4 and 78.9°, respectively. The appearance of the second and third peaks indicates the ordered arrangement of adjacent amorphous chains locally in the undrawn film. The curve could not be obtained beyond 120°, because θ=60° was the limit rotation of sample stage on goniometer under the θ–2θ scanning mode.
![Fig. 10: (a): Process to obtain coherent intensity. (b): I′(s) vs. s curve of undrawn amorphous PE [17]. (c): I′(s) vs. s curve of undrawn amorphous PET [18]. (d): I′(s) vs. s curve of undrawn amorphous PPEK [18], where s=h/4π.](/document/doi/10.1515/pac-2017-0801/asset/graphic/j_pac-2017-0801_fig_010.jpg)
Frankly speaking, the measurement of intensity distribution I(2θ) up to 180° was indispensable to obtain smooth radial distribution function. As shown in frame (a), the experimental curve is almost flat in 2θ range from 100° to 120° indicating that the intensity >100° is attributed to intensity independent of ordering amorphous chains. Here it may be noticed that the coherent intensity tends to level off at 2θ>120° and then the profile of incoherent intensity is determined on the basis of the postulation that the coherent intensity at 2θ=180° is equal to that at 2θ=0° and the incoherent intensity at 2θ=180° is equal to the difference between supposition intensity and coherent intensity [17], [18].
The scattered intensity from elements is given by the electron density distribution P(r) as a function of distance r between the elements. The coherent intensity by the above method as a function of 2θ is represented by I′(4πs)(=I(4πs)/Io−1) generally as a well-known profile in frame (b), in which h is given by 4πsinθ/λ(=4πs). This relation is given by Eq. (15) or (16).
and
where Ie is the scattered intensity from one electron and ⟨F⟩ is the structural amplitude of one element with N electrons and Io=IeN⟨F⟩2.
The I′(s) vs. s obtained by same treatment as PE was shown in frames (c) and (d) for the amorphous PET and poly(phthalazinone ether ketone) (PPEK) films, respectively [15].
Here it should be noticed that the scanning angle θ=60° by Cu target corresponds to θ=23.5° by Mo target, since the wavelengths (λ) of X-ray beam generated from Cu and Mo targets are 0.1542 and 0.07107 nm, respectively. Certainly, Mo target is better than Cu target to obtain accuracy of the experimental intensity I(h) for evaluating the radial distribution function, since I(h) up to 180° can be measured directly without the suppuration intensity shown in Fig. 10a. Even for Mo target, however, the very wide width of imaging plate for the recent X-ray instrument is needed and the fine treatment shown in Fig. 10a is impossible.
The radial distribution function P(r) for a random orientation system can be given by
Figure 11 shows radial distribution functions of the amorphous PE, PET and PPEK films. The functions are important to evaluate the most probable distance between adjacent amorphous chains corresponding to the existence probability of electron density. As discussed elsewhere [18], the average distances obtained for the PET and PPEK at room temperature are reasonable in relation to their bulky structure of a monomer unit. On the other hand, the average distance between amorphous PE chains maintained at 110°C by Joule heat under electric field [17] is wider than the distances about amorphous PET and PPEK chains at room temperature.
![Fig. 11: Radial distribution function of (a) undrawn PE [17], (b) PET [18], (c) PPEK [18].](/document/doi/10.1515/pac-2017-0801/asset/graphic/j_pac-2017-0801_fig_011.jpg)
As for the oriented amorphous chains, most of the evaluations have been done by using the orientation function of amorphous chains as a function of angle between the main chain axis and stretching axis (or film normal direction) [9], [10] similar to 2πqj(cosθj) which has been adopted for the crystal plane. The crucial difference of orientation modes between amorphous chain and crystallites is due to the fact that the most probable distance between adjacent oriented amorphous main chains is dependent upon the orientation degree of the amorphous chains with respect to the fiber axis (the X3 axis) representing as a model in Fig. 12.
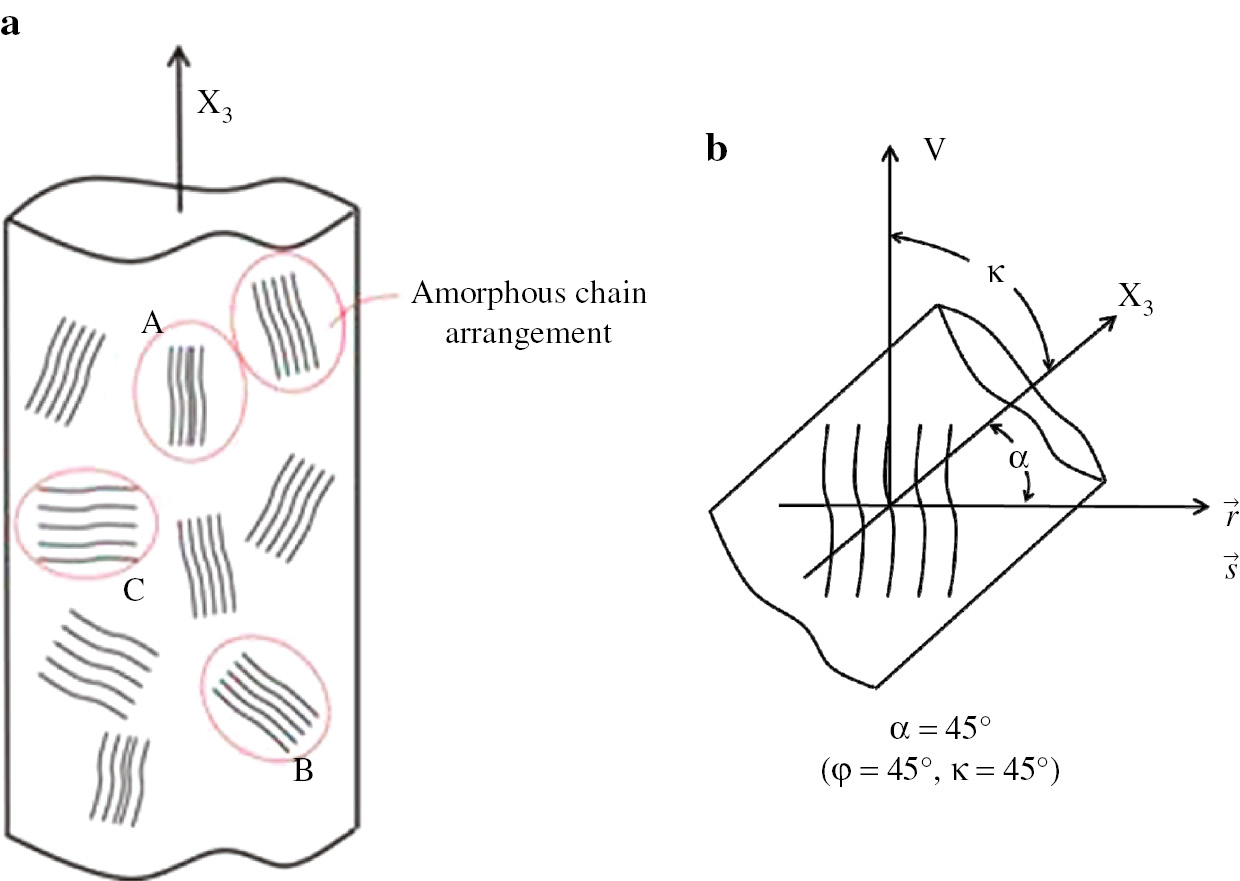
(a) Orientation modes of amorphous chains existed in the different directions with respect to the spinning fiber direction. (b) The distance between adjacent chains oriented at 45° with respect to the fiber axis (the X3 axis) can be evaluated by scattered intensity in the horizontal direction.
As a well-known fact, the lattice constants of crystal unit for most of crystallite polymers provide their intrinsic values independent of orientation of crystallites in the elongation direction of material under no external stress at room temperature. Hence orientation modes of crystallites by uniaxial or biaxial stretching can be evaluated according to the intrinsic distance between established crystal planes relating to the different shapes of the crystal unit such as orthorhombic [6], [7], [8], monoclinic [8], [10], triclinic [11], [12] etc. That is, the lattice distance in the crystal unit is independent of the crystallite orientation in the sample after stress relaxation because of strong Van der Waals force and/or hydrogen bonds in the crystal unit. On the other hand, the amorphous chains with different orientation directions in bulk, which are attributed to the compression and expansion modes, provide different distances between their adjacent chains because of weak inter-chain force. Such oriented mode cannot be represented by usual radial distribution function P(r) for an isotropic system [18].
The θ–2θ scanning discussed already must be adopted to evaluate such complicated orientation mode for amorphous chains in Fig. 12. To persuade it, the general representation of X-ray scattering system for imaging plate is shown in Fig. 13a. The intensity depends on the OP distance. Therefore, the distance correction must be done in addition to the corrections for air scattering, absorption, polarization factor and inelastic scattering. Such complicated treatments cannot be done by the recent X-ray instrument. The coherent scattered intensity after the corrections must be evaluated by the classical X-ray instrument with the θ–2θ scanning.
![Fig. 13: (a) Geometrical representation of X-ray scattering coordinate, in which 2θ is the angle providing amorphous halo peak; (b) Geometrical arrangement to calculate the two-dimensional radial distribution function of oriented PPEK amorphous chains, in which κ is the tilting angle of fiber direction with respect to the vertical direction (the V axis) and α is the angle between the vector r perpendicular to adjacent amorphous chain arrangement (see Fig. 12) and fiber axis (the X3 axis) [18].](/document/doi/10.1515/pac-2017-0801/asset/graphic/j_pac-2017-0801_fig_013.jpg)
(a) Geometrical representation of X-ray scattering coordinate, in which 2θ is the angle providing amorphous halo peak; (b) Geometrical arrangement to calculate the two-dimensional radial distribution function of oriented PPEK amorphous chains, in which κ is the tilting angle of fiber direction with respect to the vertical direction (the V axis) and α is the angle between the vector r perpendicular to adjacent amorphous chain arrangement (see Fig. 12) and fiber axis (the X3 axis) [18].
To simplify the corrections discussed above, it is important to satisfy two conditions: (1) sample tilting with respect to the vertical reference axis V in Fig. 13b to detect the scattered intensity in the horizontal direction (μ=90°) and (2) the simultaneous θ–2θ scanning of sample and detector as shown in Fig. 2d.
The geometrical arrangement in Fig. 13a indicates that for the uniaxial orientation system with respect to the X3 axis, the amorphous halo provides two broad symmetrical arcs with intensity maximum at μ=90°. Except at μ=90°, the complicated intensity correction must be done for the optical length OP and the absorption coefficient. The intensity corrections concerning the irradiation volume and air scattering have been done by internal memory in the recent X-ray instrument. The fine correction for absorption, however, cannot be done by the Beer Lanbert except at μ=90° as descried elsewhere [1], since the imaging plate detects the inclined scattered beam. Furthermore, correction for incoherent scattering is almost impossible.
On the other hand, the corrections for the θ–2θ scanning instrument are possible at individual κ (corresponding to θj) denoting tilting angle of fiber direction with respect to the vertical direction (the V axis). The evaluation can be done by using the same treatment as random system. Namely, the difficulty in evaluating incoherent scattering by using imaging plate can overcome by evaluating X-ray scattered intensity using the θ–2θ scanning.
To obtain most probable possibility of adjacent amorphous chain distance with the model in Fig. 12, the radial distribution can be expanded as follows:
In Eq. (18), h(=4πsinθ/λ) was replaced as s(s=h/4π) in actual calculation. I′(h, κ) at tilting angle κ with respect to the fiber axis is the scattered intensity detected in the horizontal direction (μ=90°).
Incidentally, the mutual relationship among the angles in Fig. 13b is given by [18]
Figure 14 shows the results of PPEK fibers prepared by dry spinning method [18], since PPEK is perfectly amorphous polymer which is not crystallized by elongation and thermal treatment. By the θ–2θ scanning, I′(s, κ) (or I′(s, φ)) can be obtained easily by measuring intensity at angle κ (or φ) fixed with interval 10° in the range of 0~90°, since the intensity corrections concerning air scattering, absorption coefficient and incoherent scattering at individual κ (or φ) are not complicated as like treatments shown in Fig. 10a for the undrawn PE film. The intensity height is dependent upon tilting angle κ. The κ dependence of peak magnitude indicates that the average distance between the adjacent amorphous chains is attributed to the different orientation modes as shown in Fig. 12.
![Fig. 14: I′(s)~s curves of the PPEK spinning fibers against the indicated angles κ (φ=π/2−κ) from 0° to 90° [18].](/document/doi/10.1515/pac-2017-0801/asset/graphic/j_pac-2017-0801_fig_014.jpg)
I′(s)~s curves of the PPEK spinning fibers against the indicated angles κ (φ=π/2−κ) from 0° to 90° [18].
Incidentally, φ must be 90° at κ=0° and the vector r associated with the adjacent chain distance direction must exist on the horizontal plane (α=90°) in order to detect scattered X-ray beam by horizontal scanning of scintillation counter.
Based on the geometrical coordinate in Fig. 13b, the contour map of the two-dimensional radial distribution function Q(r, α) can be obtained by using the results for I′(s)~s shown in Fig. 14 [18]. The slightly complicated mathematical treatments are as follows:
where
and
where J2n(x) is Bessel function.
Figure 15 shows the contour map of Q(r, α) for PPEK spinning fibers with low chain orientation
![Fig. 15: Contour map Q(r, α) of the radial distribution function associated with electron density distribution for a PPEK fiber (0.1×r nm) [18].](/document/doi/10.1515/pac-2017-0801/asset/graphic/j_pac-2017-0801_fig_015.jpg)
Contour map Q(r, α) of the radial distribution function associated with electron density distribution for a PPEK fiber (0.1×r nm) [18].
The most probable distance r between adjacent chains is 0.486 nm at α=0° (φ=0°, κ=90°) for chains oriented perpendicular to the spinning fiber direction because of tension under dry spinning, while r at α=90° (φ=90°, κ=0°) is 0.473 nm associated with chains oriented parallel to the spinning fiber direction because of the compression. In the map, each inflection point of contour lines almost corresponds to the average distance r [18]. Anyway, this paper emphasizes that such detailed analysis can be realized only by using the θ–2θ scanning instrument.
Minor defect of SAXS intensity distribution by the recent X-ray instrument
As repeated already, the recent X-ray instrument is much more useful to measure SAXS intensity distribution because of high luminance beam. The profile with some peaks can be obtained clearly by the digital display of the number of photons detected on the imaging plate, since the optical length beyond 3 m can be adopted.
Here a problem of SAXS pattern shall be pointed out by using PE lamellae stacked on the surface of a dry gel film prepared by gelation/crystallization from solution. The c-axes are oriented predominantly perpendicular to the film surface and the lamellae are oriented predominantly parallel to the film surface [14], [19]. The model and the pattern observed by the recent X-ray instrument are shown in Fig. 16a and b, respectively. In the model, the X3 axis is along the film normal direction and 2θB is the scattering angle of the peak. The arcs up to the third scattering peaks appear on the upper and lower sides in the vertical direction. The identity period Lp different from lamellar length L is evaluated as follows:
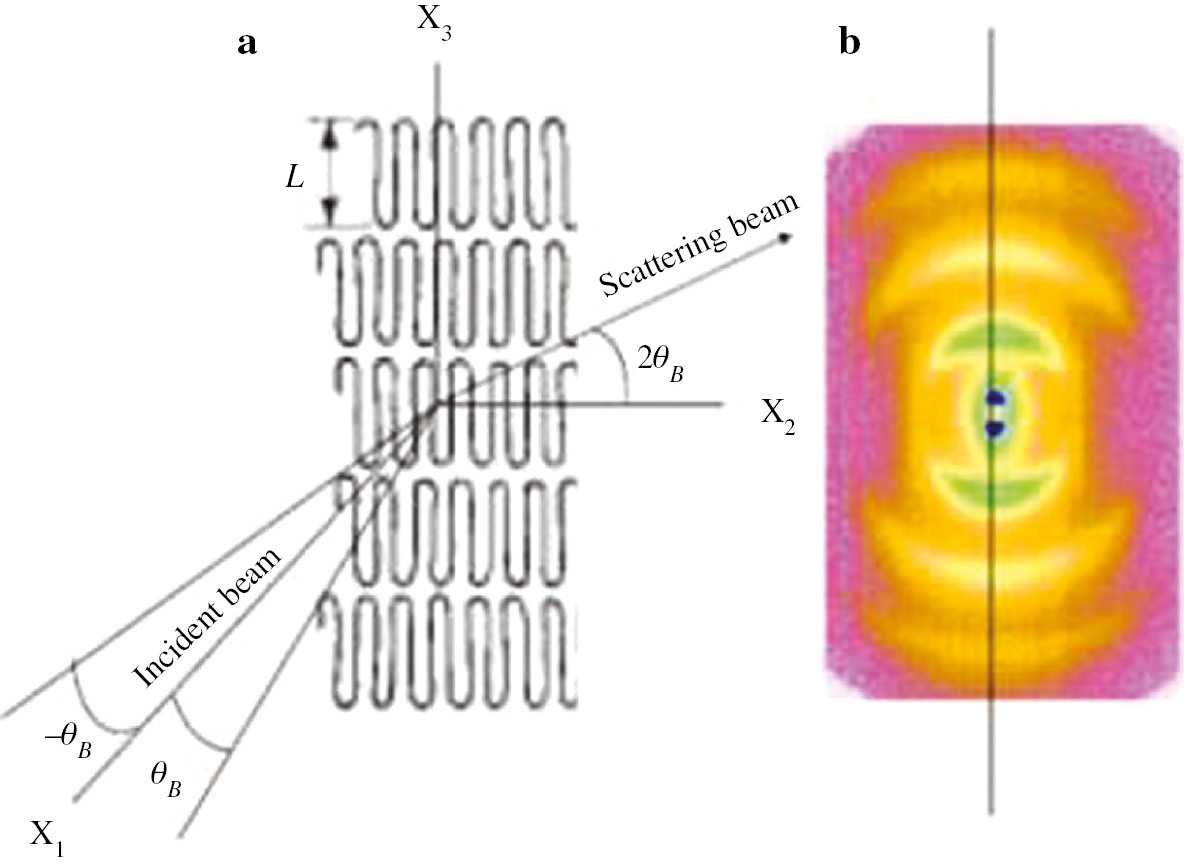
(a) A model for SAXS scattered intensity from lamellae stacked parallel to the film surface predominantly, in which the X3 axis is along the film normal direction. (b) SAXS scattering pattern from the stacked PE lamellae measured by the recent X-ray instrument.
Strictly speaking, the peaks do not reflect contribution from lamellae oriented parallel to the film surface perfectly. In relation to the model, Eq. (23) indicates that lamellar surface roughly corresponds to crystal plane, and then the scattering from lamellae existed in the angle range between −θB~θB cannot be detected. This is the same concept as WAXD. Even so, the scattered intensity obtained by the digital display of the number of X-ray photons detected on the imaging plate is almost correct. For polymer films, high order peaks appear at small scattering angle 2θB<5° mostly. This indicates that lamellae existed in the range of ±2.5° with respect to the film surface are not many as a whole. The relationship between scattering peak and long period was described elsewhere on the basis of the concept that the electron density fluctuation must be evaluated on the average density ρ̅ of the specimen, in which the transition region between crystal and amorphous is introduced [20], [21].
In spite of the controversial defects for the recent instrument termed as “a simultaneous SAXS and WAXD measuring instrument”, it must be emphasized that the instrument has surely great advantage to evaluate SAXS intensity from large domains with high order arrangement by detecting many high order scattering peaks as well as to evaluate a single crystal powders. This is due to high brightness of X-ray beam. Also X-ray beam with high brightness assures the measurement by point focus which can be used without slit correction.
Conclusions
The present paper is a short practical part for X-ray diffraction and scattering on a course taught (MS program) by the authors. The focus is concentrated on the controversial defect of recent X-ray instrument termed as “a simultaneous SAXS and WAXD measuring instrument”. Certainly, the instrument can generate X-ray beam with high luminance but two problems concerning the geometrical optical system are arisen. (1) The sample stage and detected position are fixed and (2) the intensities for SAXS and WAXD are measured by the digital display of the number of X-ray photons detected on the imaging plate. The optical system is different from the former (classical) X-ray instrument which has been used commonly for WAXD and SAXS whose X-ray beams can be generated along the opposite directions from one common source. For the well-known former instrument, the sample stage and detected counter for WAXD measurements can be rotated simultaneously with relationship termed as the θ–2θ scanning in the horizontal direction and the diffraction peaks from individual crystal planes existed in the horizontal direction can be detected, when the existence of individual crystal planes satisfy the Bragg equation.
The defect of the recent X-ray instrument is based on the concept that the diffraction intensity from crystal plane existed in the angle range between incident beam and Bragg angle cannot be measured geometrically by the digital display of the number of X-ray photons detected on the imaging plate, in the case where characteristic crystal planes are highly oriented parallel to the film surface. The recent instrument can evaluate precisely the orientation of crystallites only in the fiber where the c-axes orient randomly around the fiber axis.
Further unfavorable points are the difficulty in subtracting incoherent intensity from measured intensity distribution to obtain real intensity and the difficulty in evaluating the fine azimuthal angle dependence of diffraction intensity.
Of course, the recent X-ray instrument with high luminance beam is important for SAXS intensity because of long optical length beyond 3 m. This is due to the advantage to detect scattering peaks in the small angle scattering range. In SAXS, the scattering from lamellae oriented almost parallel to film surface can be analyzed because of few lamellae existed in the undetected small angle range (−θB~θB) as a whole.
Article note:
A collection of invited papers based on presentations at the 25th POLYCHAR 2017 World Forum on Advanced Materials Kuala Lumpur, Malaysia, October 9–13, 2017.
References
[1] B. D. Cullity. Elements of X-ray Diffraction, Addition –Wesley Publishing Company, Inc., Reading (1956).Search in Google Scholar
[2] U. W. Gedde. Polymer Physics. Springer-Kluwer, Dordrecht-Boston (2001).Search in Google Scholar
[3] W. Brostow, H. E. H. Lobland. Materials: Introduction and Applications, John Wiley and Sons, New York (2017).Search in Google Scholar
[4] W. R. Krigbaum, R. J. Roe. J. Chem. Phys.41, 737 (1964).10.1063/1.1725954Search in Google Scholar
[5] R. J. Roe. J. Appl. Phys.36, 2024 (1965).10.1063/1.1714396Search in Google Scholar
[6] K. Fujita, S. Suehiro, S. Nomura, H. Kawai. Polym. J.14, 545 (1982).10.1295/polymj.14.545Search in Google Scholar
[7] M. Matsuo, C. Xu. Polymer38, 4311 (1997).10.1016/S0032-3861(96)01026-9Search in Google Scholar
[8] Y. Bin, A. Koganemaru, T. Nakashima, M. Matsuo. Polym. J.37, 192 (2005).10.1295/polymj.37.192Search in Google Scholar
[9] M. Matsuo, C. Sawatari, Y. Iwai, F. Ozaki. Macromolecules23, 3266 (1990).10.1021/ma00215a012Search in Google Scholar
[10] M. Matsuo, R. Sato, Y. Shimizu. Colloid. Polym. Sci.271, 11 (1993).10.1007/BF00652298Search in Google Scholar
[11] M. Matsuo, R. Adachi, A. Xiaowen Jiang, Y. Bin. Macromolecules37, 1324 (2004).10.1021/ma030347xSearch in Google Scholar
[12] Y. Bin, K. Oishi, K. Yoshida, T. Nakashima, M. Matsuo. Polym. J.36, 394 (2004).10.1295/polymj.36.394Search in Google Scholar
[13] M. Matsuo. J. Mater. Ed. 33, 213 (2011).Search in Google Scholar
[14] M. Matsuo, C. Sawatari, M. Iida, M. Yoneda. Polym. J.17, 1197 (1985).10.1295/polymj.17.1197Search in Google Scholar
[15] W. Spendley, G. R. Hext, F. R. Himsworth. Technometrics4, 441 (1962).10.1080/00401706.1962.10490033Search in Google Scholar
[16] W. Schuelke. Electron Dynamics by Inelastic X-Ray Scattering, Oxford University, Oxford (2007).10.1093/oso/9780198510178.001.0001Search in Google Scholar
[17] R. Zhang, Y. Bin, W. Yang, S. Fan, M. Matsuo. J. Phys. Chem. B118, 2226 (2014).10.1021/jp4112734Search in Google Scholar PubMed
[18] W. Yang, Y. Bin, Y. Yuan, M. Matsuo. Polymer103, 112 (2016).10.1016/j.polymer.2016.09.029Search in Google Scholar
[19] X. Shi, Y. Bin, D. Hou, Y. Men, M. Matsuo. Polym. J.46, 21 (2014).10.1038/pj.2013.66Search in Google Scholar
[20] M. Matsuo, C. Sawatari, M. Tsuji, R. S. Manley. J. Chem. Soc. Faraday Trans. 2, 79, 1593 (1983).10.1039/f29837901593Search in Google Scholar
[21] M. Matsuo, C. Kitayama. Polym. J. 17, 479 (1985).10.1295/polymj.17.479Search in Google Scholar
©2018 IUPAC & De Gruyter. This work is licensed under a Creative Commons Attribution-NonCommercial-NoDerivatives 4.0 International License. For more information, please visit: http://creativecommons.org/licenses/by-nc-nd/4.0/
Articles in the same Issue
- Frontmatter
- In this issue
- Preface
- 25th World Forum on Advanced Materials (POLYCHAR-25)
- Conference papers
- Characterization of polymer electrolytes by dielectric response using electrochemical impedance spectroscopy
- Determination of thermodynamic and structural quantities of polymers by scattering techniques
- Education program for controversial defect of recent X-ray instrument termed as a simultaneous small angle X-ray scattering and wide angle X-ray diffraction measuring instrument
- Synthesis and ionic conductivity of siloxane based polymer electrolytes with pendant propyl acetoacetate groups
- Composites containing bamboo with different binders
- Direct determination of poly(3-hydroxybutyrate) accumulated in bacteria by thermally assisted hydrolysis and methylation-gas chromatography in the presence of organic alkali
- Synthesis, characterization and cellulose dissolution capabilities of ammonium-based room temperature ionic liquids (RTILs)
- Conversion of glucose into lactic acid using silica-supported zinc oxide as solid acid catalyst
- Enzymatic preparation of functional polysaccharide hydrogels by phosphorylase catalysis
- An ideal enzyme immobilization carrier: a hierarchically porous cellulose monolith fabricated by phase separation method
- Functionalized and engineered nanochannels for gas separation
- Development of resistant corn starch for use as an oral colon-specific nanoparticulate drug carrier
- Aggregation kinetics of irreversible patches coupled with reversible isotropic interaction leading to chains, bundles and globules