Use of Raman spectroscopy for continuous monitoring and control of lignocellulosic biorefinery processes
-
Shannon Ewanick
 and
Renata Bura
and
Renata Bura

Abstract
The production of fuels and chemicals from lignocellulosic biomass demands efficient processes to compete with fossil fuel-derived products. Key biorefinery processes, such as enzymatic hydrolysis of cellulose and microbial fermentation, can be monitored by advanced sensors in real time, providing information about reactant and product concentration, contamination, and reaction progress. Spectroscopic techniques such as Raman spectroscopy provide a means of quickly and accurately assessing many types of reaction mixtures non-destructively, in real time, and with no costly sample preparation and analysis time. Raman spectroscopy techniques have been developed to accurately quantify a number of compounds present in lignocellulosic processes, and methods have been developed to overcome the presence of fluorescent compounds that can increase the spectral background. Online Raman sensors also can provide the feedback measurements necessary for advanced process controls (APCs). Specifically, model predictive control, a common APC used extensively throughout similar processing industries, is especially well suited for ensuring optimal production of bio-based chemicals from lignocellulosic material.
Introduction
The production of fuels and chemicals from biomass is a rapidly growing industry as the economic and environmental effects of global warming are felt around the world. Biofuel and bio-based chemical production processes must become more efficient to be competitive with the equivalent processes using fossil fuels. Processes to produce fuels and chemicals from petroleum have a wealth of online analytical sensors that permit them to operate at or near capacity with optimal process yields. This hyper efficiency is a necessary condition for profitability in producing high volume, narrow-profit margin products such as fuels and commodity chemicals. The need for process efficiency – and hence the need for online sensors – is especially acute in biomass fed biorefineries due to the complexity and expense of the feedstock. Development of robust sensors for lignocellulosic biorefineries is as critical as the research for developing the processes themselves, but has received little or no attention. Process improvements (feedstock pretreatment, microorganisms, enzymes, etc.) will likely reduce costs in the future, but in both the short and long term, improving the efficiency of existing operations will have the greatest effect on overall process economics.
A multitude of products can be produced from lignocellulosic biomass such as wood, agricultural residues and waste products; such products include biofuels, biochemicals and chemical precursors to polymers and other molecules. The challenge in using lignocellulosic, rather than starch or sucrose based biomass, to produce fuels and chemicals lies in their structure, which is much more resistant to breakdown by low energy methods. They require relatively intense pretreatment methods to break down the cell wall and expose and release the sugars contained within. Pretreatment methods can be chemical (acidic, basic or solvent), thermochemical, or physical in nature [1]. Regardless, the goal of any pretreatment method is to release sugars in hydrolysable and/or fermentable form. The most commonly used pretreatments are thermochemical and utilize acid, producing a liquid stream containing not only fermentable, monomeric sugars, but also lignin and a variety of other sugar and lignin degradation products. The accompanying solid stream contains predominantly lignin and the polymer cellulose, which must be enzymatically or chemically hydrolysed to monosaccharides before fermentation. Once monosaccharides have been released, they can be fermented by a variety of microorganisms to generate the desired final product. Most commonly, Saccharomyces cerevisiae is used to convert hexoses to ethanol, but other organisms have been used to produce xylitol, acetic acid, butyric acid and many other products [2–5].
The Raman effect was discovered in 1928 and is observed upon irradiating solid, liquid or gaseous samples with monochromatic light and measuring the inelastic scattering that is exhibited by 10–6 of the incident photons [6]. Unlike similar spectroscopic methods such as near infrared (NIR), water is virtually invisible to Raman which allows its use in aqueous solutions [7]. In addition, Raman spectra have narrower peak widths and cover a wide spectral range, improving the potential for analyzing complex matrices of compounds [8]. Benefits of using a spectroscopic method are its speed, lack of sample preparation, and ability to scale from micro scale up to production scale. The diversity of compounds present in lignocellulosic processes calls for an analytical method that can simultaneously measure multiple compounds with high sensitivity at both high and low concentrations. Other methods such as HPLC, UV-Vis spectroscopy, capillary electrophoresis, gas chromatography/mass spectrometry and electrochemical methods are unable to quantify multiple compounds simultaneously and/or require destructive and time-consuming sample preparation and analysis [8].
One of the main setbacks of utilizing advanced process control (APC) in bioprocesses has been the lack of suitable in vitro measurement technology. With the development of chemometric methods and Raman technology, we now are at a point where this paradigm could change. Implementation of APC technologies can increase profit margins through increases in throughput, process stability improvement, energy consumption reduction, process safety and regulation, and increased yield of valuable products. This has already been seen for decades in similar industries such as in refining, petrochemical, and pulp and paper. Using online Raman measurements of key process parameters will allow for the development of more robust system models, which in turn can be used for prediction and optimization. Control methods, such as model predictive control, use these prediction models to ensure regulation at an optimal setpoint.
Application of Raman to continuous, online measurements
The primary advantages of using Raman, or other spectroscopic methods, over traditional analysis methods are increased speed of analysis and a reduction in user interaction. With online Raman spectroscopy, a full spectrum can be collected in less than a minute to provide immediate data regarding the concentration of any compounds of interest, once appropriate models have been developed. This real-time, continuous output of information enables application of advanced process controls. While the use of Raman spectroscopy as an analytical technique is widely used in other disciplines, its application for continuous monitoring of fermentation of lignocellulosics is still being developed. Small scale ethanol fermentations have been measured by Raman spectroscopy through periodic removal and measurement of samples [9], and continuous monitoring of nano-scale reactions with in situ measurement [10] has been conducted.
The method used for sample collection is an important consideration both for building a robust process sensor and for improving the quality of data. Following excitation with a laser beam, the Raman scattered light is filtered and collected on a detector. A Raman microscope or immersion probe can be used to measure individual samples, or to continuously monitor a reaction by pumping the reaction mixture through a sampling loop. A probe can also be immersed in the reaction solution to enable continuous remote sampling. Such probes are typically composed of a fiber optic portion connected to a stainless steel probe fitted with a window at the tip. Compared to a standard probe with a flat window, the use of a sapphire-tipped hemispherical ball probe tip reduces the focal length and increases the number of Raman events that can be measured [11]. In reactions subject to high levels of fluorescent interference, the reduced focal length results in less noise and higher quality data.
Challenges of using Raman to measure lignocellulosic bioprocesses
While Raman spectroscopy has the distinct advantage of being practical in aqueous solutions, it is subject to interference by other means. Such interference falls into two categories – biological and chemical. Both cause an elevated spectral background signal that can mask the desired Raman features of the spectra representing the compounds of interest. Biological interference is present in any system containing living cells, and results from the heterogeneous nature of biological systems. The second means of interference is the influence of compounds present in the media, even in the absence of any cells. In lignocellulosic fermentations, these are often represented by lignin-derived compounds. Lignin is made up of highly conjugated phenolic groups that fluoresce when excited by the laser [12]. In addition to process interference, measurement noise caused by instrumentation, background light sources, and cosmic rays must also be filtered before deducing the true spectra. Figure 1 shows how typical Raman spectra and its constituent components are broken down.
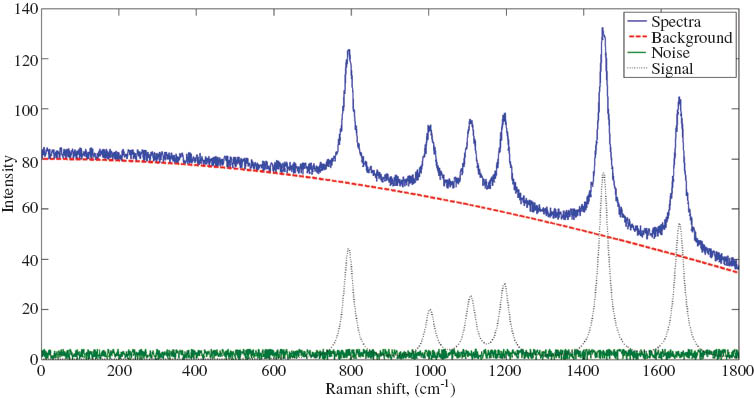
Components of simulated Raman spectra. The Spectra = Signal + Background + Noise. The goal is to reduce the spectra to its true signal.
The impact of this background interference can be minimized in a number of ways. Cells can be physically removed from the media prior to measurement by means of a filter [9] and chemical interference can be minimized by using low fluorescence medium [10]. Alternatively, many different chemometric methods have been developed to mathematically remove the fluorescent background and noise from the collected spectra and reveal the spectral components of the compounds of interest [13, 14]. In addition, the choice of excitation wavelength is important. In solutions without the presence of fluorophores, lower wavelength visible light such as 514 nm provides high sensitivity but greatly increased fluorescence [10, 15]. Higher wavelength, near-IR excitation, may be used to minimize fluorescence, but at the expense of peak intensity. For lignocellulosics, 785 nm wavelength is most often utilized [8, 16, 17], but 993 nm and 1064 nm have also been used to further reduce the fluorescent background [18, 19].
Quantification of Raman data
Robust models must be constructed to use the large amounts of spectral data generated in a given process and to convert Raman signal intensities into units of concentration. Unlike chromatographic methods, any compound measured by Raman can present multiple peaks, many of them overlapping. In addition, some compounds are strong scatterers, presenting high intensity peaks, while others scatter weakly. Ethanol, for example, presents a strong, well-isolated C-C bond stretching peak at 883 cm–1. This single peak allows for univariate analysis of ethanol by measuring the peak area of a number of samples and comparing the areas to the concentration of the same samples measured by a validation method such as HPLC [19]. This calibration model is then validated by predicting the concentration of a second set of spectra, and comparing the predicted values to the actual values. For weaker scatterers or complex mixtures of samples with overlapping peaks, multivariate methods must be employed. Similarly, in the presence of a high background, even strong scattering compounds at low concentrations may require multivariate analysis [8]. Typically these models are constructed using partial least squares (PLS) methods.
The goal of PLS is to predict a set of dependent variables, Y, from a set of independent variables, X. In the case of developing a model for Raman spectra for lignocellulosics, the independent variables are the Raman spectra and the dependent variables are concentration of substrates and products usually measured on an HPLC. A PLS algorithm is then implemented to simultaneously decompose these variables into scores, T and U, loadings, P and Q, and a matrix of error, E, with the goal of explaining as much as possible of the covariance between X and Y. A linear relationship is established according to:
where
Use of Raman spectroscopy to measure enzymatic hydrolysis and fermentation of sugars to ethanol
After pretreatment of lignocellulosics to break down the biomass structure, the resulting solids must be enzymatically hydrolysed to saccharify cellulose to glucose. Tightly controlling the progress of enzymatic hydrolysis is important to minimize the use of costly cellulytic enzymes. The presence of significant quantities of lignin can compromise use of Raman to monitor hydrolysis. For simple enzymatic hydrolysis of pretreated solids, chemical interference can come from lignin present on the pretreated solids; the amount of lignin present depends on the type of pretreatment used. Acid pretreatments leave a considerable amount of lignin on the pretreated solids, while up to 85% of lignin can be removed using an alkaline treatment such as aqueous ammonia [8]. Any residual lignin can leach into the enzymatic hydrolysate, increasing the Raman spectroscopic limit of detection from 4 g L-1 glucose in aqueous ammonia-pretreated corn stover to 20 g L–1 in the same material pretreated with dilute acid [8].
The conversion of glucose to ethanol is one of the oldest forms of fermentation and has been a widely studied application of Raman spectroscopy for continuously measuring fermentation. During fermentation with Saccharomyces cerevisiae, measurable components include ethanol, glycerol and the cell concentration, all of which can be quantified to measure productivity, stress, and process efficiency. Shaw et al. [9] used a 780 nm laser to measure the progress of a fermentation of pure glucose by continuously pumping the fermentation solution through a quartz cell in a Raman microscope. Samples were filtered through a 0.2 μm filter prior to analysis every 0.5–1 h, removing much of the background fluorescence from the cells. A multivariate PLS model developed from this fermentation was then used to predict glucose and ethanol concentrations in a different fermentation with a root mean square error of prediction (RMSEP) of 8.3% and 1.8% for glucose and ethanol, respectively [9]. Ávila et al. [20] developed a multivariate PLS model based on measurements of glucose, ethanol, glycerol and cell concentrations by 785 nm Raman taken at 15 minute intervals through a flow cell pumped continuously from the fermentation reactor without any filtration. Their model found RMSEP values of 0.5%, 0.3%, 0.02% and 1 g L–1 for glucose, ethanol, glycerol and cell concentration respectively. The limit of detection (LOD) can be calculated by doubling the RMSEP.
The use of Raman spectroscopy to follow the progress of reactions using pretreated lignocellulosic material is just beginning. Initial work by Shih and Smith [17] measured the progress of ethanol production from the enzymatic hydrolysate of both dilute acid and ammonia pretreated corn stover using S. cerevisiae by analyzing offline aliquots of the fermentation broth. In the pretreated corn stover hydrolysate, LOD’s for glucose and ethanol were determined to be 8 and 6 g L–1 respectively based on quantification of peaks at 1128 cm–1 and 883 cm–1 for glucose and ethanol respectively.
Ewanick et al. at the University of Washington continuously measured the fermentation of both pure glucose in water and a switchgrass-derived lignocellulosic hydrolysate [16]. Measurement of both reactions was accomplished by means of an immersion ball probe inserted in a fast loop circulating media continuously from the fermentation reactor, with measurements taken every minute. Both reactions required mathematical removal of the fluorescent background through use of a polynomial fitting algorithm. In the pure glucose fermentation most of the background could be attributed to the cell biomass. The background was four times greater in the lignocellulosic fermentation due to lignin-derived components of the switchgrass hydrolysate (Fig. 2). With proper signal processing, however, this additional background in the lignocellulosic fermentation only increased the glucose limit of detection (LOD) from 1 to 2 g L–1 and the ethanol LOD from 0.8 to 1.2 g L–1. Both ethanol and glucose were modeled based on principle component analysis (PCA) of the spectrum and PLS comparison of the main spectral components to HPLC data. These results showed for the first time that Raman could successfully follow the progress of fermentation of a highly fluorescent lignocellulosic liquid stream [16]. By collecting data continuously and comparing it to HPLC, data, a model was developed with a low LOD compared to previous research.
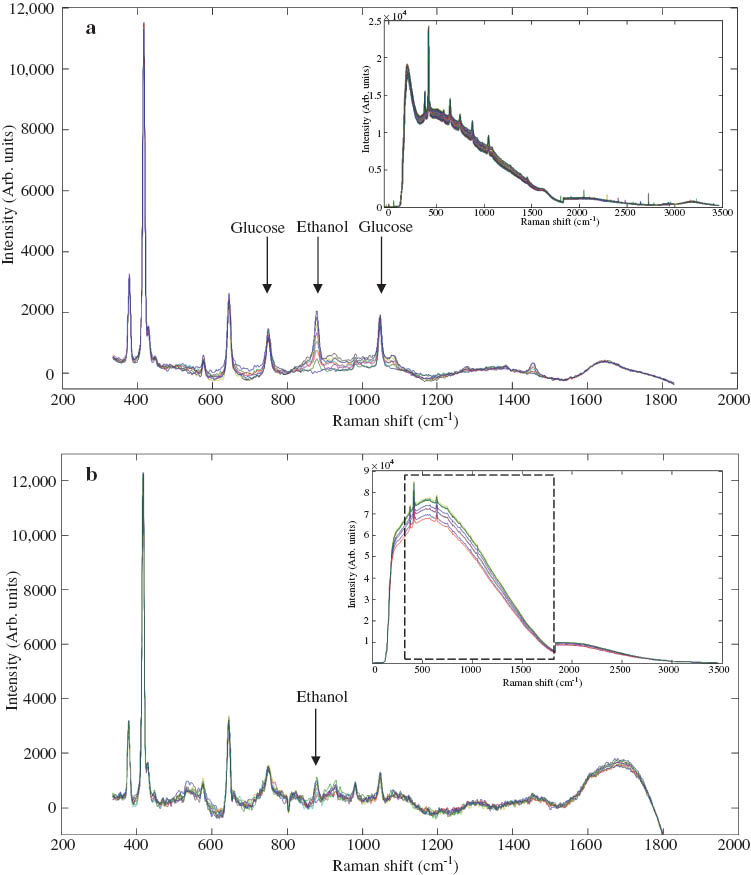
Raman spectra of pure glucose fermentation (a) and switchgrass hydrolysate (b) with the untreated spectra in the top right inset and the spectra after polynomial fitting in the main image.
Raman spectroscopy will continue to be investigated as a means to measure the progress of both enzymatic hydrolysis and fermentation. In particular, monitoring of simultaneous saccharification and fermentation (SSF) will prove highly valuable to improve the efficiency of a widely used industrial process [21]. Raman monitoring of SSF of corn mash (starch-based) has already been successfully proven and shown to be able to measure not only monomeric glucose, but oligomeric and polymeric glucose as well as ethanol [19]. Application of these techniques to lignocellulosic hydrolysis and SSF will prove more challenging, but holds the potential to reduce reaction time and cost by increasing process efficiency. Future work at the University of Washington related to Raman spectroscopic measurement of lignocellulosic biorefinery processes will focus on simultaneous quantification of multiple sugars, particularly xylose, and on alternative microbial products such as acetic acid. The use of pretreatment hydrolysates from diverse feedstocks and different pretreatment processes will introduce new combinations of fluorophores that may affect the Raman measurements and require new models and techniques to reduce the fluorescent background.
Characteristic Raman bands for fermentation of lignocellulosic components
A review of the literature regarding Raman spectroscopic methods for fermentation of bio-based substances shows common Raman bands (cm–1) can be found. Table 1 shows several common components including: ethanol, glucose, fructose, cellulose, and glycerol; for an exhaustive list of Raman bands for biological components the reader is referred to [22]. Characteristic modes were assigned for several bands depending on the component. Most researchers find a strong visible peak for ethanol at approximately 880 cm–1 representing C-C stretching. Often this peak is used to monitor the progress of fermentation, as it is a strong peak that can be easily deciphered from the data. While other peaks for ethanol, such as those at the region near 2900 cm–1 are often disregarded since most organic compounds present similar bands [23]. Similarly, glucose has a strong distinguishable peak around 1120 cm–1, which in turn can be followed. However, when dealing with multiple sugar systems there exists overlapping Raman bands from various sugars due to spectral interference between peaks making isolation difficult. For fermentation of sugars the bands between 300–1500 cm–1 are rich with structural information. Raman bands in the 920–960 cm–1 region are strong from α-1,4 glycosidic linkages in glucose oligomers and polysaccharides [19, 23]. As shown previously in Fig. 2, substrate and metabolite bands can usually be identified over time. As the fermentation progresses, the substrate is consumed and metabolites are produced showing major peaks disappearing and being formed, but generally chemometric methods are still required to deconvolute these systems into corresponding components of interest.
Common Raman bands for major constituents of lignocellulosic fermentation.
| Component | Band (cm-1) | Characteristic Mode | Source |
|---|---|---|---|
| Ethanol | |||
| 874, 879, 881, 883 | C-C stretch | [9, 10, 16, 19, 20, 24] | |
| 1030, 1040, 1054 | C-O stretch | [10, 19, 24] | |
| 1079, 1080, 1096 | CH3 rocking | [9, 10, 19, 24] | |
| 2878 | CH2 | [10, 17] | |
| 2925, 2929 | CH3 stretch | [9, 10] | |
| 2972 | CH3 stretch | [10, 17] | |
| Glucose | |||
| 437, 448, 451 | C-CO bend | [9, 8, 24] | |
| 1056, 1060, 1063 | C-O bend | [9, 24, 25] | |
| 1118, 1123, 1124, 1126, 1128 | C-C stretch | [8–10, 16, 17, 20, 24, 25] | |
| 1336, 1347 | CH2 twist | [9, 25] | |
| Fructose | |||
| 626, 629 | C-CO bend | [22, 24] | |
| 818, 821 | C-C stretch | [22, 24] | |
| 870, 872 | C-C stretch | [22, 24] | |
| 1060, 1065, 1068 | C-OH bend | [22, 24, 25] | |
| Cellulose | |||
| 896, 899 | ring stretch | [22, 26] | |
| 1098 | COC stretch | [22, 26] | |
| 1120 | COC stretch | [22, 26] | |
| Glycerol | |||
| 1049, 1055 | COH stretch | [20, 22] | |
| 1109, 1110 | COH stretch | [20, 22] | |
| 1254, 1257 | CH2 twist | [20, 22] | |
Advanced process control
The goal of process control is to keep conditions of a process at a desired or optimal value in the presence of process variations. Advanced process control (APC) extends this by handling multivariable and nonlinear systems, with constraints if necessary, while achieving real-time optimization. APC systems are common practice throughout various industries such as, petrochemical, refining, and pulp and paper. Benefits include increasing profit margins through increases in throughput, process stability improvement, energy consumption reduction and increased yield of valuable products [27]. However, the literature concerning control systems for bioreactors is relatively scarce. A review of controls for bioreactors from Rani and Rao [28], discussed various control techniques including dynamic programming, online adaptive control, online optimization, nonlinear control, and optimal control. One of the major reasons for the minimal application of APC for bioreactors is lack of reliable technology for online measurements of major chemical and biochemical concentrations [29]. Raman spectroscopy has the ability to overcome this shortcoming, by allowing for real-time measurements of major state variables such as reactant, product, and cell biomass concentration.
The type of control strategy implemented depends on the bioreactor operating mode (batch, fed-batch, continuous), availability of online measurements, and the accuracy of the bioreactor model [29]. Development of control systems that use feedback measurements from bioreactors is critical for lignocellulosic biorefineries. Over the last decade model predictive control (MPC) or receding horizon control (RHC) has become commonplace in many chemical and manufacturing industries. In 2003, it was reported that there were over 5000 applications of MPC, with majority of the applications being in refining, petrochemicals, chemicals, and pulp and paper industries [30]. More recently, an international survey of 66 APC experts, 38 APC users, and 28 APC suppliers showed that over two thirds of the respondents used MPC [27]. In the literature, the majority of the applications of MPC to fermentation systems have been based on simulation. These include both fed-batch [31, 32] and continuous [33–35] systems, all of which used some form of nonlinear MPC or neural network. Though academic research continues to develop the theory and algorithms for MPC, there exists a wealth of experience that can be applied to biorefining from related industries. By providing a mechanism for feedback, such as with Raman technology, robust output feedback MPC strategies for fermentation can be employed.
Model predictive control
The following provides a brief overview of linear MPC, for further discussion of linear MPC see [36, 37], and for nonlinear MPC [38, 39]. MPC is an online model-based control for real-time optimization of a process. A model of the plant is used to make predictions of the future behavior of the system, and then use those predictions to determine the optimal input to achieve a setpoint or regulation. It can include disturbance rejection, as well as linear or nonlinear constraints within an optimal cost function. It can handle linear or nonlinear equality or inequality constraints, multiple inputs and outputs (MIMO), and linear or nonlinear models.
Given a linear, time invariant, discrete MIMO system defined by:
where
Subject to process constraints
where, Np denotes the length of the prediction horizon, and Nm denotes the length of the control horizon (Nm ≤ Np). The weighting matrices Q and R are used to penalize setpoint tracking and manipulated input movement, respectively. The constant matrix Q is positive semi-definite (Q ≥ 0), and the matrix R is positive definite (R > 0), while the constants Np, Nm, Q, and R are tuning parameters for the MPC. The first term in eq. 6 controls the predicted system state, and the second term controls the input sequence. In eq. 7, the inequality constraint is placed on both the state and input, though in general, MPC is capable of handling both linear and nonlinear constraints. Figure 3 shows schematically how the MPC is implemented, and is described by the following algorithm:
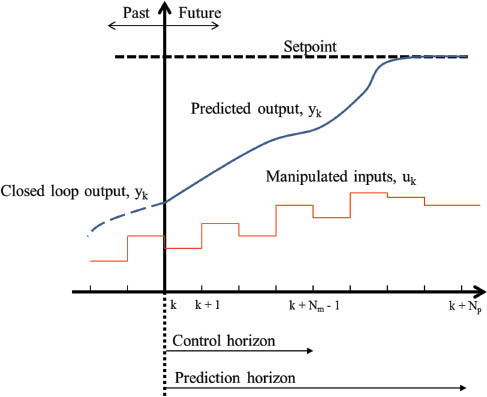
Basic concept of model predictive control (MPC), demonstrating how at time step k, the predicted output (yk) is calculated over the prediction horizon (Np), to calculate the optimal input sequence (uk). This process is repeated at every time step.
Obtain measurement of current state,
Solve the open-loop finite horizon optimization problem subject to constraints,
Apply the first control action of the optimal input sequence,
Go back to step 1.
Model and control for a bioreactor system
In addition to sensor development, deriving appropriate bioreactor system models is critical for MPC. In general, models for most bioreactor systems can be described by the following reaction:
Given this scheme, a mass balance for a batch bioreactor system can be described by a system of nonlinear ordinary differential equations. A model of Moorella thermoacetica, an anaerobic bacterium that demonstrates a high conversion of carbohydrates to acetate, was developed for batch fermentation as follows:
where X, S, and P, are the biomass, substrate and product concentration, respectively; μ is the specific growth rate of the biomass; Kd is rate of cell death (constant); q is the rate of substrate consumption; and v is the rate of product formation associated with growth. In this scheme product formation takes place simultaneously with cell growth.
The models presented in eqs. 7–9 are called unstructured-unsegregated models, and are the simplest representation and most useful for control systems. The cell growth kinetics are often given by some type of Monod relationship or derivation thereof, of which there exists numerous variations throughout the literature. For this work, growth kinetics include both substrate and product inhibition characteristics,
where μmax is the maximum growth rate; Ks is the substrate inhibition constant; Pmax is the maximum product concentration before total inhibition; n is a constant; Yxs and Ypx are the cell yield and product yield constants, respectively; and Ms is the cell maintenance coefficient. The model was fitted to data from [40] and the nine parameters were estimated using a nonlinear least squares fit in MATLAB (R2011). The results from the fitted model are shown in Fig. 4 and the estimated parameter values are shown in Table 2, and also include the mean squared error (MSE).
Parameter estimates for batch kinetic model (shown in Fig. 4) of M. thermoacetica after being fitted to literature data from [40].
| Substrate MSE Parameter | Initial Guess | Glucose 8.25 Value |
|---|---|---|
| μmax | 0.14 | 0.12 |
| Ks | 1.6 | 2.9 |
| Kd | 0.01 | 0.01 |
| Ms | 0.02 | 0.02 |
| Yxs | 0.2 | 0.18 |
| Ypx | 3.3 | 0.25 |
| Pmax | 48.0 | 56.0 |
| n | 1.0 | 1.1 |
![Fig. 4 Batch kinetic model of M. thermoacetica, including biomass (X), Glucose (S), and Acetate (P) concentrations, fitted to literature data from [40].](/document/doi/10.1515/pac-2013-1022/asset/graphic/pac-2013-1022_fig4.jpg)
Batch kinetic model of M. thermoacetica, including biomass (X), Glucose (S), and Acetate (P) concentrations, fitted to literature data from [40].
The batch model was then used to make comparison between a system using the same organism for continuous fermentation in a cell-recycle system [41]. The model eqs. 7–9 were modified to yield the following model for a membrane cell-recycle bioreactor (MCRB):
where D is the dilution rate; Sf is the substrate feed concentration; and B is the bleed ratio. The model was used to calculate productivity, steady state glucose and steady state acetate concentrations at various dilution rates. Figure 5 shows the results from the model compared to literature data from [41]. It can be seen that even using limited data from literature the model is fairly accurate in calculating steady state behavior of the system.
![Fig. 5 Comparison of model of an MCRB for fermentation of glucose to acetate by M. thermoacetica to literature data from [41], (Left Side) cell concentration of X0 = 5 g L–1, feed concentration Sf = 20 g L–1; (Right Side) cell concentration of X0 = 5 g L–1, feed concentration Sf = 30 g L–1.](/document/doi/10.1515/pac-2013-1022/asset/graphic/pac-2013-1022_fig5.jpg)
Comparison of model of an MCRB for fermentation of glucose to acetate by M. thermoacetica to literature data from [41], (Left Side) cell concentration of X0 = 5 g L–1, feed concentration Sf = 20 g L–1; (Right Side) cell concentration of X0 = 5 g L–1, feed concentration Sf = 30 g L–1.
In general, bioreactor models are highly nonlinear, resulting in parametric and unstructured uncertainty. The full nonlinear MPC problem involving both nonlinear equations, coupled with system constraints, forms a nonlinear optimization problem that can often be computationally difficult to solve reliably in a reasonable amount of time. Even then, a solution might not exist. For this initial controller development we use the method of successive linearization for MPC detailed in [42]. This method results in linear approximations of the nonlinear reactor system at the current system state. The result is a quadratic program (QP), for which there are efficient numerical optimization methods for finding a solution. Given the nonlinear system f(t, x, u) represented in eqs. 13–15, the following nonlinear MPC problem is defined:
Such that,
where Δ = x – xsetpoint the difference between the current state (x) and some reference trajectory or setpoint (xsetpoint) and the constraints in eq. 17 are implemented to ensure input and output values achieve realistic values. The manipulated variables for the bioreactor were the dilution rate, substrate feed concentration, and bleed ratio. The model was initiated by running in open-loop until a steady state was reached, which were then used for initial conditions for the closed-loop system. The setpoints were set at 25 g L–1 for acetate concentration (P) and glucose concentration (S) was regulated to 0.1 g L–1. Furthermore, it was assumed that a 10% model mismatch between the plant and controller model existed and full state feedback is provided by online sensors. The results of a set point change are shown in Fig. 6 below.
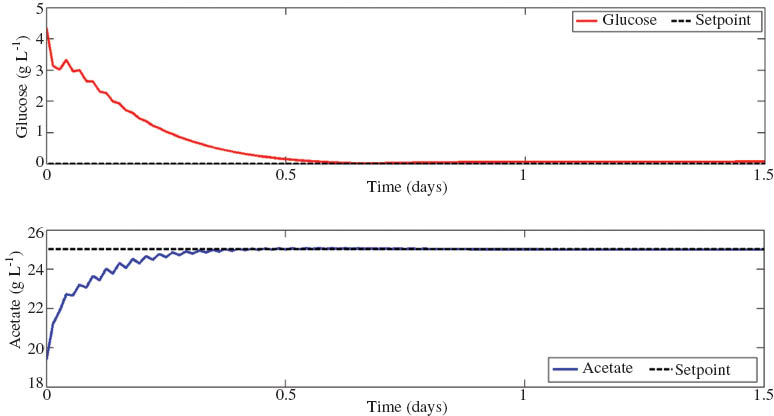
Simulation of MCRB using MPC to regulate glucose concentration (S) to 0.1 g L–1 and acetate concentration (P) to 25 g L–1, by controlling the inputs: dilution rate (d), bleed ratio (b), and substrate feed concentration (Sf). Optimization was solved through successive linearization in MATLAB (2011).
The controller was able to achieve steady state performance at the desired setpoint, while reducing the glucose concentration in the system. Further work will include disturbance rejection and application to various fermentation reactor systems. Having a closed loop feedback system from online sensors of the system will greatly reduce model uncertainty by providing accurate measurements of current system states.
Conclusion
Online measurements of bioprocesses are critical for the success of the biorefining industry as the production of fuels and chemicals from lignocellulosic biomass increases. As measurement technologies, such as Raman spectroscopy, are further developed to continuously and accurately quantify multiple reactant and product concentrations in enzymatic hydrolysis and fermentation reactions, the processing of lignocellulosic biomass can take advantage of APC systems that increases process efficiency. This coupling of advanced sensors and process control has the potential to increase efficiency and improve profit margins.
Article note: A collection of invited papers based on presentations at the 2nd Brazilian Symposium on Biorefineries (II SNBr), Brasília, Brazil, 24–26 September 2013.
References
[1] M.Galbe, G. Zacchi. Biomass and Bioenergy. 46, 70–78 (2012).10.1016/j.biombioe.2012.03.026Search in Google Scholar
[2] R. Bura, S. M. Ewanick, R.R. Gustafson. Tappi J.11, 59–66 (2012).10.32964/TJ11.4.59Search in Google Scholar
[3] A. Vajzovic, R. Bura, K. Kohlmeier, S. Doty. J. Ind. Microbiol. Biotechnol.39, 1453–63 (2012).10.1007/s10295-012-1154-5Search in Google Scholar
[4] N. Balasubramanian, J. S. Kim, Y. Y. Lee. Appl. Biochem. Biotechnol.91-93, 367–376 (2001).10.1385/ABAB:91-93:1-9:367Search in Google Scholar
[5] G. He, Q. Kong, Q. Chen, H. Ruan. J. Zhejiang Univ. Sci. B. 6, 1076–1080 (2005).10.1631/jzus.2005.B1076Search in Google Scholar PubMed PubMed Central
[6] I. R. Lewis, H. G. M. Edwards. Handbook of Raman spectroscopy: from the research laboratory to the process line. In Lewis, IR and Edwards, HGM, eds. 28, CRC Press, New York, NY (2001).Search in Google Scholar
[7] M. H. Brooker, G. Hancock, B. C. Rice, J. Shapter. J. Raman Spectrosc.20, 683–694 (1989).Search in Google Scholar
[8] C.-J. Shih, J. S. Lupoi, E. A. Smith. Bioresour. Technol.102, 5169–5176 (2011).Search in Google Scholar
[9] A. D. Shaw, N. Kaderbhai, A. Jones, A. M. Woodward, R. Goodacre, J. J. Rowland, D. B. Kell. Appl. Spectrosc.53, 1419–1428 (1999).Search in Google Scholar
[10] A. Picard, I. Daniel, G. Montagnac, P. Oger. Extremophiles. 11, 445–452 (2007).10.1007/s00792-006-0054-xSearch in Google Scholar PubMed
[11] T. M. Battaglia, E. E. Dunn, M. D. Lilley, J. Holloway, B. K. Dable, B. J. Marquardt, K. S. Booksh. Analyst. 129, 602–606 (2004).Search in Google Scholar
[12] U. P. Agarwal. In Argyropoulos, DS, ed., Advances in lignocellulosics characterization., TAPPI Press, Atlanta, GA, 201–225 (1999).Search in Google Scholar
[13] N. K. Afseth, V. H. Segtnan, J. P. Wold. Appl. Spectrosc.60, 1358–1367 (2006).Search in Google Scholar
[14] C. A. Lieber, A. M. Ahadevan-Jansen. Appl. Spectrosc.57, 1363–1367 (2003).Search in Google Scholar
[15] T. B. Shope, T. J. Vickers, C. K. Mann. Appl. Spectrosc.41, 908–912 (1987).Search in Google Scholar
[16] S. M. Ewanick, W. Thompson, B. Marquardt, R. Bura. Biotechnol. Biofuels. 6, 1–8 (2013).Search in Google Scholar
[17] C. -J. Shih, E. A. Smith. Anal. Chim. Acta. 653, 200–206 (2009).Search in Google Scholar
[18] L. S. Mendes, F. C. C. Oliveira, P. A. Z. Suarez, J. C. Rubim. Anal. Chim. Acta. 493, 219–231 (2003).Search in Google Scholar
[19] S. R. Gray, S. W. Peretti, H. H. Lamb. Biotechnol. Bioeng.110, 1654–1662 (2013).Search in Google Scholar
[20] T. C. Avila, R. J. Poppi, I. Lunardi, P. A. G. Tizei, G. A. G. Pereira. Biotechnol. Prog.28, 1598–1604 (2012).Search in Google Scholar
[21] K. Olofsson, M. Bertilsson, G. Lidén. Biotechnol. Biofuels. 1, 7 (2008).Search in Google Scholar
[22] J. De Gelder, K. De. Gussem, P. Vandenabeele, L. Moens. J. Raman Spectrosc.38, 1133–1147 (2007).Search in Google Scholar
[23] M. Almeida, R. Alves. Anal. Bioanal. Chem.397, 2693–2701 (2010).10.1007/s00216-010-3566-2Search in Google Scholar PubMed
[24] R. S. Uysal, E. A. Soykut, I. H. Boyaci, A. Topcu. Food Chem.141, 4333–4343 (2013).Search in Google Scholar
[25] M. Kacuráková, M. Mathlouthi. Carbohydr. Res.284, 145–157 (1996).Search in Google Scholar
[26] Y. Cao, Y. Lu, Y. Huang. J. Mol. Struct.693, 87–93 (2004).10.1016/j.molstruc.2004.02.017Search in Google Scholar
[27] M. Bauer, I. K. Craig. J. Process Control. 18, 2–18 (2008).10.1016/j.jprocont.2007.05.007Search in Google Scholar
[28] K. Yamuna Rani, V. Ramachandra Rao. Bioprocess Biosyst. Eng.21, 77–88 (1999).Search in Google Scholar
[29] M. Henson. IEEE Control Syst. Mag. 54–62 (2006).Search in Google Scholar
[30] S. J. Qin, T. A. Badgwell. Control Eng. Pract.11, 733–764 (2003).Search in Google Scholar
[31] A. Ashoori, B. Moshiri, A. Khaki-Sedigh, M. R. Bakhtiari. J. Process Control. 19, 1162–1173 (2009).10.1016/j.jprocont.2009.03.006Search in Google Scholar
[32] A. U. M. Kiran, A. K. Jana. Bioprocess Biosyst. Eng.32, 801–808 (2009).Search in Google Scholar
[33] S. Ramaswamy, T. J. Cutright, H. K. Qammar. Process Biochem.40, 2763–2770 (2005).10.1016/j.procbio.2004.12.019Search in Google Scholar
[34] Z. K. Nagy. Chem. Eng. J.127, 95–109 (2007).Search in Google Scholar
[35] P. Mhaskar, S. Aumi. Can. J. Chem. Eng.85, 416–423 (2007).10.1002/cjce.5450850404Search in Google Scholar
[36] M. Morari, J. H. Lee. 23, 667–682 (1999).Search in Google Scholar
[37] D. Q. Mayne, J. B. Rawlings, C. V. Rao, P. O. M. Scokaert. Automatica. 36, 789–814 (2000).Search in Google Scholar
[38] R. Findeisen, L. Imsland, F. Allgower, B. Foss. Eur. J. Control. 9, 179–195 (2003).Search in Google Scholar
[39] M. Cannon. Annu. Rev. Control. 28, 229–237 (2004).10.1016/j.arcontrol.2004.05.001Search in Google Scholar
[40] K. Sugaya, D. Tusé, J. Jones. Biotechnol. Bioeng.28, 678 – 683 (1986).10.1002/bit.260280507Search in Google Scholar PubMed
[41] S. R. Parekh, M. Cheryan. Enzyme Microb. Technol.16, 104–109 (1994).Search in Google Scholar
[42] J. Lee, N. Ricker. Ind. Eng. Chem. Res.33, 1530–1541 (1994).10.1021/ie00030a013Search in Google Scholar
©2014 IUPAC & De Gruyter Berlin/Boston
Articles in the same Issue
- Frontmatter
- Preface
- 9th International Conference on Novel Materials and their Synthesis (NMS-IX) and 23rd International Symposium on Fine Chemistry and Functional Polymers (FCFP-XXIII)
- Conference papers
- Fabrication and enhanced light-trapping properties of three-dimensional silicon nanostructures for photovoltaic applications
- Light harvester band gap engineering in excitonic solar cells: A case study on semiconducting quantum dots sensitized rainbow solar cells
- A safe and superior propylene carbonate-based electrolyte with high-concentration Li salt
- Nanostructured intercalation compounds as cathode materials for supercapacitors
- Synthesis, properties, and performance of nanostructured metal oxides for supercapacitors
- Ion exchange membranes for vanadium redox flow batteries
- AlPO4-coated V2 O5 nanoplatelet and its electrochemical properties in aqueous electrolyte
- Electrolytes for vanadium redox flow batteries
- Biomineralized organic–inorganic hybrids aiming for smart drug delivery
- Novel π-conjugated bio-based polymer, poly(3-amino-4-hydroxybenzoic acid), and its solvatochromism
- Enoxaparin-immobilized poly(ε-caprolactone)- based nanogels for sustained drug delivery systems
- Chemoenzymatic synthesis of functional amylosic materials
- Soybean hulls residue adsorbent for rapid removal of lead ions
- Silk sericin/poly (NIPAM/LMSH) nanocomposite hydrogels: Rapid thermo-responsibility and good carrier for cell proliferation
- On the copolymerization of monomers from renewable resources: l-lactide and ethylene carbonate in the presence of metal alkoxides
- Correlation between bowl-inversion energy and bowl depth in substituted sumanenes
- Integrated reactions based on the sequential addition to α-imino esters
- Manufacture and characterization of conductor-insulator composites based on carbon nanotubes and thermally reduced graphene oxide
- Synthesis of CuO–ZnO–Al2O3 @ SAPO-34 core@shell structured catalyst by intermediate layer method
- Synthetic versatility of nanoparticles: A new, rapid, one-pot, single-step synthetic approach to spherical mesoporous (metal) oxide nanoparticles using supercritical alcohols
- Synthesis by successive ionic layer deposition (SILD) methodology and characterization of gold nanoclusters on the surface of tin and indium oxide films
- Preface
- 2nd Brazilian Symposium on Biorefineries (II SNBr)
- Conference papers
- Biorefineries – their scenarios and challenges
- Perspectives for the Brazilian residual biomass in renewable chemistry
- Catalytic chemical processes for biomass conversion: Prospects for future biorefineries
- Production of lignocellulosic gasoline using fast pyrolysis of biomass and a conventional refining scheme
- Use of Raman spectroscopy for continuous monitoring and control of lignocellulosic biorefinery processes