Diversity and Application of Biplot Methods in Ecuadorian Research: A Systematic Literature Review
-
 ,
,
,
,
,
,
 and
and

Abstract
This systematic review examines the growing use of Biplot methods in Ecuadorian research, highlighting their relevance for simplifying complex data in fields such as agronomy and epidemiology. Through the analysis of 46 documents, a notable increase in the application of these techniques since 2020 is observed, reflecting the strengthening of local research capacity and the need for multivariate tools to interpret complex data. This review is unique in situating the use of Biplot methods within Ecuador’s scientific context, identifying patterns of international collaboration, particularly with institutions from Spain, and emphasizing the impact of these methods on data visualization for high-value scientific projects. The limitations include a focus on specific databases (Scopus, WoS, and SciELO), which could bias the results toward indexed publications. For the future, it is recommended to promote the use of Biplot methods in emerging areas of Ecuadorian research and establish more international partnerships to strengthen the impact of these techniques on local scientific development.
1 Introduction
The application of Biplot methods in data analysis has gained popularity in the scientific field due to their ability to simplify complex multivariate datasets, facilitating the identification of patterns and relationships across various disciplines (Rapp, Peters, & Dachsbacher, 2021). Biplot methods, which include a variety of techniques such as the HJ Biplot (Pilacuan-Bonete, Galindo-Villardón, & Delgado-Álvarez, 2022), GGE Biplot (Saeidnia, Taherian, & Nazeri, 2023), GH Biplot (Alvarez & Griffin, 2021), PCA Biplot (Valenzuela-Cobos, Guevara-Viejó, Vicente-Galindo, & Galindo-Villardón, 2022), and other adaptive types (Egido Miguélez, 2015), provide a powerful tool for the graphical representation of data matrices, helping researchers identify patterns, relationships, and anomalies within large datasets. These techniques have been applied in various disciplines, including genetics, agronomy, ecology, and economics, demonstrating their versatility and effectiveness.
Although these methods have been well-established in countries such as Spain and Brazil, their use in Ecuador remains limited. In a context where scientific research faces challenges such as the need for detailed analyses and intuitive data visualization – particularly in sectors like agronomy and epidemiology – Biplot methods represent an opportunity to enhance the quality and scope of Ecuadorian studies (Matamoros, Amaro, & Salinas, 2022).
Unlike other countries with more advanced research infrastructures and consolidated experience in using Biplot, Ecuador is in a developmental phase that could benefit significantly from these techniques. This underscores the need for a systematic review to explore the current state and potential of Biplot methods in Ecuador, aiming to identify patterns, implementation opportunities, and possible areas of expansion within the national scientific landscape.
1.1 Study Objective
The aim of this study is to document and analyze the use of Biplot methods in research conducted in Ecuador, evaluating their effectiveness in different fields of study and suggesting directions for future research. This work seeks to serve as a fundamental reference for researchers interested in advanced data analysis methods in Ecuador, providing a solid foundation for the development of science in the country (Pilacuan-Bonete et al., 2022).
1.2 Biplot Analysis in Ecuador and Abroad
At an international level, Biplot methods have been established as valuable tools for analyzing complex data due to their ability to simplify large datasets and facilitate the visualization of relationships and patterns in high-impact research (Malik & Piepho, 2018; Mueller, Tolosana Delgado, Grunsky, & McKinley, 2020). For instance, in Spain, the use of HJ Biplot has been instrumental in analyzing multivariate data in studies on the impact of COVID-19 on digital media, enhancing the understanding of news patterns and social responses to the pandemic (Pilacuan-Bonete et al., 2022). Similarly, in Brazil, the GGE Biplot has been used to evaluate genotype-environment interactions in crop improvement, optimizing agricultural strategies and increasing the efficiency of variety selection programs (Karjagi et al., 2023).
These applications in other countries not only illustrate the versatility of Biplot methods in various research areas but also suggest a potential path for their implementation in Ecuador, where sectors such as agronomy and epidemiology face similar challenges in the need for detailed analysis and clear data visualization. By adapting best practices from these countries to the Ecuadorian context, researchers can employ Biplot methods to address specific national issues, such as improving agricultural crops, conducting public health research, and monitoring environmental variables. This would strengthen the local scientific infrastructure and promote the advancement of advanced statistical methods in Ecuador (Mejía, Briones-Mendoza, Mendoza-Nieto, & Toala-Franco, 2023).
In Ecuador, the use of Biplot represents an opportunity to foster international collaborations and promote knowledge exchange in the scientific field. The success of these techniques in other countries underscores the value of conducting a systematic review that documents the adoption and application of Biplot methods in the Ecuadorian context. This would provide a foundation for future researchers to build robust studies with the potential to impact the sustainable development of the country.
2 Methodology
A literature search was conducted on applying various Biplot methods in Ecuadorian research following the guidelines established by the preferred reporting items for systematic reviews and meta-analyses (PRISMA) (Figure 1) (Moher et al., 2009). The databases used for the bibliographic search were Web of Science (WOS), Scopus, and SciELO.

PRISMA flow chart for systematic review.
2.1 Inclusion and Exclusion Criteria
For the selection of documents, the following inclusion and exclusion criteria were established:
2.1.1 Inclusion Criteria
Studies that utilize Biplot methods applied to research conducted in Ecuador.
Documents available in English or Spanish, allowing for the inclusion of most relevant studies in the region.
Publications indexed in recognized databases such as Scopus, WoS, and SciELO, ensuring academic quality and relevance.
2.1.2 Exclusion Criteria
Studies that mention Ecuador but do not directly apply Biplot methods in their research, to avoid irrelevant analyses.
Duplicate documents found in multiple databases.
Review publications that do not present empirical data or practical applications of Biplot methods.
Studies that do not meet quality standards (e.g., articles without peer review or non-academic reports).
2.2 Description of Databases and Search Terms
WOS, Scopus, and SciELO are prominent databases used for bibliometric analyses and research. WoS and Scopus are widely utilized to track academic publications and communications (Boyle & Sherman, 2006; Elsevier, 2020; Meneghini, 2003).
The following search equation was used in Scopus and SciELO: TITLE-ABS-KEY (“GGE Biplot” OR “PCA Biplot” OR “dynamic Biplot” OR “HJ Biplot” OR “GH Biplot” OR “Biplot” AND Ecuador). For WOS, the following search equation was employed: ((((((TS = (Biplot)) OR TS = (GGE Biplot)) OR TS = (HJ Biplot)) OR TS = (PCA Biplot)) OR TS = (GH Biplot)) OR TS = (dynamic Biplot)) AND TS = (Ecuador).
The following data were collected from the analyzed documents: year of publication, number of authors, number of participating institutions, length in pages, number of references, number of citations, journal name, institution name, author name, and language used. The documents were classified into four main categories: scientific articles, conference articles, scientific reviews, and book chapters.
The number of publications per institution was recorded to identify which Ecuadorian institutions have most frequently employed various Biplot methods in their scientific works and which foreign institutions collaborate with Ecuadorian authors (no publication was recorded where the author was foreign, and among the co-authors, there was at least one Ecuadorian researcher). If an institution appeared repeatedly in the same study, it was only counted once for the tally. To identify collaborations between researchers from different countries, the countries to which these institutions belonged were determined (Mejía et al., 2023). These data were then graphically represented on a map. Additionally, the number of publications and citations of the authors were evaluated to identify pioneering scientists using Biplot as a multivariate statistical technique in their scientific research in Ecuador.
There were authors with more than one publication, although they were not always the article’s first author. To smooth this bias, the following method was used: CI = (number of citations)/i; i = 1, 2, …, n, where i represents the author’s position in the publication.
To determine the relationship between the number of citations and certain document characteristics such as the number of authors, document length, and number of references, an HJ Biplot was employed (Suárez et al., 2016), where the angle between vectors indicates the correlation between variables. Acute angles represent a direct correlation, obtuse angles represent an inverse association, and right angles indicate independence between variables (Gómez-Marcos, Vicente-Galindo, & Rodero, 2022). Only scientific articles were used in this analysis.
To reduce differences between variances, the data were transformed by column standardization. Both graphs and analyses were carried out in the integrated development environment RStudio version 2023.12.0 Build 369, using the R programming language version 4.3.1 and employing the tidyverse and maps packages. The HJ Biplot was created using the MultBiplot program developed by Vicente-Villardon (2010) in the matrix-oriented programming environment MATLAB.
3 Results
A total of 24 documents (Figure 1) were analyzed from an initial set of 46, including scientific articles, conference proceedings, book chapters, and scientific reviews, obtained from the Scopus, WoS, and SciELO databases (Table 1).
Distribution of documents by type and database
| Type of document | Scopus | WoS | SciELO | Total |
|---|---|---|---|---|
| Scientific articles | 19 | 17 | 3 | 39 |
| Conference proceedings | 5 | 0 | 0 | 5 |
| Book chapters | 1 | 0 | 0 | 1 |
| Scientific reviews | 1 | 0 | 0 | 1 |
| Total | 26 | 17 | 3 | 46 |
During the period from 2013 to 2019, five studies were published. The number of publications ranged from one to three, with no publications between 2014 and 2016. Starting in 2020, a notable increase in the number of studies was observed, with at least three publications per year. In 2023, five publications were recorded, marking this year as having the highest number of studies using a Biplot method. As of April 18, 2024, the date on which the queries were conducted, three publications have already been counted for this year (Figure 2).

Production by year.
The 24 studies were conducted by 63 researchers affiliated with 21 institutions from 6 different countries. Ecuador had the highest representation with 13 institutions, followed by Spain with 4 institutions, and then Chile, Cuba, Mexico, and the United States each with 1 institution (Figure 3).

Scientific production by country.
The institutions with the highest number of contributions were the University of Salamanca (USAL), Yachay Tech University (YACHAY) , and the Escuela Superior Politécnica del Litoral (ESPOL), with 8, 7, and 6 publications, respectively (Table 1).
The institutions with the highest number of publications were the USAL and Yachay Tech, with 8 and 7 studies, respectively (Table 2). This high level of contribution may be influenced by the robust research infrastructure at these institutions and their focus on areas such as agronomy and epidemiology, where Biplot methods are particularly useful. Additionally, the HJ-Biplot was proposed in 1986 by the Spanish researcher María Purificación Galindo Villardón, a professor at the USAL.
Scientific production of institutions
| Institution | Publications | Country |
|---|---|---|
| USAL | 8 | Spain |
| YACHAY | 7 | Ecuador |
| ESPOL | 6 | Ecuador |
| University of Guayaquil | 3 | Ecuador |
| ECOTEG Technological University | 3 | Ecuador |
| State University of Milagro | 3 | Ecuador |
The most impactful authors were Carlos Sierra (Ci = 32.5 and 29 for Scopus and WoS, respectively), Nieto-Librero (Ci = 19 and 16 for Scopus and WoS, respectively), Ruíz-Barzola (Ci = 17.45 and 15.7 for Scopus and WoS, respectively), and Tejedor-Flores (Ci = 16 and 12 for Scopus and WoS, respectively; Table 3).
Scientific production of authors
| Authors | Documents (Scopus) | CI (Scopus) | Documents (WoS) | CI (WoS) |
|---|---|---|---|---|
| Sierra Carlos | 2 | 32.5 | 2 | 29 |
| Nieto-Librero | 1 | 19 | 1 | 16 |
| Ruíz-Barzola | 3 | 17.45 | 3 | 15.7 |
| Tejedor-Flores | 1 | 16 | 1 | 12 |
| Vicente-Galindo | 5 | 15.58 | 5 | 12.58 |
| Galindo-Villardón | 5 | 10.08 | 5 | 8.15 |
Most of the studies were published in Lecture Notes in Networks and Systems (N = 5), Sustainability (Switzerland) (N = 4), and Bulletin of Computational Applied Mathematics (N = 2).
Of the total studies where a Biplot method was applied, the HJ Biplot was the most used (N = 12), followed by the PCA Biplot method (N = 5), and the GGE and MANOVA Biplots, which were used in three publications each. The GH and logistic Biplot methods were also used. Of the total documents found, 21 were in English and 3 were in Spanish. Among the scientific articles, 14 were in English and 10 in Spanish. All 5 conference papers were in English. The book chapter found in Scopus was in English and the scientific review was in English.
For research articles in Ecuador where the HJ Biplot method was used (Figure 4), a positive correlation was observed between the number of references and the number of citations. Conversely, a very weak correlation was observed between the article’s impact and the number of authors and pages. The only strong inverse correlation was between the number of citations and the number of institutions. This is understood as, of the eight articles using the HJ Biplot method, only two (25%) were represented as impactful publications. Two were well represented by having a large number of authors and pages but did not achieve significant impact.
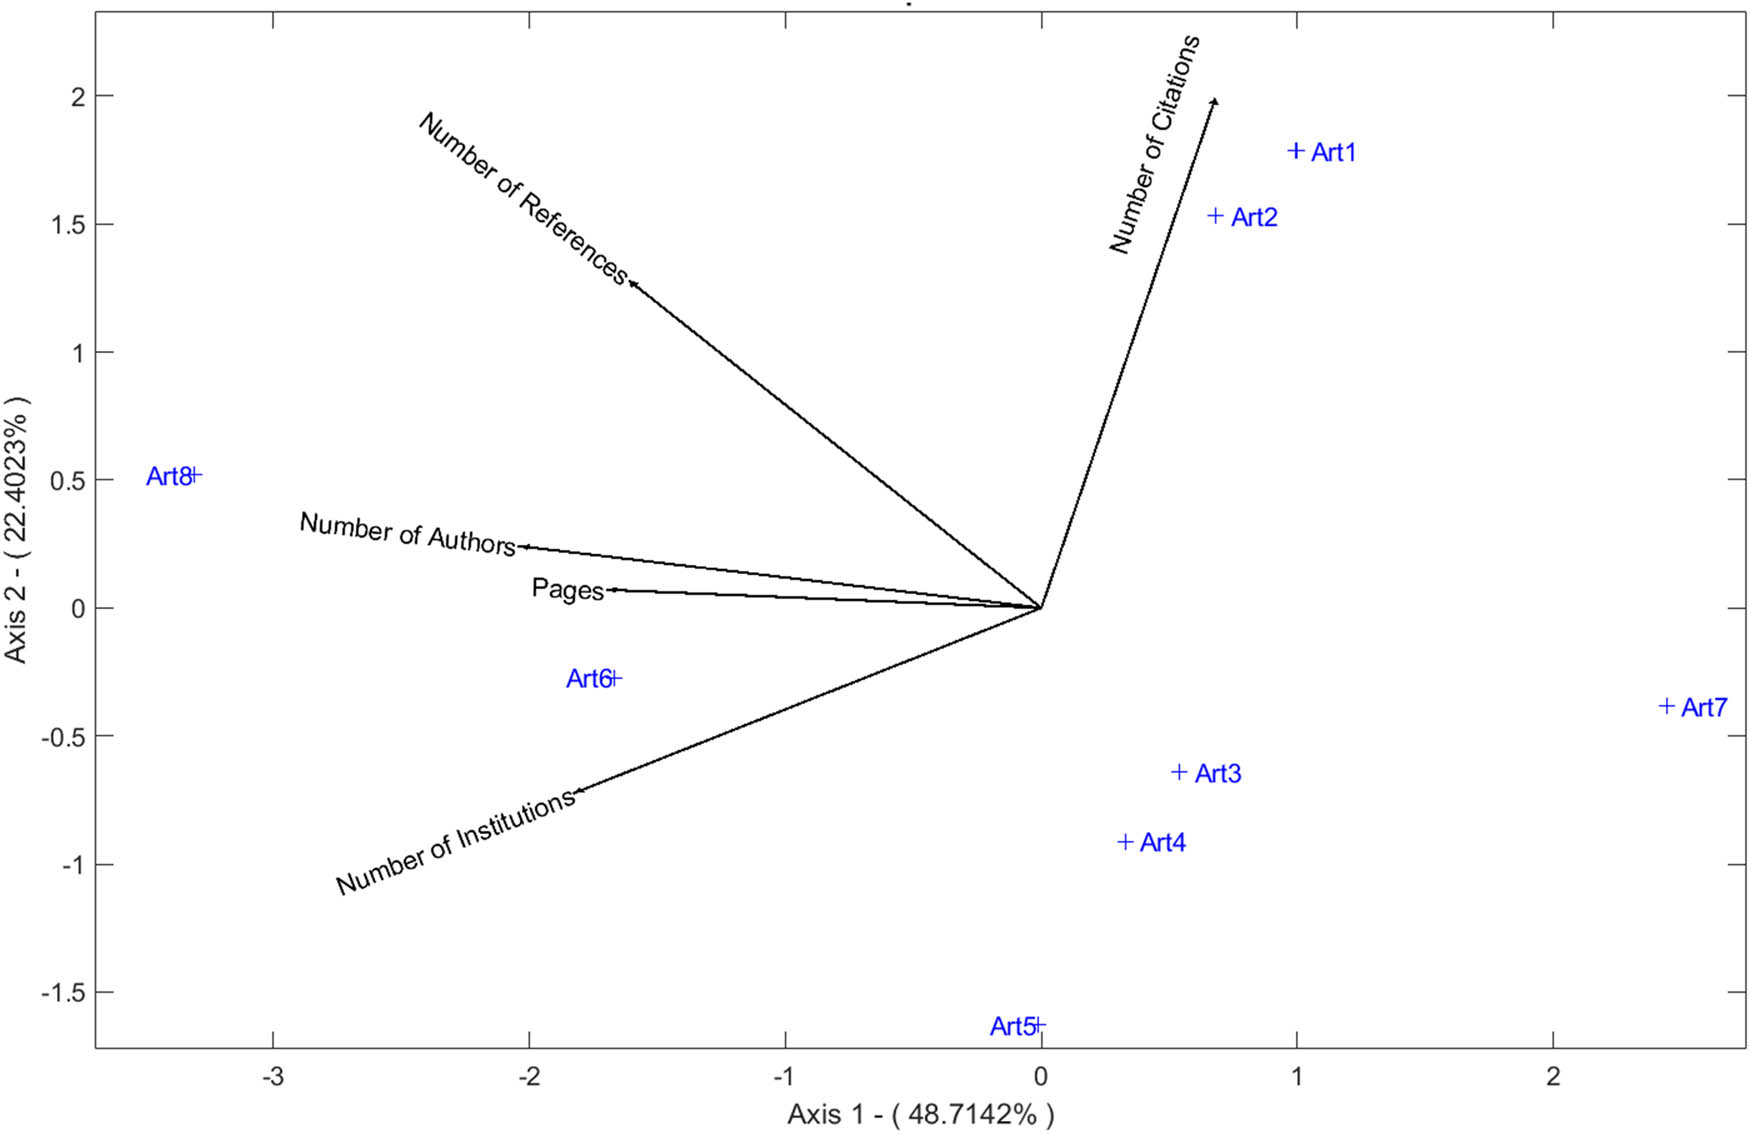
Research using HJ biplot.
In Figure 5, research in Ecuador using methods other than HJ Biplot, such as PCA, GGE, MANOVA, or logistic Biplot, showed a strong positive correlation between the number of authors and citations. Another significant association was strong and inverse between the number of citations and the number of pages. The only near-zero association occurred between the number of citations and the number of references. It was observed that only one article (11%) achieved impact.

Research using PCA, CGE, or MANOVA biplot.
The correlation analysis revealed several interesting associations. In studies utilizing the HJ Biplot method, a positive correlation was observed between the number of references and the number of citations, suggesting that studies with a robust theoretical framework tend to receive more citations. Conversely, there was an inverse correlation between the number of citations and the number of collaborating institutions, indicating that, in some cases, studies with fewer involved institutions tend to accumulate more citations, possibly due to greater specialization. For studies employing other Biplot methods (PCA, GGE, MANOVA), a strong positive correlation was observed between the number of authors and citation impact, suggesting that broader collaborations may be associated with more influential works.
4 Discussion
This bibliometric analysis explored Ecuadorian scientific research that used any Biplot method for statistical data analysis up to April 18, 2024, restricting the search to three platforms: Scopus, WoS, and SciELO.
The origin of Biplot dates back to 1971 (Cárdenas, Galindo, & Vicente-Villardón, 2007), and despite this, the first Ecuadorian research using Biplot methodology appeared in 2013. The delay in adopting the Biplot methodology in Ecuadorian research can be attributed to several factors. First, access to specialized training and knowledge, as highlighted in a study analyzing the factors influencing residential energy consumption in Ecuador (Moya et al., 2023). Moreover, the influence of the real estate sector on urban development and sustainable strategies in Ecuador may also affect the adoption of new methodologies such as Biplot analysis (Mejia et al., 2023). Additionally, the lack of methodologies to estimate the drivers of consumption in the residential sector, as analyzed by Moya et al. (2023), may have hindered the understanding and application of advanced analytical tools like Biplot in Ecuadorian research environments. These factors collectively reflect the scientific and technological challenges that may have impeded the early adoption of the Biplot methodology in Ecuadorian research efforts. Since 2020, the number of studies using Biplot methods has increased considerably. This increase could be influenced by several interrelated factors reflecting both local scientific development and global research and technology trends, such as (1) strengthening of research infrastructure; (2) increase in the availability of data analysis software; (3) growth of academic collaboration and networks; and (4) recognition of the utility of Biplot methods.
In the last decade, Ecuador has seen advances in research infrastructure and technology across various sectors. Technical institutes and technological universities have used data mining techniques to evaluate educational quality (Cale, Chimbo, Moreira, & Berru, 2023). Additionally, advancements in statistical software have improved accessibility to Biplot techniques. Tools like R and Python now provide dedicated packages for Biplot analysis, facilitating their integration into various research efforts (Alvarez & Griffin, 2021; Mueller et al., 2020). International collaborations have indeed strengthened the collaboration networks between universities and countries, facilitating knowledge exchange and the introduction of advanced methodologies such as Biplot methods. Studies show a significant trend toward international collaboration in scientific publications, focusing on improving scientific impact and knowledge transfer (Azorín, 2022; López-López, Lucio-Arias, Díaz-Nova, & Silva, 2023). Biplot analysis offers a powerful means to visualize relationships between variables and observations simultaneously, aiding in the interpretation of complex data structures (Mueller et al., 2020). By leveraging techniques such as principal component analysis (PCA) and singular value decomposition, Biplot enables researchers to explore patterns, identify trends, and make informed decisions based on the visual representation of data matrices (Bianchi, Gibbs, & Pratta, 2020).
Of the institutions involved in all the analyzed documents, Ecuador had the highest representation with 13 institutions. Having 13 institutions involved highlights a significant interest and growing capacity within the country to employ advanced statistical techniques in various research areas (Moreano & Castro, 2022). Additionally, a systematic review analyzed scientific documents on learning analytics in Ecuador, using implicative statistical analysis to discover rules between variables and create a baseline for future research and publications (Matamoros et al., 2022). This may indicate a general strengthening of scientific and research capabilities in Ecuador, where local institutions are increasingly equipped and motivated to conduct complex research requiring sophisticated multivariate analyses (Chavez & Gaybor, 2021).
The country that collaborated the most in the studied documents was Spain. The frequent collaboration between Spain and Ecuador in academic and research activities is evident (Liu, Guo, Xu, & Zhang, 2023). Spanish academics have been drawn to Ecuador due to public policies aimed at improving academic outcomes, leading to a significant influx of Spanish scholars into Ecuadorian universities (Calahorrano, Monge-Nájera, Wang, & Ho, 2020). This collaboration is reflected in the high frequency of joint publications between the two countries, with Spain being one of the most frequent collaborators for Ecuador (Torío-López, Palacios-Madero, Mora-Oleas, Peña-Calvo, & Inda-Caro, 2018). Therefore, the constant collaboration between Spain and Ecuador indicates the presence of strong academic and research ties, fostering knowledge exchange and mutual growth in the academic realm.
The USAL was the institution that most frequently participated in Ecuadorian studies using Biplot methodologies (eight documents). Additionally, the search equation “Biplot” AND “Spain” conducted on April 25, 2024, yielded 671 documents in Scopus, with the oldest dating back to 1988. This makes Spain a pioneer in the Biplot methodology, with more than 35% of those publications being from the USAL.
The collaboration with Spain could also reflect a strategy to increase the international visibility of research conducted in Ecuador. Publishing with international partners can help studies conducted in Ecuador reach a wider audience and achieve greater impact (Mestanza-Ramón et al., 2023).
The HJ Biplot was the most used method. The preference for the HJ Biplot as the most used method in research involving multivariate data analysis can be attributed to several inherent characteristics and advantages offered by this technique: 1. Comprehensive data visualization; 2. Ease of interpretation; 3. Effectiveness in teaching and research.
The HJ-Biplot technique allows a complete graphical representation of rows and columns of a data matrix in a single plane, facilitating clear visual interpretation of complex relationships between observations and variables (da Silva & Freitas, 2020; Pilacuan-Bonete et al., 2022). It has been demonstrated that HJ-Biplot analysis overcomes the limitations of traditional methods such as analysis of variance by allowing the simultaneous examination of multiple data points, as demonstrated in studies on executive functions in children (Ruiz, Egido, Galindo-Villardón, & Del-Río, 2018). HJ Biplot is suitable for a wide range of applications in various fields such as ecology, genetics, marketing, sociology, and more (da Silva & Freitas, 2020; Pilacuan-Bonete et al., 2022). HJ Biplot has been used in modern approaches such as the elastic HJ Biplot, which enhances interpretation by applying regularization methods, demonstrating its adaptability and relevance in contemporary statistical education (Cornejo, Ruff, Benítes, González, & Galindo, 2022).
The analysis of correlations observed in Ecuadorian research using Biplot methods reveals interesting dynamics about how certain bibliometric factors can influence the reception and academic impact of articles.
The positive correlation between the number of references and the number of citations in articles that used the HJ Biplot method may indicate that better-founded studies with a broader theoretical base tend to be more cited (Albers, 2009). This suggests that articles demonstrating an exhaustive literature review and linking their analysis to a broader academic context tend to be perceived as more valuable and therefore attract more citations. The weak correlation between the article’s impact and the number of authors and pages could indicate that neither the article’s length nor the number of collaborators are decisive factors for academic impact in the specific context of these studies. This is supported by findings from research showing a low correlation between the citation of a publication and the impact of the hosting journal, especially for less-cited authors, in various STEM fields (Abramo, D’Angelo, & Di Costa, 2023). On the other hand, the strong inverse correlation between the number of citations and the number of involved institutions suggests that collaborative work between multiple institutions does not necessarily result in a higher number of citations. While collaboration is important for research impact, the correlation between the number of citations and the number of involved institutions can be complex. Research indicates that collaborative publications with a smaller group tend to receive more citations than those with a larger group (Mukherjee & Singh, 2022).
In contrast, the observation that the number of authors has a strong positive correlation with citations in studies that used other Biplot methods such as PCA, GGE, and MANOVA suggests that in these contexts, extensive collaboration could be more directly related to producing high-influence work, possibly due to the combination of expertise and resources that such collaborations entail.
These observations highlight the complexity of factors contributing to the academic impact of publications and suggest that strategies to increase the influence of studies may need to be adapted according to the analysis method and the nature of the field of study. Overall, these findings can guide future researchers in Ecuador to optimize their publication and collaboration strategies to maximize the impact and visibility of their scientific work.
The documents found in Ecuador have addressed various research areas. For instance, Matamoros et al., (2022) conducted an analysis using the HJ Biplot to examine how protein sources, both animal and plant-based, affect mortality from diseases such as diabetes mellitus and cardiovascular diseases in Ecuador between 1990 and 2017. On the other hand, Escobar, Villardón, Cano, and Siteneski (2022) used logistic Biplot to obtain a graphical representation of binary data, facilitating the visual interpretation of the relationship between types of neuroendocrine tumors (NETs) and associated symptoms, helping identify patterns and relationships between variables and clinical cases.
Similarly, Tierras, Martínez, Yépez, Jaramillo, and Arroyo (2021) used Biplot to reveal a significant association between age and tumor anatomical location, as well as a relationship between gender and age at diagnosis in Ecuadorian patients with NETs. Valenzuela-Cobos, Guevara-Viejó, Vicente-Galindo, and Galindo-Villardón (2023) confirmed through the use of PCA and GGE Biplot the effectiveness of biological control as an alternative to chemical fungicides, promoting more sustainable agricultural practices in Ecuador. Other studies have also investigated food sustainability (Valenzuela-Cobos et al., 2022), innovative and entrepreneurial behavior of students and teachers in three Ecuadorian universities (Ascencio Jordán, García Viteri, Ramos Guachilema, & Vargas Párraga, 2020), as well as agricultural biotechnology and sustainability (Valenzuela-Cobos, Guevara-Viejó, Grijalva-Endara, Vicente-Galindo, & Galindo-Villardón, 2023), among other topics. However, it is important to note that Ecuador has only 17 scientific articles that employed Biplot methods. The limited use of these methods could represent a missed opportunity, given that they offer several significant advantages that could enrich research in various disciplines.
5 Conclusion
The results of this systematic analysis demonstrate that the use of Biplot methods in Ecuador has grown significantly in recent years, driven largely by collaboration with international institutions and the development of local capacities in multivariate data analysis. The observed correlation between a robust theoretical framework and citation impact suggests that studies employing Biplot methods with a well-grounded theoretical basis tend to garner greater attention within the academic community. Additionally, the contributions of institutions such as the USAL and Yachay Tech highlight the role of collaborations in promoting the dissemination and adoption of these methodologies in Ecuador.
This growth in the use of Biplot methods not only enhances the analysis of complex data but also strengthens Ecuador’s position in applied multivariate research, creating opportunities to improve data interpretation and visualization in key sectors such as agronomy, epidemiology, and sustainable development.
The findings underscore the value of encouraging the use of Biplot methods in future research in Ecuador, which could further consolidate the impact of national studies on the global scientific stage.
Acknowledgments
The authors thank the State University of Milagro for its institutional support in developing this research.
-
Author contributions: Francisco Paolo Espinel-Obregoso contributed to the conceptualization, investigation, and drafting of the original manuscript. Juan Pablo Sánchez-Loor was responsible for methodology design, formal analysis, and validation. Roberto Ivan Basurto-Quilligana handled investigation and resources management. Dennis Alfredo Peralta-Gamboa contributed to software, data curation, use, and visualization. Carolina Daysi Villacís-Macías participated in the writing, reviewing, and editing of the manuscript. All authors read and approved the final version of the manuscript.
-
Conflict of interest: The authors state no conflict of interest.
References
Abramo, G., D’Angelo, C. A., & Di Costa, F. (2023). Correlating article citedness and journal impact: An empirical investigation by field on a large-scale dataset. Scientometrics, 128(3), 1877–1894. doi: 10.1007/s11192-022-04622-0.Search in Google Scholar
Albers, S. (2009). Well documented articles achieve more impact. Business Research, 2(1), 8–9. doi: 10.1007/BF03343526.Search in Google Scholar
Alvarez, W., & Griffin, V. J. (2021). GH biplot in reduced-rank regression based on partial least squares. Statistics, Optimization & Information Computing, 9(3), 717–734. doi: 10.19139/soic-2310-5070-1112.Search in Google Scholar
Ascencio Jordán, E. P., García Viteri, R. A., Ramos Guachilema, T. I., & Vargas Párraga, V. M. (2020). Innovative behavior at the Ecuadorian university: A multivariate analysis. Revista Venezolana de Gerencia, 25(3), 355–367. doi: 10.37960/rvg.v25i3.33374.Search in Google Scholar
Azorín, C. (2022). Collaborative networking in education: Learning across international contexts. REICE. Revista Iberoamericana Sobre Calidad, Eficacia y Cambio En Educación, 20(3), 63–80. doi: 10.15366/reice2022.20.3.004.Search in Google Scholar
Bianchi, M. B., Gibbs, P., & Pratta, G. (2020). Biplot approach with self-incompatibility analyses of sib diallel cross data for Lysimachia monelli (Primulaceae). Plant Biosystems – An International Journal Dealing with all Aspects of Plant Biology, 154(2), 222–230. doi: 10.1080/11263504.2019.1587540.Search in Google Scholar
Boyle, F., & Sherman, D. (2006). The product and its development. The Serials Librarian, Philadelphia, 49(3), 147–153.10.1300/J123v49n03_12Search in Google Scholar
Calahorrano, L., Monge-Nájera, J., Wang, M. H., & Ho, Y. S. (2020). Ecuador publications in the Science Citation Index Expanded: Institutions, subjects, citation and collaboration patterns. Revista de Biología Tropical, 68(1), 98–107. doi: 10.15517/rbt.v68i1.37466.Search in Google Scholar
Cale, D., Chimbo, V., Moreira, M. C., & Berru, Y. T. (2023). Analysis of the results of evaluation in higher technological institutes of Ecuador, using data mining techniques. In I. Jeena Jacob, S. Kolandapalayam Shanmugam, & I. Izonin (Eds.), Expert clouds and applications (pp. 387–401). Cham, Switzerland: Springer Nature. doi: 10.1007/978-981-99-1745-7_28.Search in Google Scholar
Cárdenas, O., Galindo, P., & Vicente-Villardón, J. L. (2007). Los métodos Biplot: Evolución y aplicaciones. Revista Venezolana de Análisis de Coyuntura, 13(1), 279–303.Search in Google Scholar
Chavez, H., & Gaybor, J. (2021). Transformations in the Ecuadorian scientific landscape: A bibliometric analysis of the main publications trends and the role of the scientific networks and the public international scholarship program. Journal of Scientometric Research, 10, s115–s128. doi: 10.5530/jscires.10.1s.27.Search in Google Scholar
Cornejo, C., Ruff, C., Benítes, L., González, J. A., & Galindo, P. (2022). HJ-BIPLOT as a basis for the search of clusters based on pension indicators for Latin American Countries. In J. L. Reis, M. K. Peter, R. Cayolla, & Z. Bogdanović (Eds.), Marketing and smart technologies (pp. 107–124). Cham, Switzerland: Springer Nature. doi: 10.1007/978-981-16-9272-7_10.Search in Google Scholar
da Silva, A. O., & Freitas, A. (2020). Time series components separation based on singular spectral analysis visualization: An HJ-biplot method application. Statistics, Optimization & Information Computing, 8(2), 346–358. doi: 10.19139/soic-2310-5070-897.Search in Google Scholar
Egido Miguélez, J. F. (2015). Biplot dinámico. Salamanca, España: Ediciones Universidad de Salamanca. doi: 10.14201/gredos.125245.Search in Google Scholar
Elsevier. (2020). Guia de referência rápida. Acesso em: 10 ago. 2020. Diponivel em: https://www.periodicos.capes.gov.br/images/documents/Scopus_Guia%20de%20refer%C3%AAncia%20r%C3%A1pida_10.08.2016.pdf.Search in Google Scholar
Escobar, K. M., Villardón, J. L. V., Cano, D. F. A., & Siteneski, A. (2022). Clinical related factors to neuroendocrine tumors in Ecuadorian patients: A logistic biplot approach. Investigación Clínica, 63(1), 19–31. doi: 10.54817/IC.v63n1a02.Search in Google Scholar
Gómez-Marcos, M. T., Vicente-Galindo, M. P., & Martín Rodero, H. (2022). ¿Garantiza el Ranking de Shanghai alto desempeño académico?. Revista Espanola de Documentacion Cientifica, 45(1), e318. doi: 10.3989/redc.2022.1.1805.Search in Google Scholar
Karjagi, C. G., Phagna, R. K., Neelam, S., Sekhar, J. C., Singh, S. B., & Yathish, K. R. (2023). Identification of best testers for heterotic grouping of tropical maize inbred lines using GGE biplot. Crop Science, 63(4), 2033–2049. doi: 10.1002/csc2.20968.Search in Google Scholar
Liu, J., Guo, X., Xu, S., & Zhang, Y. (2023). Quantifying the impact of strong ties in international scientific research collaboration. PLOS ONE, 18(1), e0280521. doi: 10.1371/journal.pone.0280521.Search in Google Scholar
López-López, W., Lucio-Arias, D., Díaz-Nova, A. M., & Silva, L. M. (2023). International collaboration in Latin American psychology through the analysis of co-authorship networks. Trends in Psychology, 31(3), 503–519. doi: 10.1007/s43076-023-00266-y.Search in Google Scholar
Malik, W. A., & Piepho, H. P. (2018). Biplots: Do not stretch them! Crop Science, 58(3), 1061–1069. doi: 10.2135/cropsci2017.12.0747.Search in Google Scholar
Matamoros, E., Amaro, I., & Salinas, J. (2022). Statistical analysis of mortality by non-communicable diseases (NCDs) and food supply in Ecuador, 1990–2017. Bionatura, 7, 1–6. doi: 10.21931/RB/2022.07.02.43.Search in Google Scholar
Mejía, D., Briones-Mendoza, J., Mendoza-Nieto, K., & Toala-Franco, D. (2023). A bibliometric analysis of elasmobranch research in Ecuador. Regional Studies in Marine Science, 62, 102980. doi: 10.1016/j.rsma.2023.102980.Search in Google Scholar
Mejia, A. S., Moya, M., & Martínez-Gómez, J. (2023). Evaluation of the design of ecological buildings using the matrix of eco-efficiency in residential sectors of Ecuador. Sustainability, 15(9), 7585. doi: 10.3390/su15097585.Search in Google Scholar
Meneghini, R. (2003). O projeto Scielo (Scientific Electronic Library on Line) e a visibilidade da literatura científica «Periférica». Química Nova, 26, 155–156. doi: 10.1590/S0100-40422003000200001.Search in Google Scholar
Mestanza-Ramón, C., Monar-Nuñez, J., Guala-Alulema, P., Montenegro-Zambrano, Y., Herrera-Chávez, R., Milanes, C. B., … Toledo-Villacís, M. (2023). A review to update the protected areas in Ecuador and an analysis of their main impacts and conservation strategies. Environments, 10(5), 79. doi: 10.3390/environments10050079.Search in Google Scholar
Moher, D., Liberati, A., Tetzlaff, J., & Altman, D. G. (2009). Preferred reporting items for systematic reviews and meta-analyses: The PRISMA statement. BMJ, 339, b2535. doi: 10.1136/bmj.b2535.Search in Google Scholar
Moreano, L. F. B., & Castro, L. M. U. (2022). Review of multivariate statistical methods applied to the results of the Ser Bachiller exam in Ecuador. Minerva, 1(Special), 114. doi: 10.47460/minerva.v1iSpecial.86.Search in Google Scholar
Moya, D., Arroba, C., Castro, C., Pérez, C., Giarola, S., Kaparaju, P., … Hawkes, A. (2023). A methodology to estimate high-resolution gridded datasets on energy consumption drivers in Ecuador’s residential sector during the 2010–2020 period. Energies, 16(10), 3973. doi: 10.3390/en16103973.Search in Google Scholar
Mueller, U., Tolosana Delgado, R., Grunsky, E. C., & McKinley, J. M. (2020). Biplots for compositional data derived from generalized joint diagonalization methods. Applied Computing and Geosciences, 8, 100044. doi: 10.1016/j.acags.2020.100044.Search in Google Scholar
Mukherjee, B., & Singh, A. (2022). How collaborative is Indian academia? A case study of top three ranked institutions. Annals of Library and Information Studies (ALIS), 69(1), Article 1. doi: 10.56042/alis.v69i1.58175.Search in Google Scholar
Pilacuan-Bonete, L., Galindo-Villardón, P., & Delgado-Álvarez, F. (2022). HJ-Biplot as a tool to give an extra analytical boost for the Latent Dirichlet Assignment (LDA) Model: With an application to digital news analysis about COVID-19. Mathematics, 10(14), 2529. doi: 10.3390/math10142529.Search in Google Scholar
Rapp, T., Peters, C., & Dachsbacher, C. (2021). Visual analysis of large multivariate scattered data using clustering and probabilistic summaries. IEEE Transactions on Visualization and Computer Graphics, 27(2), 1580–1590. doi: 10.1109/TVCG.2020.3030379.Search in Google Scholar
Ruiz, N. C., Egido, J., Galindo-Villardón, P., & Del-Río, P. (2018). Advantages of using HJ-biplot analysis in executive functions studies. Psicologia: Teoria e Pesquisa, 34, e3426. doi: 10.1590/0102.3772e3426.Search in Google Scholar
Saeidnia, F., Taherian, M., & Nazeri, S. M. (2023). Graphical analysis of multi-environmental trials for wheat grain yield based on GGE-biplot analysis under diverse sowing dates. BMC Plant Biology, 23(1), 198. doi: 10.1186/s12870-023-04197-9.Search in Google Scholar
Suárez, M. H., Pérez, D. M., Rodríguez-Rodríguez, E. M., Romero, C. D., Borreguero, F. E., & Galindo-Villardón, P. (2016). The compositional HJ-biplot – A new approach to identifying the links among bioactive compounds of tomatoes. International Journal of Molecular Sciences, 17(11). 1828. doi: 10.3390/ijms17111828.Search in Google Scholar
Tierras, Y. B. V., Martínez, A. E. D., Yépez, C. D. C., Jaramillo, L. A. T., & Arroyo, W. F. V. (2021). Comparación de las características de calidad de fruta en genotipos de papaya (Carica papaya L.) provenientes de Shushufindi y La Joya de los Sachas, Ecuador. Ciencia y Tecnología Agropecuaria, 22(1), 1–21. doi: 10.21930/rcta.vol22_num1_art:1930.Search in Google Scholar
Torío-López, S., Palacios-Madero, M. D., Mora-Oleas, J. C., Peña-Calvo, J. V., & Inda-Caro, M. (2018). Parents’ perceptions of their acceptance and rejection behaviors: Benchmarking spain and Ecuador. Journal of Child and Family Studies, 27(9), 3019–3026. doi: 10.1007/s10826-018-1135-z.Search in Google Scholar
Valenzuela-Cobos, J. D., Guevara-Viejó, F., Grijalva-Endara, A., Vicente-Galindo, P., & Galindo-Villardón, P. (2023). Production and evaluation of Pleurotus spp. hybrids cultivated on Ecuadorian agro-industrial wastes: Using multivariate statistical methods. Sustainability (Switzerland), 15(21). 15546. doi: 10.3390/su152115546.Search in Google Scholar
Valenzuela-Cobos, J. D., Guevara-Viejó, F., Vicente-Galindo, P., & Galindo-Villardón, P. (2022). Food sustainability study in Ecuador: Using PCA biplot and GGE biplot. Sustainability, 14(20), 13033. doi: 10.3390/su142013033.Search in Google Scholar
Valenzuela-Cobos, J. D., Guevara-Viejó, F., Vicente-Galindo, P., & Galindo-Villardón, P. (2023). Eco-friendly biocontrol of moniliasis in Ecuadorian Cocoa using biplot techniques. Sustainability, 15(5), 4223. doi: 10.3390/su15054223.Search in Google Scholar
Vicente Villardon, J. L. (2010). MULTBIPLOT: A package for multivariate analysis using biplots, Departamente de Estadística.Search in Google Scholar
© 2025 the author(s), published by De Gruyter
This work is licensed under the Creative Commons Attribution 4.0 International License.
Articles in the same Issue
- Research Articles
- Proposing a Conceptual Framework for Social Listening in Libraries: A Potential Game Changer to Engage Gen Z and Centennial Users
- Roles, Challenges, and Sustainability of Australian Journals: A Survey of Editors
- Diversity and Application of Biplot Methods in Ecuadorian Research: A Systematic Literature Review
- Towards OER Statistics: Data Requirements for the Scientometric Analysis of Open Educational Resources
- Academic Libraries and the Development Agenda: Librarying the First Aspiration of Agenda 2063 in Ghana
- Leveraging AI-Generated Visuals for Enhancing Management of Career Orientation: A Quasi-Experimental Study
- Artificial Intelligence in Academic Writing and Research: Adoption and Effectiveness
- Promoting Information Literacy to Mitigate Misinformation on Agricultural Government Schemes: A Farmer-Focused Perspective
- Mapping the Invisible: A Two-Decade Bibliometric Analysis of Intangible Cultural Heritage Research
- Greening the Libraries: A Legislative Gap Analysis of State Library Acts in India
- Artificial Intelligence in Higher Education Institutions Libraries: Analyzing User Perceptions and Expectations
- Review Articles
- Transparency in Open Science: An Actionable Principle?
- Writing the Pesantren Library: A Conceptual and Framework Proposition
- Trends and Analysis of Artificial Intelligence Research in Latin America (2013–2023)
- Communications
- The Now-Defunct ResearchGate Score and the Extant Research Interest Score: A Continued Debate on Metrics of a Highly Popular Academic Social Networking Site
- When Data Meets the Past: Data Collection, Sharing, and Reuse in Ancient World Studies
- Integration of Critical Information Literacy Skills in Academic Libraries in Africa
- Are Local Journals More Policy Relevant? Evidence From Policy Citations to Australian Journals