Glycoprofiling of early non-small cell lung cancer using lectin microarray technology
-
Lingyan Zeng


Abstract
Objectives
Non-small cell lung cancer (NSCLC) is one of the most common malignancies in the world with a high incidence and it lacks effective biomarkers for early-stage detection. In this investigation, we aimed to investigate the alterations in plasma glycans related to NSCLC and assess the possibility of plasma glycopatterns as potential biomarkers for the diagnosis of NSCLC.
Methods
First, plasma samples from 16 patients with early-stage lung adenocarcinoma (LUAD), 16 patients with early-stage Lung squamous cell carcinoma (LUSC), and 16 healthy volunteers, were selected for inclusion in this study to probe the difference in plasma glycopatterns using lectin microarrays. Then, the diagnostic effectiveness of the candidate lectins was evaluated using ROC.
Results
In contrast to the NL group, seven candidate lectins offered potential diagnostic utility in the NSCLC (LUAD and LUSC) group. F17AG was significantly altered in LUSC with an AUC of 0.818 (adj.P.Val<0.05) compared to NL samples. There were 20 differentially expressed lectins in the LUAD group compared to the NL group. Based on the AUC values (AUC>0.800) and the normalized fluorescence intensities of the lectins, we selected eight lectins, GAL2, PTL-1, GNA, SSA, LENTIL, CA, PHA-E, and MAA to perform logistic regression analysis, and found that the combination of these eight candidate lectins had high diagnostic potential.
Conclusions
The results of this study should help to distinguish between NSCLC and NL based on changes in plasma glycopatterns, which have a great deal of potential to be biomarkers for diagnosing NSCLC.
Introduction
Lung cancer is one of the most prevalent cancers in the world, and its five-year survival is very low in the advanced stage [1, 2]. The mortality from lung cancer in China is predicted to rise by approximately 40 % between 2015 and 2030 [3].
The most common types of lung cancer are non-small cell lung cancer (NSCLC) and small cell lung carcinoma (SCLC), and NSCLC is further subdivided into lung adenocarcinoma (LUAD), large cell lung cancer, and lung squamous cell carcinoma (LUSC) [4, 5]. Lung cancer is frequently discovered at an advanced stage, which means that the ideal therapy window is lost and the patient’s survival is poor. As lung cancer remains a disease with a high mortality rate, some researchers have used natural myricetin and its derivatives to develop new bioactive molecules to treat lung cancer [6]. Another study analyzed scRNA-seq data from the tumor tissue of peripheral blood of NSCLC patients to bioinformatically explore cellular heterogeneity, DEGs, associated biological pathways, PPI networks, key genes, miRNAs and TFs, and other genetic biomarkers intended for the diagnosis and prognosis of NSCLC [7]. Early-stage detection has emerged as a key strategy for reducing NSCLC incidence and mortality. Early detection methods for lung cancer include sputum cytology, breath testing, computed tomography (CT) scans, low-dose computed tomography screening, and CXR [8], [9], [10], [11]. There are some limitations to these diagnostic methods. For example, the sensitivity of CXR is low, and CT scan images contain much information about nodules, which need to be accurately evaluated [11]. Therefore, a more efficient early-stage NSCLC diagnostic approach is still desperately needed in clinical practice.
At present, glycobiology is a hot topic in cancer research [12, 13]. Almost all secreted proteins and cell membranes carry glycans. Glycans are involved in biological processes such as cell communication and molecular signaling [14]. Many tumor-associated glycans, such as sialic acid Tn (sTn), polysialic acid (PSA), and sialic acid Lewis X (sLex), are abnormally produced in cancer and are essential for biological processes such as growth and migration [15], [16], [17], [18]. Therefore, it is of great clinical significance to explore the association between glycans and diseases.
Studies of glycoprotein-bound glycans, however, are not simple. The structure of glycans has diversity, which is not the diversity of constituent glycans but more the diversity of isomers. High-performance liquid chromatography (HPLC) and mass spectrometry (MS) can make it difficult to distinguish glycans from isomers of different structures, and these methods require glycans to be dissociated from proteins [19]. Lectins are glycan-binding proteins that are purified from trees, legumes, etc., and they are highly specific for specific glycans. The lectin microarray composed of lectins can provide differential glycan analysis in a high-throughput manner, similar to an antibody microarray, which does not require prior dissociation of glycans from proteins. Therefore, the lectin microarray is one of the most effective molecular tools for the analysis of glycans [20]. As a result, lectins are frequently used for glycosylation research, particularly in the identification of glycans that change during cancer [20, 21]. For example, a study explored the changes in salivary protein glycosylation associated with gastric cancer through 37 different lectins and constructed a diagnostic model of gastric cancer and atrophic gastritis through 15 candidate lectins [22]. Another study mined potential biomarkers by lectin analysis of the entire glycan profile of serum samples from prostate cancer patients, benign prostatic hyperplasia, and healthy individuals [23].
Currently, due to the lack of effective biomarkers for the early-stage diagnosis of NSCLC, plasma is an easily accessible body fluid that is rich in protein, amino acids, and lipids in the human body [24]. Therefore, in this study, we analyzed a total of 48 human plasma samples, including 16 lung squamous cell carcinoma (LUAD), 16 lung squamous cell carcinoma (LUSC), and 16 healthy volunteers (NL), using a lectin microarray containing 95 lectins, aiming to explore the relevance of changes in plasma glycopatterns associated with NSCLC. The alterations in glycopatterns were also compared between the LUAD, LUSC, and NL groups, and ROC analysis was performed based on candidate lectins to assess the potential of altered plasma glycopatterns as a biomarker for early-stage NSCLC diagnosis.
Materials and methods
Plasma sample collection
This study was approved by the Research Ethics Committee of West China Hospital, Sichuan University. And it involved 48 human plasma samples, including 16 LUAD, 16 LUSC, and 16 NL samples. All patients in the study were in the early-stage. All recruited patients had diagnostic pathological information and clinical characteristics (Table 1). All plasma samples were collected, processed, and stored at −80 °C.
Clinical information of samples.
| Variable | LUAD | LUSC | Healthy |
|---|---|---|---|
| (n=16) | (n=16) | (n=16) | |
| Age, year | 54.38 ± 6.58 | 64.94 ± 8.07 | 44.06 ± 8.70 |
|
|
|||
| Gender, n (%) | |||
|
|
|||
| Male | 3 (18.75 %) | 16 (100 %) | 10 (62.5 %) |
| Female | 13 (81.25 %) | 0 (0 %) | 6 (37.5 %) |
|
|
|||
| Smoking status, n (%) | |||
|
|
|||
| Current or ex-smoker | 14 (87.50 %) | ||
| Never smoking | 15 (93.75 %) | ||
| Unknown | 1 (6.25 %) | 2 (12.5 %) | |
|
|
|||
| Stage, n (%) | |||
|
|
|||
| I | 16 (100 %) | 16 (100 %) | |
|
|
|||
| COPD, n (%) | |||
|
|
|||
| Yes | 1 (6.25 %) | 5 (31.25 %) | |
| No | 15 (93.75 %) | 11 (68.75 %) | |
Lectin microarray
The reagents used in this experiment are contained in the GA-Lectin-95 Kit, purchased from RayBiotech, located in Peachtree Corners, Georgia. This sample was first dialyzed and then biotin-labeled samples were obtained. The slides containing the lectin chips were removed and equilibrated at room temperature for 20–30 min. Subsequently, 100 µL of 1 × closure solution was added to each chip well and closed at room temperature. The closure solution was withdrawn, and 100 µL of the sample was added to each well. Dilute the biotin-labeled plasma 50-fold according to the pre-experimental closure solution. Draw the samples and wash the slides. Afterward, the Cy3 equivalent was added to the chip by adding 1.4 mL of the closure solution and incubating for 1 h protected from light. The slide was washed again. An InnoScan 300 laser scanner was used to scan the signal with the following parameters: Instrument model: InnoScan 300 Microarray Scanner; Manufacturer: Innopsys; Place of origin: Parc d’Activités Activestre, 31,390 Carbonne – France; WaveLengh: 532 nm; Resolution: 10 µm.
Analysis of data
The raw data from the microarray scans were automatically calculated by the Excel-based analysis software provided by Raybiotech, with functions including sorting, averaging, background subtraction, positive control normalization, and histograms. A lectin chip containing 95 lectin factors purchased from RayBiotech, which has a corresponding Excel analysis form (https://www.raybiotech.com/lectin-array-95-ga-lectin-95), was used in this experiment. After normalizing the raw data with this software, the normalized without background data were selected for analysis and the data were analyzed using the moderated t-statistics of R4.0.2/Bioconductor’s data package limma version 3.54.2 and adjust.P.Val (BH method corrected p values) as well as expression difference multiples were used to screen for differential lectins and the selection criteria were as follows: (1) fold change over 1.2 or less than 0.83, absolute logFC >0.263; (2) adj.P.Val<0.05.
Volcano plot
Differential lectins were visualized by volcano plots. Lectins that were significantly different between the two samples were analyzed and plotted using R4.0.2. The plotting function was ggplot2 (V3.4.1) and the data package was ggfortify (V0.4.16). Red indicates upregulated lectins. Blue indicates downregulated lectins. Gray indicates insignificant differences.
Cluster heatmap
We used R4.0.2/Bioconductor for the clustering heatmap, using heatmap.2 functions and the data package gplots. Red, high; blue, low; white, medium.
ROC analysis
ROC analysis was performed on the target lectins using the pROC package via R4.0.2 software to assess their sensitivity and specificity. The AUC was used to estimate the diagnostic value. A logistic regression analysis was constructed for the lectin combination.
Results
This study was divided into three groups: the LUAD group, the LUSC group, and the NL group, with each group, having 16 cases. All plasma samples were detected by the lectin microarray (Figure 1A. Figure created with BioRender.com). The lectin microarray layout contains 95 lectins and is currently the largest lectin array, which can cover different glycans to the greatest extent, and details are shown in Table S1. The original data obtained by chip scanning were processed by Raybiotech’s Excel-based analysis software for chip background removal and normalization. The specific binding of lectins can recognize different carbohydrates, so the different normalized fluorescence intensities (NFIs) of lectins can reflect the different glycopatterns in plasma samples. As shown in Figure 1B, plasma samples were analyzed in the heatmap with 48 samples as columns and 95 lectins as rows, showing different glycopatterns in 48 different samples. The glycopatterns of the LUAD group were quite different from those of the NL group and LUSC group. In our study, changes in NFIs for lectins in the LUSC group were not as significant as those in the LUAD group compared to the NL group.

Detection of glycopatterns in LUAD samples, LUSC samples, and NL samples using the lectin chip. (A) Flow chart of the lectin chip. The samples were labeled with biotin, blocked and incubated, incubated with Cy3 equivalent dye-streptavidin, and then the signal was scanned with a laser scanner such as InnoScan 300, with scanning parameters WaveLengh: 532 nm; resolution: 10 µm. (B) 48 samples are columns and 95 lectins are rows. The color and intensity of each square represent the level of expression relative to the rest of the data in the row. Red, high, blue, low; white is medium.
Alterations in plasma glycopatterns among the NSCLC and NL groups
The NFIs of each lectin showed different expression levels of plasma glycopatterns. The lectin signal patterns were divided into three categories to evaluate whether the changes in plasma glycopatterns were significant, (1) the results showed significant upregulation (fold change>1.2, adj.P.Val<0.05), (2) significant downregulation (fold change<0.83, adj.P.Val<0.05), and (3) the results showed no significant difference (fold change was 0.83–1.2, adj.P.Val>0.05). Glycopatterns were altered in NSCLC (LUAD and LUSC) compared to NL samples, with seven NFIs for lectins significantly altered (Figure 2A) (Table 2). Among them, the GlcNAc binder F17AG, and the NeuAcα2-6Gal/GalNAc binder SAMB exhibited significantly increased NFIs in patients with NSCLC compared with the NL group (all adj.P.Val<0.05). Gal and GalNAc binder PTL-1, N-acetylgalactosamine binder SSA and SHA, αMan and αGlc binder LcH A, branched LacNAc and Gal binder GAL1 exhibited significantly decreased NFIs in patients with NSCLC compared with the NL group (all adj.P.Val<0.05). In this study, ROC curves were drawn to judge the role of each differentially expressed lectin in the diagnosis of different comparison groups. If AUC>0.700, the lectin can be considered an independent diagnostic potential factor. In the NSCLC group and the NL group, the AUC values of F17AG (AUC=0.809) and PTL-1 (AUC=0.867) were greater than 0.800, which had better diagnostic potential for NSCLC. The AUC values of the other five lectins were all between 0.700 and 0.800 (Figure 2B), which offered only moderate performance. As shown in Figure 2C, these seven differential lectins clustered 48 samples well. Plasma glycopatterns in the NSCLC group and the NL group were well differentiated. Therefore, plasma glycopatterns may be used as biomarkers to provide diagnostic information.

Detection of glycopatterns in NSCLC (LUAD + LUSC) samples and NL samples using the lectin chip. (A) Difference volcano plot of NSCLC vs. NL group. Red indicates up-regulated lectins, blue indicates down-regulated lectins, and grey indicates insignificant differences. (B) Lectin factors with significantly different signals and ROC analysis of candidate lectins in the NSCLC group compared with the NL group, *p≤0.05. (C) The samples are rows, and the seven candidate lectins are columns. The color and intensity of each square represent the expression level relative to the rest of the data in the row. Red, high, blue, low; white is medium.
The differentially expressed lectins in the NSCLC group and the NL group.
| AveExp.NSCLC | AveExp.NL | logFC | adj.P.Val | Foldchange | Regulation | |
|---|---|---|---|---|---|---|
| F17AG | 9.292265743 | 3.94499812 | 5.347267623 | 5.77E-05 | 40.70876707 | Up |
| PTL-1 | 11.38384865 | 12.56741507 | −1.183566419 | 0.001714697 | 0.440261801 | Down |
| SSA | 14.0210748 | 14.6397291 | −0.618654302 | 0.019714585 | 0.651278135 | Down |
| SAMB | 16.32287037 | 15.7809433 | 0.541927069 | 0.019714585 | 1.455915947 | Up |
| GAL1 | 13.56178912 | 14.05483507 | −0.49304595 | 0.019714585 | 0.710523391 | Down |
| LcH A | 12.8577609 | 13.31250898 | −0.454748079 | 0.028938411 | 0.729637569 | Down |
| SHA | 12.92993288 | 13.32336589 | −0.393433006 | 0.019714585 | 0.761315837 | Down |
Alterations in plasma glycopatterns among the LUAD and NL groups
Compared with the NL group, the NFIs of 20 lectins in the LUAD group were significantly changed (Figure 3A). With significant differences, among the GlcNAc binder F17AG, NeuAc α2- 6Gal binder SAMB, galactose, N-acetyl-D-galactosamine, and lactose binder RCA 60 NFIs were significantly upregulated in patients with LUAD compared with the NL group (all adj.P.Val<0.05), while 17 lectins such as N-acetylgalactosamine binder SSA and SHA, GalNAc and Gal binder PTL-1, poly LacNAc binder GAL3, branched LacNAc and Gal binder GAL1, αMan binder GNA and NPA, D-mannose and D-glucose binder LENTIL, GalNAcα1-3Gal (Blood Group A) and branched LacNAcbinder GAL2, Galβ4GlcNAcβ2Manα6 (GlcNAcb4) (GlcNAcβ4Manα3) Manβ4 binder PHA-E, Galβ4GlcNAc binder MAA, 3Galβ1-4GlcNAc and Galα1-3Gal binder MOA, αGlc binder LcHA, Lactose and Galactose binder CA, (GlcNAc) 2–4 binder STL, Mannose binderVVA-M, and α3GalNAc binder GS-I showed significant downregulation in LUAD (all adj.P.Val<0.05) (Table 3). The AUC value of GAL2 in LUAD was 0.922, the specificity was 1.000, the sensitivity was 0.750, and GAL2 offered good potential discriminatory ability. CA, GAL1, GAL3, GNA, LENTIL, MAA, NPA, PHA, PTL-1, SHA, SSA, the AUC values of 11 differentially expressed lectins were greater than 0.800 and less than 0.900, and the AUC values of the remaining 8 differentially expressed lectins were all between 0.700 and 0.800 (Figures S1 and S2). As shown in Figure 3B. ROC analysis of GAL2, PTL-1, GNA, SSA, LENTIL, CA, PHA-E, and MAA was shown. These 20 different lectins could distinguish the LUAD and NL groups for better clustering (Figure 3C). The above results indicated that the glycans were significantly altered in LUAD compared with NL groups. Thus, changes in glycopatterns in LUAD and healthy groups could serve as potential biomarkers.
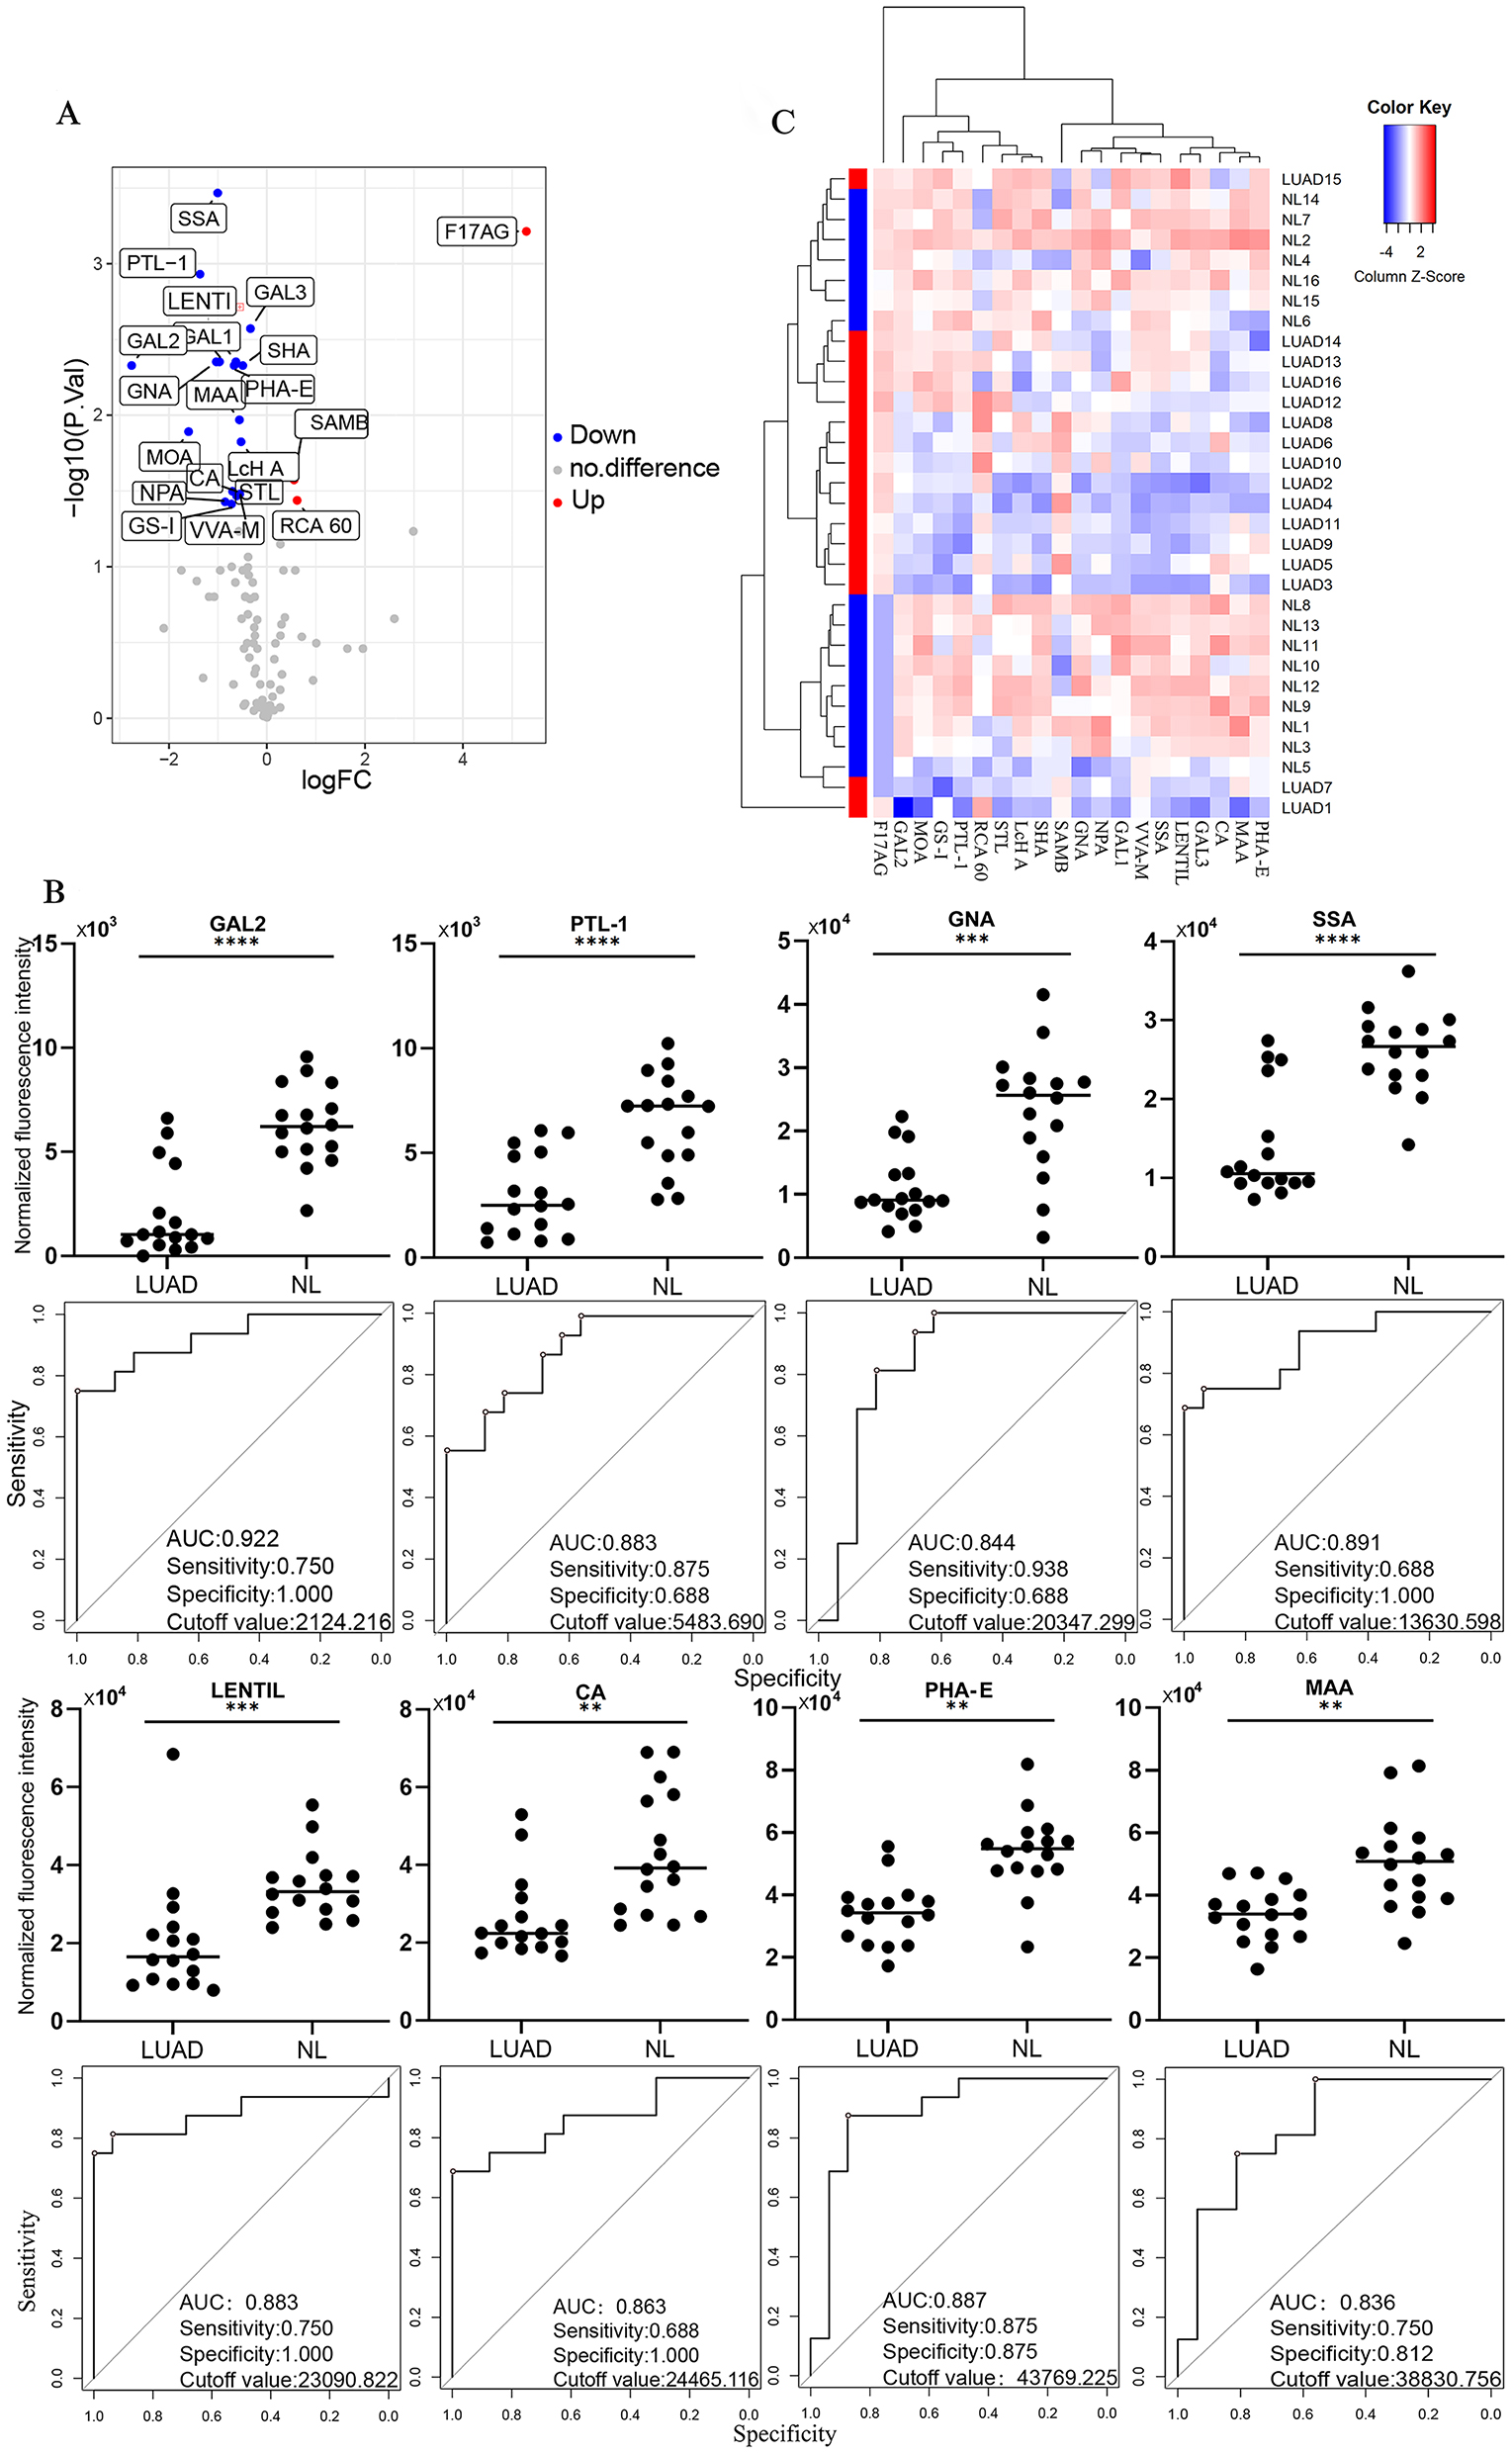
The altered plasma glycopatterns among the LUAD and NL groups. (A) Volcano plot of the difference between the LUAD group and the NL group. Red indicates up-regulated lectins, blue indicates down-regulated lectins, and grey indicates insignificant differences. (B) Lectin factors with significantly different signals and ROC analysis of candidate lectins in the LUAD group compared with the NL group, *p≤0.05. (C) The samples are rows, and the 20 candidate lectins are columns. The color and intensity of each square represent the expression level relative to the rest of the data in the row. Red, high, blue, low; white, medium.
The differentially expressed lectins in the LUAD group and the NL group.
| AveExp.LUAD | AveExp.NL | logFC | adj.P.Val | Foldchange | Regulation | |
|---|---|---|---|---|---|---|
| F17AG | 9.237649194 | 3.94499812 | 5.292651074 | 0.000611838 | 39.19644953 | Up |
| GAL2 | 9.780946495 | 12.54101419 | −2.760067696 | 0.004697693 | 0.147617156 | Down |
| MOA | 11.00150402 | 12.60021166 | −1.598707638 | 0.012831107 | 0.330172613 | Down |
| PTL-1 | 11.20273443 | 12.56741507 | −1.364680643 | 0.001170199 | 0.388320387 | Down |
| GNA | 13.2681531 | 14.30052215 | −1.032369047 | 0.004438886 | 0.488906657 | Down |
| SSA | 13.63549454 | 14.6397291 | −1.004234559 | 0.000341084 | 0.498534565 | Down |
| LENTIL | 14.07304114 | 15.04127466 | −0.968233513 | 0.004438886 | 0.511131528 | Down |
| NPA | 13.52147976 | 14.37327241 | −0.851792644 | 0.037304837 | 0.554095807 | Down |
| GS-I | 11.41656666 | 12.13678798 | −0.720221319 | 0.038500748 | 0.607004317 | Down |
| CA | 14.59436991 | 15.29553658 | −0.701166676 | 0.031786776 | 0.615074608 | Down |
| PHA-E | 14.99874538 | 15.66502412 | −0.666278742 | 0.004697693 | 0.630129937 | Down |
| GAL1 | 13.42403083 | 14.05483507 | −0.630804242 | 0.004438886 | 0.645816299 | Down |
| VVA-M | 13.47815612 | 14.09424515 | −0.616089022 | 0.034121059 | 0.652437214 | Down |
| RCA 60 | 12.79480282 | 12.17888956 | 0.615913262 | 0.036441136 | 1.532527819 | Up |
| MAA | 14.99896409 | 15.55969848 | −0.560734393 | 0.010735901 | 0.677956967 | Down |
| SAMB | 16.33587023 | 15.7809433 | 0.554926933 | 0.026735978 | 1.469094227 | Up |
| STL | 12.7445302 | 13.296606 | −0.552075801 | 0.033083532 | 0.682038082 | Down |
| LcH A | 12.7852057 | 13.31250898 | −0.527303279 | 0.014960433 | 0.693850485 | Down |
| SHA | 12.83151086 | 13.32336589 | −0.491855026 | 0.004697693 | 0.71111016 | Down |
| GAL3 | 14.4113405 | 14.74809747 | −0.336756962 | 0.002680655 | 0.791819246 | Down |
Alterations in plasma glycopatterns among the LUSC and NL groups
In our study, changes in NFIs for lectins in the LUSC group were not as significant as those in the LUAD group compared to the NL group. According to lectin screening of differential NFIs according to the corrected p value (adj.P.Val<0.05). p value correction was utilized to correct for false positives and to reduce the number of false positives. It was found that F17AG (LogFC=5.40, adj.P.Val=0.0008) conformed to screening conditions, and F17AG was significantly upregulated in LUSC, indicating that GlcNAc in LUSC was changed compared with that in the NL group (Figure 4A and B). The AUC of F17AG was 0.818, the specificity was 0.688, and the sensitivity was 0.938; thus, F17AG can be used as a potential diagnostic biomarker for LUSC and healthy people and provides a basis for distinguishing LUSC from healthy people (Figure 4C).

Changes in plasma glycopattern in the LUSC and NL groups. (A) Volcanic map of differences between the LUSC and NL groups. Red indicates up-regulated lectins, blue indicates down-regulated lectins, and grey indicates insignificant differences. (B) Differential expression of F17AG, *p≤0.05. (C) ROC analysis of F17AG.
Correlation analysis and combination analysis of candidate lectins
We analyzed the correlation of each group of candidate lectins, blue represents a positive correlation, red represents a negative correlation, the darker the color, the stronger the correlation, and X represents that there is no significant difference in the correlation. As shown in Figure 5A. Our study found that the correlation of PTL-1 with SHA and SSA was greater than 0.7500 in the comparison of the NSCLC and NL groups. In Figure 5B, we found that among the 20 candidate lectins in the LUAD and NL groups, the correlation coefficient between MOA and GAL1 was 0.9479, with a significant correlation. The correlation coefficients between SSA and PTL-1, GAL3, SHA, and VVA-M were all greater than 0.8000. The correlation coefficients between GAL3 and GNA and GAL2 were 0.8041 and 0.8275, respectively, indicating that they were significantly correlated. In addition to correlation analysis, we conducted a combined analysis of the candidate lectin factors. In the NSCLC group compared with the NL group, seven candidate differential lectins provided excellent diagnostic performance (AUC=0.990) (Figure 5C). In the LUAD group compared with the NL group, there were 20 candidate lectins. According to the AUC value and the intensity of NFIs of the lectin, we selected eight lectins, GAL2, PTL-1, GNA, SSA, LENTIL, CA, PHA-E, and MAA (AUC values are greater than 0.800), and carried out the logistic analysis. The combination of these eight candidate lectins provided excellent diagnostic value (AUC=1) (Figure 5D).

Correlation analysis and combination analysis of candidate lectins. (A) Correlation analysis of the NSCLC group and the NL group. (B) Correlation analysis of the LUAD group and NL group. (C) ROC analysis of candidate lectins between the NSCLC group and NL group. (D) ROC analysis of candidate lectins between the LUAD group and NL group.
Discussion
Protein glycosylation plays an important role in the study of cancer and alterations in glycoproteins as well as proteoglycans are a frequent feature of cancer cells [13]. Glycans are rich in biological information and are associated with important biological roles, including intercellular adhesion, angiogenesis, and cell migration [13]. Changes in the sialylation and fucosylation of N- and O-glycans play a role in the development of brain cancer [24]. In another study of altered serum glycans in NSCLC, the precursor of O-linked glycans, Tn antigen, was found to be significantly increased in lung adenocarcinoma serum compared to sera from healthy volunteers [25]. One study analyzed 633 colorectal cancer (CRC) patients and 478 age- and sex-matched controls to explore changes in plasma N-glycosylation between colorectal cancer patients and controls, and the study found statistically significant differences observed in plasma N-glycosomes at all stages of CRC [26]. Plasma indicators for α2-6 sialylation, β1-4 branching, β1-6 branching, and outer-arm fucosylation can differentiate between bladder cancer patients and healthy controls [27]. Consequently, glycosylation alterations in glycoconjugates present on surfaces or secreted by cancer cells are commonly used in the field of cancer biomarkers [28]. New glycan analysis tool lectin microarrays make it possible to quickly and sensitively analyze complex glycans without releasing them from their protein-bound state. High-throughput screening of glycans in intricate biological samples is now possible because of recent advancements in lectin microarray technology [29].
This study’s objective was to compare healthy samples with those from patients with early-stage NSCLC (LUAD and LUSC). Differences in NFIs of various lectins, which are detected by lectin chip technology, imply distinct glucose patterns in the plasma of NSCLC patients. A total of 48 samples were involved in our study, including 16 LUAD, 16 LUSC, and 16 NL samples. Both LUAD and LUSC were early-stage samples. The lectin chip we used contains 95 lectin factors, so it covers most of the glycan structures, which can more comprehensively detect the changes in plasma glycopatterns in early-stage NSCLC patients compared with NL patients and evaluate whether it can be used as a biomarker for early diagnosis. Through lectin signal detection and ROC analysis, it was found that PTL-1 and F17AG had significant changes in early-stage NSCLC patients, and the AUC of PTL-1=0.867 and the AUC of F17AG=0.809, which had good clinical diagnostic potential. The specific glycan structures that bind to PTL-1 are D-galactose and N-acetylglactosamine, and the one that binds to F17AG is GlcNAc, which means that these glycan structures in the healthy group exhibit signified changes in early NSCLC (LUAD + LUSC). It has been shown that the treatment of cancer cells with D-Gal transcriptionally upregulated genes is associated with necrophagocytosis and autophagy (Atg5, TIGAR). D-Gal does not activate caspase-3 but activates indicators of cellular autophagy [30]. Therefore, the downregulation of D-Gal in our study may be associated with the regulation of inhibition of tumor autophagy and promotion of tumor growth. Later, we discussed the LUAD and NL groups and the LUSC and NL groups. The study found that in LUAD, GalNAcα1-3Gal (Blood Group A) binder GAL2 was found to have good clinical diagnostic potential by ROC analysis, and its AUC=0.922, specificity was 1.000, and sensitivity was 0.750. GalNAcα1-3Gal was identified as a prognostic marker in cervical cancer [31]. It has been proposed that a macrophage galactose-type lectin (MGL) expressed by macrophages and dendritic cells specifically binds GalNAcα1-3Gal, and the loss of this antigen on tumor cells reduces or prevents recognition of MGL by expressing macrophages and dendritic cells, leading to evasion of host defenses [32]. Human serum contains GalNAcα1-3Gal binding antibodies, and tumor cells lacking GalNAcα1-3Gal avoid recognition by these antibodies; thus, tumor immune escape occurs [33]. Therefore, in our study, downregulation of GalNAcα1-3Gal in early LUAD plasma may be associated with immune escape from tumors and promote tumor development.
The analysis of the experimental results of our study was screened with a more stringent corrected p value. It was found in our study that F17AG was significantly increased in LUSC. The AUC of F17AG was 0.818. Five of our LUSC samples had COPD, which may also have been a factor in the results. Chronic obstructive pulmonary disease (COPD) is a common comorbidity of NSCLC, and patients with COPD have a higher risk of developing NSCLC than those without airway obstruction [34]. Therefore, further studies with larger samples are needed to explore the alterations in plasma glucose profiles in the healthy population vs. COPD patients, in COPD patients vs. early NSCLC patients, in COPD patients vs. early NSCLC patients with concurrent COPD, and in the healthy population vs. early NSCLC patients with concurrent COPD, to further validate plasma glycan biomarkers for the diagnosis of early LUSC.
Overall, the NFIs of F17AG were significantly enhanced in the three groups comparing the early-stage NSCLC vs. NL group. LUAD vs. NL group, and LUSC vs. NL group. The glycan that binds to F17AG is N-acetylglucosamine. The results indicated that N-acetylglucosamine was significantly increased in the plasma of patients with early-stage NSCLC. N-acetylglucosamine (GlcNAc) is a monosaccharide derivative of glucose, and can also be found in glycoproteins, proteoglycans, GAGs, and other components of connective tissue [35]. One study reported that GlcNAc was identified by metabolic methods as the most predictive metabolic marker for the severity of systemic mastocytosis, a hematopoietic tumor [36]. Compared with the healthy group, the increase in GlcNAc in NSCLC patients may be related to the metastatic growth of cells and metabolism. Thus, N-acetylglucosamine is altered in the plasma of patients with early-stage NSCLC and it may serve as a potential biomarker to differentiate between healthy and early-stage NSCLC patients.
This study still has some limitations. First, the sample size is small, and more samples need to be included in future experiments. Second, the content of the components in plasma is complex and has some individual variation related to the age of the patient, their physical condition, and whether they have other comorbidities. In our study, the LUSC group was older than the healthy group, and 87.5 % of the LUSC patients had a history of smoking. Smoking increases oxidative stress and the resulting DNA damage, which inhibits DNA repair and may be one of the driving factors for NSCLC [37]. Therefore, these could have been factors that influenced the results of our experiment. Therefore, the role of altered glycopatterns in plasma for the diagnosis of early-stage NSCLC needs to be further explored and validated to determine the diagnostic value of these diagnostic values of glycan biomarkers to differentiate NSCLC from benign lung disease and other types of cancer. Although there are limitations to this study, our study explored changes in plasma glycopatterns to help explore potential biological markers for early-stage NSCLC. We are also curious to see if mining potential biomarkers through lectins can be combined with other diagnostic techniques to improve the efficiency of early-stage lung cancer diagnosis.
Conclusions
This study investigated the altered plasma glycan patterns associated with early-stage NSCLC, systematically comparing the different plasma glycan patterns between NSCLC (LUAD and LUSC) and NL. The glycan pattern was altered in NSCLC compared to NL samples, with seven candidate lectins (F17AG, PTL-1, SSA, SAMB, GAL1, LcH A, SHA) having significantly altered NFIs. Combined analysis of these seven lectins revealed that these candidate lectins may have a discriminatory ability for NSCLC (AUC=0.990). F17AG was also significantly upregulated in LUSC with an AUC of 0.818 (adj.P.Val<0.05), suggesting that F17AG may have the potential to discriminate NL from LUSC. There were 20 candidate differential lectins in the LUAD group compared to the NL group, of which GAL2, PTL-1, GNA, SSA, LENTIL, CA, PHA-E, and MAA, the combination of eight candidate lectins, had a high potential to discriminate LUAD from NL (AUC=1.000). This study provides key information for differentiating early-stage NSCLC from NL based on altered plasma glycopatterns, which have great potential as biomarkers for the diagnosis of non-small cell lung cancer.
Funding source: The National Natural Science Foundation of China
Award Identifier / Grant number: 82173251
Funding source: The National Natural Science Foundation of China
Award Identifier / Grant number: 81974363
Funding source: The Fundamental Research Funds for the Central Universities
Award Identifier / Grant number: SCU2022D025
Funding source: The Science and Technology Achievement Transformation Fund of West China Hospital of Sichuan University
Award Identifier / Grant number: CGZH19013
Funding source: The Hospital Enterprise Cooperative Clinical Research Innovation Project
Award Identifier / Grant number: 2019HXCX004
Acknowledgments
Thanks to all the staff of the Institute of Respiratory Health, West China Hospital, Sichuan University for their support and suggestions.
-
Research funding: This research was supported by the Hospital Enterprise Cooperative Clinical Research Innovation Project (2019HXCX004), the National Natural Science Foundation of China (81974363), the National Natural Science Foundation of China (82173251), the Fundamental Research Funds for the Central Universities (SCU2022D025), the Science and Technology Achievement Transformation Fund of West China Hospital of Sichuan University (CGZH19013).
-
Author contributions: The authors confirm their contribution to the paper as follows: Li Zhang, Lingyan Zeng and Jinghong Xian conceived and designed the study; Shengqiang Mao, Lei Liu, and Hongyu Chen prepared the samples. Lingyan Zeng analyzed the data. Lingyan Zeng and Jinghong Xian wrote the manuscript. All authors reviewed the manuscript. All authors read and approved the final manuscript.
-
Competing interests: The authors declare that they have no conflicts of interest to report regarding the present study.
-
Informed consent: Not applicable.
-
Ethical approval: Ethical approval for this study (No. 1167/2020) was provided by the Ethics Committee on Biomedical Research, West China Hospital of Sichuan University on 18/12/2020.
References
1. Siegel, RL, Miller, KD, Jemal, A. Cancer statistics, 2016. CA Cancer J Clin 2016;66:7–30. https://doi.org/10.3322/caac.21332.Suche in Google Scholar PubMed
2. Auperin, A, Le Pechoux, C, Rolland, E, Curran, WJ, Furuse, K, Fournel, P, et al.. Meta-analysis of concomitant versus sequential radiochemotherapy in locally advanced non-small-cell lung cancer. J Clin Oncol 2010;28:2181–90. https://doi.org/10.1200/jco.2009.26.2543.Suche in Google Scholar
3. Martin-Sanchez, JC, Lunet, N, Gonzalez-Marron, A, Lidon-Moyano, C, Matilla-Santander, N, Cleries, R, et al.. Projections in breast and lung cancer mortality among women: a bayesian analysis of 52 countries worldwide. Cancer Res 2018;78:4436–42. https://doi.org/10.1158/0008-5472.can-18-0187.Suche in Google Scholar
4. Zheng, M. Classification and pathology of lung cancer. Surg Oncol Clin N Am 2016;25:447–68. https://doi.org/10.1016/j.soc.2016.02.003.Suche in Google Scholar PubMed
5. Travis, WD, Brambilla, E, Nicholson, AG, Yatabe, Y, Austin, JHM, Beasley, MB, et al.. The 2015 world Health organization classification of lung tumors: impact of genetic, clinical and radiologic advances since the 2004 classification. J Thorac Oncol 2015;10:1243–60. https://doi.org/10.1097/jto.0000000000000630.Suche in Google Scholar
6. Akash, S, Kumer, A, Rahman, MM, Emran, TB, Sharma, R, Singla, RK, et al.. Development of new bioactive molecules to treat breast and lung cancer with natural myricetin and its derivatives: a computational and SAR approach. Front Cell Infect Microbiol 2022;12:952297. https://doi.org/10.3389/fcimb.2022.952297.Suche in Google Scholar PubMed PubMed Central
7. Sultana, A, Alam, MS, Liu, X, Sharma, R, Singla, RK, Gundamaraju, R, et al.. Single-cell RNA-seq analysis to identify potential biomarkers for diagnosis, and prognosis of non-small cell lung cancer by using comprehensive bioinformatics approaches. Transl Oncol 2023;27:101571. https://doi.org/10.1016/j.tranon.2022.101571.Suche in Google Scholar PubMed PubMed Central
8. Li, W, Liu, HY, Jia, ZR, Qiao, PP, Pi, XT, Chen, J, et al.. Advances in the early detection of lung cancer using analysis of volatile organic compounds: from imaging to sensors. Asian Pac J Cancer Prev 2014;15:4377–84. https://doi.org/10.7314/apjcp.2014.15.11.4377.Suche in Google Scholar PubMed
9. Xing, L, Su, J, Guarnera, MA, Zhang, H, Cai, L, Zhou, R, et al.. Sputum microRNA biomarkers for identifying lung cancer in indeterminate solitary pulmonary nodules. Clin Cancer Res 2015;21:484–9. https://doi.org/10.1158/1078-0432.ccr-14-1873.Suche in Google Scholar
10. National Lung Screening Trial Research Team, Aberle, DR, Adams, AM, Berg, CD, Black, WC, Clapp, JD, et al.. Reduced lung-cancer mortality with low-dose computed tomographic screening. N Engl J Med 2011;365:395–409. https://doi.org/10.1056/nejmoa1102873.Suche in Google Scholar
11. Thakur, SK, Singh, DP, Choudhary, J. Lung cancer identification: a review on detection and classification. Cancer Metastasis Rev 2020;39:989–98. https://doi.org/10.1007/s10555-020-09901-x.Suche in Google Scholar PubMed
12. Reis, CA, Osorio, H, Silva, L, Gomes, C, David, L. Alterations in glycosylation as biomarkers for cancer detection. J Clin Pathol 2010;63:322–9. https://doi.org/10.1136/jcp.2009.071035.Suche in Google Scholar PubMed
13. Pinho, SS, Reis, CA. Glycosylation in cancer: mechanisms and clinical implications. Nat Rev Cancer 2015;15:540–55. https://doi.org/10.1038/nrc3982.Suche in Google Scholar PubMed
14. Hakomori, S. Glycosylation defining cancer malignancy: new wine in an old bottle. Proc Natl Acad Sci U S A 2002;99:10231–3. https://doi.org/10.1073/pnas.172380699.Suche in Google Scholar PubMed PubMed Central
15. Nakamori, S, Kameyama, M, Imaoka, S, Furukawa, H, Ishikawa, O, Sasaki, Y, et al.. Involvement of carbohydrate antigen sialyl lewis(x) in colorectal cancer metastasis. Dis Colon Rectum 1997;40:420–31. https://doi.org/10.1007/bf02258386.Suche in Google Scholar
16. Fu, C, Zhao, H, Wang, Y, Cai, H, Xiao, Y, Zeng, Y, et al.. Tumor-associated antigens: Tn antigen, sTn antigen, and T antigen. HLA 2016;88:275–86. https://doi.org/10.1111/tan.12900.Suche in Google Scholar PubMed
17. da Costa, V, van Vliet, SJ, Carasi, P, Frigerio, S, Garcia, PA, Croci, DO, et al.. The Tn antigen promotes lung tumor growth by fostering immunosuppression and angiogenesis via interaction with macrophage galactose-type lectin 2 (MGL2). Cancer Lett 2021;518:72–81. https://doi.org/10.1016/j.canlet.2021.06.012.Suche in Google Scholar PubMed
18. Dube, DH, Bertozzi, CR. Glycans in cancer and inflammation--potential for therapeutics and diagnostics. Nat Rev Drug Discov 2005;4:477–88. https://doi.org/10.1038/nrd1751.Suche in Google Scholar PubMed
19. Hirabayashi, J, Kuno, A, Tateno, H. Development and applications of the lectin microarray. Top Curr Chem 2015;367:105–24. https://doi.org/10.1007/128_2014_612.Suche in Google Scholar PubMed
20. Dan, X, Liu, W, Ng, TB. Development and applications of lectins as biological tools in biomedical research. Med Res Rev 2016;36:221–47. https://doi.org/10.1002/med.21363.Suche in Google Scholar PubMed
21. Ashraf, GM, Perveen, A, Tabrez, S, Zaidi, SK, Kamal, MA, Banu, N. Studies on the role of goat heart galectin-1 as a tool for detecting post-malignant changes in glycosylation pattern. Saudi J Biol Sci 2015;22:85–9. https://doi.org/10.1016/j.sjbs.2014.07.008.Suche in Google Scholar PubMed PubMed Central
22. Shu, J, Yu, H, Li, X, Zhang, D, Liu, X, Du, H, et al.. Salivary glycopatterns as potential biomarkers for diagnosis of gastric cancer. Oncotarget 2017;8:35718–27. https://doi.org/10.18632/oncotarget.16082.Suche in Google Scholar PubMed PubMed Central
23. Bertok, T, Jane, E, Chrenekova, N, Hroncekova, S, Bertokova, A, Hires, M, et al.. Analysis of serum glycome by lectin microarrays for prostate cancer patients – a search for aberrant glycoforms. Glycoconj J 2020;37:703–11. https://doi.org/10.1007/s10719-020-09958-4.Suche in Google Scholar PubMed
24. Veillon, L, Fakih, C, Abou-El-Hassan, H, Kobeissy, F, Mechref, Y. Glycosylation changes in brain cancer. ACS Chem Neurosci 2018;9:51–72. https://doi.org/10.1021/acschemneuro.7b00271.Suche in Google Scholar PubMed PubMed Central
25. Liang, Y, Han, P, Wang, T, Ren, H, Gao, L, Shi, P, et al.. Stage-associated differences in the serum N- and O-glycan profiles of patients with non-small cell lung cancer. Clin Proteonomics 2019;16:20. https://doi.org/10.1186/s12014-019-9240-6.Suche in Google Scholar PubMed PubMed Central
26. Doherty, M, Theodoratou, E, Walsh, I, Adamczyk, B, Stockmann, H, Agakov, F, et al.. Plasma N-glycans in colorectal cancer risk. Sci Rep 2018;8:8655. https://doi.org/10.1038/s41598-018-26805-7.Suche in Google Scholar PubMed PubMed Central
27. Ferdosi, S, Ho, TH, Castle, EP, Stanton, ML, Borges, CR. Behavior of blood plasma glycan features in bladder cancer. PLoS One 2018;13:e0201208. https://doi.org/10.1371/journal.pone.0201208.Suche in Google Scholar PubMed PubMed Central
28. RodrIguez, E, Schetters, STT, van Kooyk, Y. The tumour glyco-code as a novel immune checkpoint for immunotherapy. Nat Rev Immunol 2018;18:204–11. https://doi.org/10.1038/nri.2018.3.Suche in Google Scholar PubMed
29. Dang, K, Zhang, W, Jiang, S, Lin, X, Qian, A. Application of lectin microarrays for biomarker discovery. ChemistryOpen 2020;9:285–300. https://doi.org/10.1002/open.201900326.Suche in Google Scholar PubMed PubMed Central
30. Li, N, He, Y, Wang, L, Mo, C, Zhang, J, Zhang, W, et al.. D-galactose induces necroptotic cell death in neuroblastoma cell lines. J Cell Biochem 2011;112:3834–44. https://doi.org/10.1002/jcb.23314.Suche in Google Scholar PubMed
31. Li, Q, Anver, MR, Li, Z, Butcher, DO, Gildersleeve, JC. GalNAcalpha1-3Gal, a new prognostic marker for cervical cancer. Int J Cancer 2010;126:459–68. https://doi.org/10.1002/ijc.24716.Suche in Google Scholar PubMed PubMed Central
32. van Vliet, SJ, van Liempt, E, Saeland, E, Aarnoudse, CA, Appelmelk, B, Irimura, T, et al.. Carbohydrate profiling reveals a distinctive role for the C-type lectin MGL in the recognition of helminth parasites and tumor antigens by dendritic cells. Int Immunol 2005;17:661–9. https://doi.org/10.1093/intimm/dxh246.Suche in Google Scholar PubMed
33. Oyelaran, O, Li, Q, Farnsworth, D, Gildersleeve, JC. Microarrays with varying carbohydrate density reveal distinct subpopulations of serum antibodies. J Proteome Res 2009;8:3529–38. https://doi.org/10.1021/pr9002245.Suche in Google Scholar PubMed PubMed Central
34. Qi, C, Sun, SW, Xiong, XZ. From COPD to lung cancer: mechanisms linking, diagnosis, treatment, and prognosis. Int J Chronic Obstr Pulm Dis 2022;17:2603–21. https://doi.org/10.2147/copd.s380732.Suche in Google Scholar
35. Liu, Y, Li, Z, Liu, G, Jia, J, Li, S, Yu, C. Liquid chromatography-tandem mass spectrometry method for determination of N-acetylglucosamine concentration in human plasma. J Chromatogr B Anal Technol Biomed Life Sci 2008;862:150–4. https://doi.org/10.1016/j.jchromb.2007.11.043.Suche in Google Scholar PubMed
36. Agopian, J, Da Costa, Q, Nguyen, QV, Scorrano, G, Kousteridou, P, Yuan, M, et al.. GlcNAc is a mast-cell chromatin-remodeling oncometabolite that promotes systemic mastocytosis aggressiveness. Blood 2021;138:1590–602. https://doi.org/10.1182/blood.2020008948.Suche in Google Scholar PubMed
37. Paz-Elizur, T, Krupsky, M, Blumenstein, S, Elinger, D, Schechtman, E, Livneh, Z. DNA Repair Activity for Oxidative Damage and Risk of Lung Cancer. JNCI (J Natl Cancer Inst) 2003;95:1312–9. https://dx.doi.org/10.1093/jnci/djg033.10.1093/jnci/djg033Suche in Google Scholar PubMed
Supplementary Material
This article contains supplementary material (https://doi.org/10.1515/oncologie-2023-0084).
© 2023 the author(s), published by De Gruyter, Berlin/Boston
This work is licensed under the Creative Commons Attribution 4.0 International License.
Artikel in diesem Heft
- Frontmatter
- Review Article
- Ethosomes as delivery system for treatment of melanoma: a mini-review
- Research Articles
- Pre-treatment predictors of cardiac dose exposure in left-sided breast cancer radiotherapy patients after breast conserving surgery
- Glycoprofiling of early non-small cell lung cancer using lectin microarray technology
- Overexpression of TRIM28 predicts an unfavorable prognosis and promotes the proliferation and migration of hepatocellular carcinoma
- MiRNA-219a-1-3p inhibits the malignant progression of gastric cancer and is regulated by DNA methylation
- The effect of ubiquitin-specific peptidase 21 on proliferation, migration, and invasion in DU145 cells
- Automatic prediction model of overall survival in prostate cancer patients with bone metastasis using deep neural networks
- Clinical neutrophil-related gene helps treat bladder urothelial carcinoma
- Forkhead Box P4 promotes the proliferation of cells in colorectal adenocarcinoma
- Effect of a CrossMab cotargeting CD20 and HLA-DR in non-Hodgkin lymphoma
- Case Reports
- Endoscopic resection of gastric glomus tumor: a case report and literature review
- Long bone metastases of renal cell carcinoma imaging features: case report and literature review
- The Warthin-like variant of papillary thyroid carcinomas: a clinicopathologic analysis report of two cases
- Corrigendum
- Corrigendum to: Experience of patients with metastatic breast cancer in France: results of the 2021 RÉALITÉS survey and comparison with 2015 results