
Assessing the significance of socioeconomic and demographic factors on COVID-19 cases in Turkey along with the development levels of provinces
-
Cenk Icoz
 and
Erdener Ozcetin
and
Erdener Ozcetin

Abstract
In this study, we examine the spatial analysis of coronavirus disease 2019 (COVID-19) instances in Turkey. As a result, this analysis reveals that the geographic distribution of COVID-19 instances is associated with disparities in education, socioeconomic status, and population within individual provinces. By utilizing a composite indicator of development level based on provinces, we employ multivariate local Geary and multivariate local neighbor match tests to demonstrate the association between COVID-19 instances and the demographic and socioeconomic similarities or contrasts in provinces of Turkey. In addition, we provide an extremely randomized tree regression model to show how demographic and socioeconomic disparities affect COVID-19 instances. According to this model, the average household size, the proportion of the working-age population to the nonworking-age population, and the GDP per capita are the most important variables. The study’s main finding is that the important variables that were attained were also used to create an index for the degree of development in the Turkish regions. In other words, the same variables correlate with the degree of provincial development and the distribution of COVID-19 cases.
1 Introduction
The coronavirus disease 2019 (COVID-19), which first appeared in the Wuhan Province of China at the beginning of December 2019, has affected the whole world over time. With the rapid spread of the disease all over the world, it was declared a pandemic by the World Health Organization on March 11, 2020. The COVID-19 pandemic has had a significant impact on people’s lives and the global economy. It has caused widespread illness and death, disrupted social and economic activity, and led to the implementation of measures such as lockdowns, travel restrictions, and mask mandates in an effort to slow the spread of the virus [1].
It is well established that the impact of the COVID-19 pandemic has not been evenly distributed and that certain communities have been disproportionately affected by the virus. Socioeconomic factors such as income, education, and occupation can all play a role in the spread and severity of the disease [2]. There have been remarkable studies on this subject in the literature recently. The previous studies such as refs. [1,3,4,5,6,7] are some examples of studies examining the socioeconomic factors and other factors such as meteorological, demographic, and educational impacts on COVID-19 cases or deaths. For example, people who live in low-income areas may be more vulnerable to the virus due to a lack of access to healthcare, living in crowded conditions, and being unable to take time off work due to financial constraints. Martines et al., Karácsonyi et al., and Neelon et al. [8,9,10] examined these vulnerabilities and inequalities in Brazil, Australia, and the United States, respectively. Studies are proving that the meteorological factors influence the outbreak and the progress of the pandemic, for example, the studies by Wang et al. and Wu and Zhang [3,11]. For instance, average weather temperature, humidity, and environmental factors like weather quality and pollutants in weather might play a role in the transmission of the virus. A specific example is sulphur dioxide, which is an environmental factor, a pollutant in weather that might have a positive effect on the transmission of the virus. Especially in cities like Zonguldak, which has coal mines, a high pollutant ratio in weather might contribute the higher COVID-19 cases.
There is no doubt that machine learning has played a significant role in the fight against COVID-19. Machine learning algorithms can be used to analyse large amounts of data to identify patterns and trends that can help researchers and policymakers understand the spread of the virus and predict how it might evolve. Machine learning has been used to analyse data on the movements of people to identify potential hotspots for the spread of the virus and to predict the likelihood of future outbreaks. Malik et al. and Khan et al. [12,13] used class rule mining and pattern matching to determine the factors that are effective in COVID-19 deaths by using class rule matching. It has also been used to analyse data on the effectiveness of different interventions, such as lockdowns and mask mandates, to help inform decision-making about how to respond to the pandemic [14]. In addition, machine learning has been used to develop predictive models that can help identify individuals who are at high risk of severe illness or death from COVID-19, so that they can receive targeted care [15]. Overall, machine learning has been a powerful tool in the fight against COVID-19, helping to inform our understanding of the virus and guide our response to it [16].
Many studies of the COVID-19 pandemic have not considered the spatial variation in the rate of deaths from the virus and the factors that may contribute to this variation. However, it is important to recognize that the spatial variation in COVID-19 deaths reflects fundamental differences in demographics and socioeconomic factors across different regions and communities. These factors can include differences in population density, access to healthcare, living conditions, and other factors that can influence the spread and severity of the virus. By considering the spatial variation in COVID-19 deaths and the factors that contribute to it, researchers and policymakers can better understand the disproportionate impact of the pandemic on certain communities and develop targeted interventions to address these disparities.
Geographically weighted regression (GWR) is a statistical method that allows researchers to examine how the relationship between predictor variables and an outcome variable varies across different locations. In the context of COVID-19, GWR has been used in some studies [5,11,17]. Multiscale geographically weighted regression (MGWR) is a variant of GWR that allows researchers to examine how the relationships between variables vary at multiple scales, rather than just at the local level. Iyanda et al. and Mansour et al. [18,19] studied MGWR for COVID-19. Spatial lag model (SLM) and spatial error model (SEM) are statistical methods that account for spatial dependence and heterogeneity in the data. Sannigrahi et al. [6] and Neşe and Bakir [7] have proposed SLM and SEM models in the context of COVID-19.
In addition, machine learning-based nonlinear regressors are becoming popular among researchers. Luo et al. [20] have developed a local nonlinear nonparametric regression model named geographically weighted random forest to estimate the nonlinear relationship between COVID-19 death rates and other factors. Grekousis et al. [21] have proposed a nonlinear non-parametric geographical random forest model that can address both spatial heterogeneity and nonlinear relationships. To obtain more detailed information about machine learning applications for COVID-19, readers are recommended to investigate the study by Heidari et al. [22].
In this study, we consider revealing important features that affect COVID-19 cases in Turkey along with the spatial relationships (clusters) between COVID-19 cases and development levels of the provinces. The main contribution of the study is to determine the effects of the demographic, social, economic, health, and environmental factors on COVID-19 cases in Turkey. In addition, the hypothesis put forward in the study is that the development level of the provinces and the number of cases related to COVID-19 disease have a significant spatial relationship. This relationship has been demonstrated by various spatial tests locally.
The limitation of the study is the inaccessibility of how many of the COVID-19 cases resulted in death and the inability to consider COVID-19-related deaths as a dependent variable in addition to cases. Furthermore, the most recent values of some variables are not available, and some variables that may have an impact on COVID-19 cases, such as mobility between provinces, are not available. The most difficult point in the study is the provision of data and the use of different data sources. In addition, we could not take into account of vaccination process in our study. The vaccination process was started on February 14, 2021, which is a close date to the beginning date of our selection of COVID-19 case data.
To the best of our knowledge, our study is important in terms of including explanatory variables in many diverse fields for the first time that affect the number of COVID cases in Turkey. In addition, it will be recorded as a study that takes into account the hypothesis of the relationship between the development level of the provinces and the number of COVID-19 cases spatially. Some of the variables used in determining the development level of provinces have also been tried to be used in the classification analysis of COVID cases employing machine learning methods. Another important hypothesis is that the parallelism of the factors that affect the development index of the provinces also plays a prominent role in the spread of a pandemic in a developing country.
The rest of our article is organized as follows. In Section 2, we explain materials and methodology in detail. In Section 3, we report the computational results, illustrations, and comparisons. We remark on important discussion with literature comparison in Section 4. Finally, we provide the concluding remarks and suggest some future works in Section 5.
2 Materials and methodology
In the following subsections, first, we briefly explain the data source, and then we discuss multivariate local Geary, local neighbour match test, and extremely randomized trees regression.
2.1 Data source
In Turkey, the Ministry of Health shares weekly COVID case counts on a provincial basis. The only data shared spatially are the weekly number of COVID cases. These data are visualized interactively on the relevant website of the Ministry of Health through geographic information systems applications. On the other hand, only the previous week’s data are announced and not stored in any database. Since there is no official database for the data to be used in the study, the relevant data were obtained from a website that is an open data portal and collects the data of the Ministry of Health from the Internet (https://turCOVID19.com/acikveri) [23].
The data include 58 weeks of COVID-19 cases between February 8, 2021, and March 19, 2022. For the analysis of the number of cases, the sum of all weeks is considered. There are 81 provinces in Turkey. The data on the development level of the provinces are taken from the Socio-Economic Development Ranking Survey (SEGE) 2017, which is periodically organized by the Ministry of Industry and Technology. In determining the development ranking of the provinces, 52 different variables under 8 different headings were used. These headings are demography, employment, health, education, finance, accessibility, competitive and innovative capacity, and quality of life. The variables were standardized, and the robust principal components analysis was used to determine the development indices of provinces. The first eigenvector was selected to determine the most important variables in development levels of provinces that explained 42.5% of the total variance. Furthermore, it was mentioned as a general causal factor. Nine eigenvectors absorbed approximately 84% proportion of the variance. First, 15 variables according to robust principal component analysis are was given with weights in the appendix.
In most studies, the spatial relationship between COVID-19 cases and the development level of the provinces has been directly modelled by regression analyses (spatial or linear) based on variables, or correlation analyses have been applied (linear correlation).
In this case, the spatial examination of the relationship between the development level index and the number of COVID-19 cases with multivariate spatial autocorrelation analyses is studied. To our knowledge, this is the first study for Turkey in the literature. A literature review was conducted for the explanatory variables selected for the study, and many variables related to social, demographic, economic, environmental, and health fields used in the literature that may have an impact on the disease and available for our sample were considered. The explanatory variables used in the study and their explanations, as well as the sources from the variables were obtained are given in Table 1.
Variable Explanation Chart
| Label | Variable name | Source |
|---|---|---|
| A | Pm10 particles related to air quality | T.C. Ministry of Environment, Urbanisation and Climate Change 2017 |
| B | SO2 (sulphur dioxide) | T.C. Ministry of Environment, Urbanisation and Climate Change 2017 |
| C | Population density | TURKSTAT 2021 |
| D | Unemployment | Unemployment rate by NUTS 2 regions EUROSTAT |
| E | GDP per capita ($) | TURKSTAT 2021 |
| F | Hospital beds | TURKSTAT 2020 |
| G | Number of physicians | TURKSTAT 2020 |
| H | Average household size | TURKSTAT 2021 |
| I | Automobile number(per thousand) | TURKSTAT 2021 |
| J | Literacy | TURKSTAT 2020 |
| K | Disease of circulatory system | TURKSTAT 2017 |
| L | Disease of respiratory system | TURKSTA 2017 |
| M | Elderly dependency ratio | TURKSTAT 2021 |
| N | Age 20–39 (%) | TURKSTAT 2021 |
| O | Age 40–59 (%) | TURKSTAT 2021 |
| P | Age 60–79 (%) | TURKSTAT 2021 |
| R | Age 80+ (%) | TURKSTAT 2021 |
| S | Endocrine, nutritional, and metabolic diseases | TURKSTAT 2017 |
| Y | COVID-19 cases | 58 weeks of aggregated weekly number of COVID-19 cases per 100,000 people in provinces. (Note: not adjusted according to population. Total sum of cases in provinces.) |
2.2 Multivariate local Geary
In the literature, spatial autocorrelation analysis is mostly based on a univariate setting. Local and global values to assess spatial autocorrelation are widely used, and the prominent measures for spatial autocorrelation are Moran’s I and Geary’s C values [24,25,26]. However, the multivariate association of variables spatially is still an ongoing problem. To overcome this issue, the study by Geary [27] proposed a multivariate version of the local Geary statistic. The purpose of the statistic is to match if the neighbours in multivariate space are spatially neighbours too. The limitation of the statistic is it can be easily affected by the curse of dimensionality.
The statistic is given with the following formula:
Measure calculates the weighted average of the squared distances in multidimensional space between the values observed at location i and its spatial neighbours
2.3 Local neighbor match test
Local neighbor Match test was proposed by Anselin [28], which is mainly a perspective to visualize and to determine the tradeoff between geographical and variable similarity. The idea behind the test is to evaluate the degree of overlap between k-nearest neighbours in geographical space and k-nearest neighbours in multi-attribute space. The probability of an overlap seen between two neighbour sets can be quantified using the intersection between two k-nearest neighbour weights matrices – one is for variables and the other is for spatial distance. For further details, see the study by Anselin [28] and https://geodacenter.github.io/workbook/6c_local_multi/lab6c.html.
2.4 Extremely randomized trees regression
Ensemble methods are used to improve the performance of a machine learning model by combining the predictions of multiple models. The idea is that multiple models can outperform a single model by capturing different aspects of the data. This can lead to reduced overfitting and improved generalization performance on unseen data. There are several ensemble methods, such as bagging, boosting, and stacking, that can be used depending on the type of data and the problem at hand. Extra-Trees (or extremely randomized trees) algorithm can be defined as a stacking strategy that was developed as an extension of random forest algorithm that developed by Breiman [29].
In this method, randomness is injected into the tree-building process by using random thresholds for each feature rather than searching for the best possible threshold. This makes Extra-Trees more computationally efficient than traditional random forests, but also less able to find the optimal solution. It is useful in cases when there are a lot of input features, and overfitting needs to be avoided [30]. The Extra-Trees method is available for both classification and regression problems. If we focus on regression problems, the Extra-Trees regressor (ETR) builds an ensemble of unpruned regression trees according to the classical top-down procedure. From a computational point of view, the complexity of the tree growing procedure lies in the n log n scheme with respect to the learning sample size. In addition, the time complexity of the decision tree growing procedure depends on the implementation details of the algorithm and the hyperparameters used, and the complexity can vary widely depending on the specific case. The popularity of this method has been increasing since it was first introduced. Among the studies conducted in recent years, the studies by Lundberg et al. [31], Aminifar et al. [32], and Khan et al. [33] draw attention.
We use the following standard metrics that can be used to assess the goodness-of-fit and overall performance of an ETR model. Mean squared error (MSE) measures the average of the squared differences between the predicted and actual values. Root mean squared error (RMSE) (equation (2)) is the square root of the MSE and is also commonly used to evaluate regression models.
The essential preliminary studies were made about data regularization and hyperparameters of the method. In line with these studies, it was decided to use min–max scaling to regularize the data. In addition, hyperparameters are tweaked by employing grid search.
3 Results
The computational results and discussions have been conducted in this section. In addition, explanatory illustrations are used to highlight the results.
3.1 Spatial analyses
Geographical regions and provinces of Turkey are given in Figure 1a and b. Figure 1 is created using QGIS, which is an open source geographical information system software [34].

(a) Provinces of Turkey. (b) Color-coded geographical regions of Turkey.
First, the cumulative number of COVID-19 cases for the 58-week period included is given as a Natural Breaks Map in Figure 2. Since the development index for Turkey is analysed in six groups, the number of cases is also analysed in six groups. The striking situation is that the number of cases in the western and northern parts of the country is higher than in other regions.

Cumulative number of COVID-19 cases at 58 weeks.
In Figure 3, the scores of the development index of the provinces are given as a natural breaks map divided into six groups. Although Turkey is a developing country, there are large differences in terms of development between the western and eastern provinces of the country. Figure 2 shows that most of the western provinces have positive scores and are in the top three groups in terms of development. On the contrary, eastern provinces have negative index scores and show low development (lower than −0.224).

Development scores map of provinces.
There are certain overlaps in terms of colour in both maps. To evaluate these similarities, we have decided to apply multivariate local Geary analysis and local neighbor match tests, which is a multivariate local spatial analysis. Figure 4 shows the results of multivariate local Geary analysis on the map of Turkey. According to the results, multivariate spatial autocorrelation was found to be statistically significant in 52 provinces. Multivariate spatial autocorrelation between COVID-19 cases and development levels in provinces in the Black Sea and Central Anatolia regions, along with the southeastern and eastern Anatolia, and Mediterranean regions, is notable.

Multivariate local Geary analysis results.
In Figure 5, the positive autocorrelation given in Figure 4 is presented with statistical significance levels at certain confidence levels. As a result of the analysis, 14 provinces at p = 0.001, 23 provinces at p = 0.01, and 15 provinces at p = 0.05 are statistically significant. In 29 provinces, multivariate spatial autocorrelation is not observed. Statistically significant multivariate autocorrelation at the p = 0.001 level is observed especially in Eastern Anatolia, where the level of development is low, and in Antalya, Muğla, and Denizli, where the level of development is high.

Multivariate local Geary analysis significance map.
To explain the multivariate spatial autocorrelation in the regions, parallel coordinates plots between the provinces and variables in the selected regions are given in Figure 6. This figure shows the selected provinces in the Eastern Anatolia region and their values on the two variables subject to the research on the parallel coordinate graph. Here, the cumulative COVID-19 cases are quite low compared to other provinces and the low level of development of the selected provinces in Turkey. Finally, 9 of the 10 selected provinces are highly significant with p = 0.001 and 1 province is highly significant with p = 0.05.
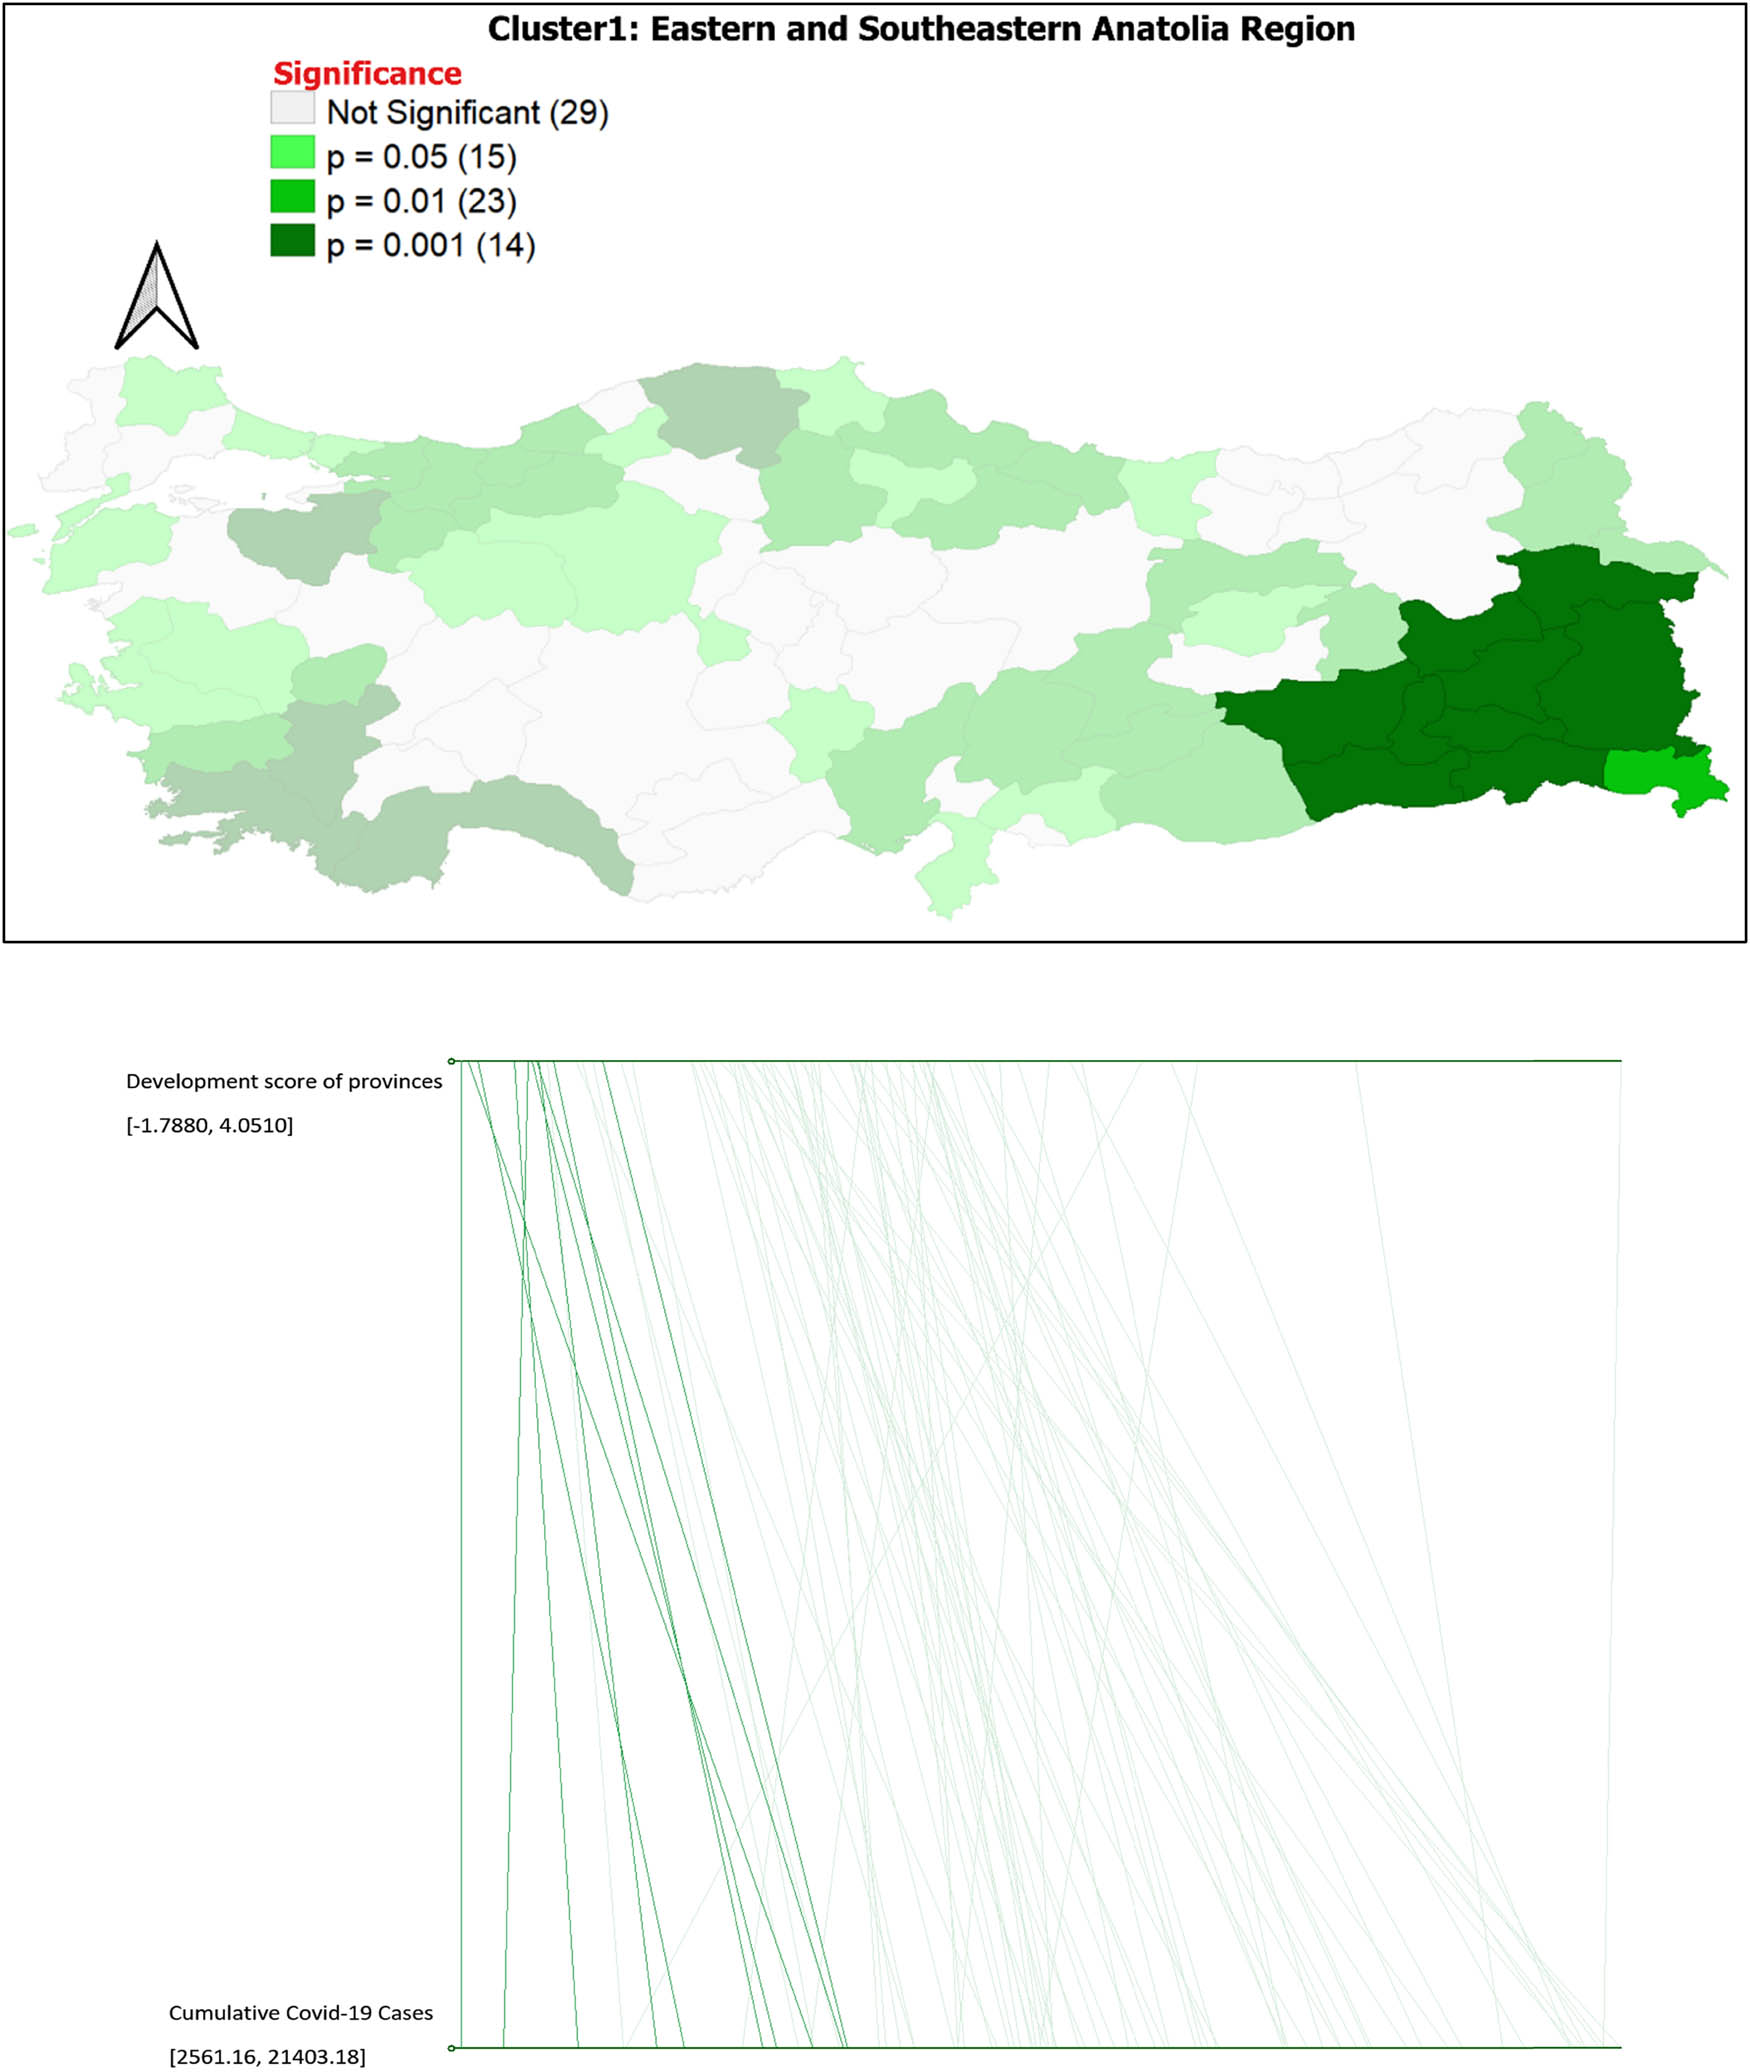
Parallel coordinates graph and 10 selected provinces in eastern and southeastern Anatolia.
Figure 7 shows three selected provinces (Antalya, Denizli, and Muğla) in the Mediterranean region and their values on the two variables subject to the research on the parallel coordinates’ graph. Although the cumulative COVID-19 cases here are around the average compared to other provinces, these provinces have scores above the average in the development level and are even in the top 10. In three provinces, there is a positive autocorrelation with the level of development (p = 0.001).

Parallel coordinates graph and three selected provinces in the Mediterranean and Aegean regions.
Figure 8 shows 11 selected provinces in the Marmara and Central Anatolia regions and their values on the two variables subject to the research on the parallel coordinate graph. These provinces include Istanbul, a global metorpolis, and Ankara, the capital of Turkey. It is notable that the cumulative COVID-19 cases were the highest here, and these provinces have high levels of development. In addition, it is clear that the two variables show high values together as well as their spatial relationship.

Parallel coordinates graph and 11 selected provinces in Marmara and Central Anatolia regions.
Figure 9 represents eight selected provinces in the Black Sea region and their values on the two variables subject to the research on the parallel coordinates’ graph. The feature that distinguishes this region from other regions is the high number of COVID-19 cases despite having provinces at an average level of development.

Parallel coordinates graph and eight selected provinces in the Black Sea region.
Figure 10 shows the results of the local neighbor match test. Here, four neighbours of five provinces, 3 neighbours of 5 provinces, and 2 neighbours of 25 provinces were found to be close to each other. Red dash in Figure 10 represents the neighbourhood linkage that means these provinces are alike both spatially and in multivariate space. For instance, province of Muğla in the Mediterranean region has four similar provinces. Similarities between the local neighbour match test and the results of the multivariate local Geary analysis are striking. In detail, Muğla clusters together with four provinces according to the local match test. However, according to Figure 4, there is no multivariate local autocorrelation with Antalya, with which it shows a significance level of p = 0.001. Nevertheless, apart from these nuances, both analyses identify clusters close to each other.

Local neighbour match test analysis results (cardinality map).
3.2 Extra-trees regressor results
ETR, one of the machine learning methods, was used in the study to analyse the COVID-19 incidences across provinces of Turkey with spatial data. The method’s hyperparameters and data regularization were the subjects of the preliminary studies. Min–max scaling was utilized to regularize the data in accordance with these findings. In addition, hyperparameters are tweaked by applying grid search, and our rates for splitting data are 75/25, where 75% of the data are used for training a model, while 25% is used for testing it. We also handle K nearest neighbours, bagging, random forest, and Adaboost to compare with the ETR output. In Table 2, models’ assessment metrics can be seen. These results indicate that ETR is more accurate than others with higher
Results of regressors
| Model | RMSE | R 2 |
|---|---|---|
| Extra-trees | 3394.19 | 0.51 |
| K nearest neighbours | 3613.77 | 0.45 |
| Bagging | 3915.15 | 0.35 |
| Random forest | 3788.51 | 0.39 |
| Adaboost | 3633.99 | 0.44 |
Figure 11 illustrates the significance of the independent factors for the ETR. In particular, the effect of average household size on COVID-19 cases appears to be quite large. In addition, the importance of the old-age to working-age demographic ratio, GDP per capita, and unemployment rate is also remarkable. The gross domestic product of the provinces, literacy rate, automobile number (per thousand), average household size, elderly dependency ratio, and unemployment are the most important six factors according to the ETR result.

Sorted feature importances.
We also investigate partial dependence plots (Figure 12). According to these plots, it can be said that there is a linear relationship in some variables, which are observed to have a low effect, especially in the number of COVID-19 cases. The most significant variable, average household size (H), showed a nonlinear relationship. It is noteworthy that the number of COVID cases is high when the average household size is low, while the number of cases decreases as the value of the variable increases. An inversely proportional relationship is observed with the dependent variable of COVID-19 cases. The interesting situation here is that a higher number of average household size for infectious diseases is expected to contribute to an increase in the number of cases. This negative relationship could be explained by the possible inverse relationship between the development index of provinces and household size and correlation of other factors like income, education level, conservativeness, and hesitancy of getting tested. The hesitancy of getting tested is mostly about both religious concerns and also about the missing work. Some companies deduct the wages of workers because of absence from work. However, in the majority, in public and private sector workers, 1 week sickness report was given automatically to be quarantined after one was diagnosed with a positive PCR test. Most people have easy access to PCR tests especially in provinces and metropolis of the country in both public and private hospitals. In addition, spatial relationships would contribute to that result as well. Again, when the variable of the ratio of the non-working population to the working population (M) is considered, it can be inferred that there is a nonlinear relationship between this variable and COVID-19 cases. Furthermore, there is a nonlinear relationship between GDP per capita (E) and the number of COVID-19 cases.

Partial dependence plots: (a) partial dependence plot of Pm10 particles related to air quality on COVID-19 cases, (b) partial dependence plot of SO2 (sulphur dioxide) on COVID-19 cases, (c) partial dependence plot of population density on COVID-19 cases, (d) partial dependence plot of unemployment on COVID-19 cases, (e) partial dependence plot of GDP per capita ($) on COVID-19 cases, (f) partial dependence plot of hospital beds on COVID-19 cases, (g) partial dependence plot of number of physicians on COVID-19 cases, (h) partial dependence plot of average household size on COVID-19 cases, (i) partial dependence plot of automobile number on COVID-19 cases, (j) partial dependence plot of literacy on COVID-19 cases, (k) partial dependence plot of disease of circulatory system on COVID-19 cases, (l) partial dependence plot of disease of respiratory system on COVID-19 cases, (m) partial dependence plot of elderly dependency ratio on COVID-19 cases, (n) partial dependence plot of age 20–39 on COVID-19 cases, (o) partial dependence plot of age 40–59 on COVID-19 cases, (p) partial dependence plot of age 60–79 on COVID-19 cases, (q) partial dependence plot of age 80 + on COVID-19 cases, and (r) partial dependence plot of endocrine, nutritional, and metabolic diseases on COVID-19 cases.
In Figure 13, the natural break maps for the six most important features according to the ETR result are given. We mentioned our reasoning for explaining the unusual relationship between cases and average household size before. When we investigate Figures 3 and 12 together, a low COVID-19 case and high average household size is observed in the eastern Anatolian and southeastern Anatolian region. This remarkable finding is a totally unexpected result and might correlate with the development index of provinces. Most features show a distinct separation between east and west regions of Turkey. For instance, literacy rates are higher in the western regions like Marmara region, Aegean region, and Central Anatolia region; however, even in these regions, a high number of COVID-19 cases are found. Also, literacy shows the same character as GDP per capita. Moreover, all the contributing six features indicate a high spatial autocorrelation. Neighbouring matrix was constructed according to the rook contiguity type. We calculated the global Moran’s I values and obtained high spatial autocorrelation ranging from 0.65 to 0.82. Moran’s I values are 0.82, 0.65, 0.67, 0.78, 0.76, and 0.76 according to the order of feature importance. This means close provinces have similar variable values spatially.

Natural breaks map of six important features according to ETR result.
4 Discussion
We compare the results of our study with the current literature in Turkey and other countries as well. Our findings support the previous related studies of revealing influencing factors on either COVID-19 cases or deaths with only a few exceptions. The inability to include COVID-19-related deaths as a dependent variable in addition to cases and the inaccessibility of data on how many of the COVID-19 cases resulted in death are the study’s limitations. Moreover, certain variables’ most recent values are not available, and some others that could affect COVID-19 instances, including migration across provinces, are not. The provision of data and the usage of many data sources is the study’s most challenging aspect.
Ronael and Baycan [5] found that population density, health capacity, and annual temperature were the most influencing place-based factors supporting COVID-19 spread. Neşe and Bakir [7] obtained population density and elderly dependency as the key factor for the spread of COVID-19 in Turkey. Indeed, the elderly dependency ratio is the second important feature in our study. However, population density is noted as the eighth most important feature. Indeed, Grekousis et al. [2] stated that population density could be an effective factor in COVID-19 deaths for the short-term studies like in the initial waves. However, they admit that this is not a permanent factor contributing to deaths. We took a longer time period for the aggregation of COVID-19 cases at the provincial level, and we only tried to explain the source of the spread with non-spatial machine learning methods including tree-based models as there might be nonlinear relationships. In addition, we did not include some of the meteorological factors in our study. Therefore, the crucial factors related to the analysis of COVID-19 cases could be different.
Grekousis et al. [21] examined the factors which have an influence on COVID-19 mortality in the United States with random forests and geographical random forests. They found out that the geographical random forests model is superior to the random forests and all other linear models in the study. Also, they found that obtained median income and no vehicle are the important local risk factors similar to our study. According to feature importance, the third most important local risk factor is GDP per capita. There are other studies in which median income has been linked with COVID-19 mortality [4,5,6,7,8,9,10,11,12,13,14,15,16,17,18,19,20,21,22,23,24,25,26,27,28,29,30,31,32,33,34,35]. Although they are different variables based on calculation (GDP and median income), they represent the economic wealth of the counties, provinces, or countries. Sannigrahi et al. [6] found a strong positive association between income/total population and COVID cases/deaths for European countries. They put forward the age structure of the population, ratio of the elderly population, ratio of dependent population, pre-existing health records, human mobility, and the socio-economic structure of the society as a cause of non-uniform and spatial stationary interaction of income factors with COVID-19 cases.
A pioneering result of our study is that the features which play a crucial role in the development index of provinces high principal components weight) are also found highly remarkable in contributing COVID-19 cases. GDP per capita, automobile number (per thousand), and literacy are examples in this category. Literacy could be included in this category; however, the only difference is that women’s literacy level is included in the analysis of determining the provincial development index. One exception is that unemployment is the least contributing feature to the development index of provinces (minimum principal component weight), whereas it is the fourth important feature in explaining COVID-19 cases in our study according to ETR results.
Finally, the spatial distribution of the most important features fits into the clusters which have been formed by using the multivariate local spatial autocorrelation analysis. We can give elderly dependency ratio as an example. This feature’s value is higher in Black Sea region rather than in other regions. Furthermore, GDP values are far greater than in western regions like Marmara, Aegean, and Mediterranean regions. The most important overlap is seen in low-average household size values in eastern and southeastern Anatolia regions. These mentioned features might dominate the others during the formation of the clusters.
5 Conclusion and future research
In this article, we consider spatial analysis of Turkey’s COVID-19 cases. As a consequence, this study suggests that the spatial distribution of COVID-19 cases is related to demographic, socioeconomic, and educational inequities across provinces. We use multivariate local Geary and multivariate local neighbour match test to show the relationship between the COVID-19 cases and the demographic and socioeconomic similarities or differences in provinces of Turkey by using a composite index of development level based on provinces. In addition, we propose an ERT model to indicate the effects of demographic and socioeconomic inequities on COVID-19 cases. Results show that ERT outperforms all other machine learning models. This model reveals that the most important factors are the average household size, the ratio of the working population to the non-working population, and GDP per capita. Furthermore, the partial dependence plots are investigated. Our findings are in consensus with previous literature in terms of feature importance. The key finding of the study is that the obtained important features were also employed in preparing an index for the development levels of the Turkish provinces. Spatial regression models and spatial machine learning methods could be employed as a future study since high-level spatial autocorrelations are found in the most important influencing features.
-
Funding information: The authors state no funding involved.
-
Conflict of interest: The authors state no conflict of interest.
-
Ethical approval: The conducted research is not related to either human or animal use.
-
Data availability statement: The datasets generated during and/or analysed during the current study are available in the Turkish Ministry of Health repository, https://turCOVID19.com/acikveri.
References
[1] Grekousis G, Liu Y. Digital contact tracing, community uptake, and proximity awareness technology to fight COVID-19: a systematic review. Sustain Provinces Soc. 2021 Aug;71:102995.10.1016/j.scs.2021.102995Search in Google Scholar PubMed PubMed Central
[2] Grekousis G, Wang R, Liu Y. Mapping the geodemographics of racial, economic, health, and COVID-19 deaths inequalities in the conterminous US. Appl Geogr. 2021 Oct;135:102558.10.1016/j.apgeog.2021.102558Search in Google Scholar PubMed PubMed Central
[3] Wang Q, Dong W, Yang K, Ren Z, Huang D, Zhang P, et al. Temporal and spatial analysis of COVID-19 transmission in China and its influencing factors. Int J Infect Dis. 2021 Apr;105:675–85.10.1016/j.ijid.2021.03.014Search in Google Scholar PubMed PubMed Central
[4] Maiti A, Zhang Q, Sannigrahi S, Pramanik S, Chakraborti S, Cerda A, et al. Exploring spatiotemporal effects of the driving factors on COVID-19 incidences in the contiguous United States. Sustain Provinces Soc. 2021 May;68:102784.10.1016/j.scs.2021.102784Search in Google Scholar PubMed PubMed Central
[5] Ronael M, Baycan T. Place-based factors affecting COVID-19 incidences in Turkey. Asia-Pac J Reg Sci. 2022 Oct;6(3):1053–86.10.1007/s41685-022-00257-4Search in Google Scholar
[6] Sannigrahi S, Pilla F, Basu B, Basu AS, Molter A. Examining the association between socio-demographic composition and COVID-19 fatalities in the European region using spatial regression approach. Sustain Provinces Soc. 2020 Nov;62:102418.10.1016/j.scs.2020.102418Search in Google Scholar PubMed PubMed Central
[7] Neşe AR, Bakir H. Spatiotemporal analysis of Covid-19 in Turkey. Sustain Provinces Soc. 2022 Jan;76:103421.10.1016/j.scs.2021.103421Search in Google Scholar PubMed PubMed Central
[8] Martines MR, Ferreira RV, Toppa RH, Assunção LM, Desjardins MR, Delmelle EM. Detecting space–time clusters of COVID-19 in Brazil: mortality, inequality, socioeconomic vulnerability, and the relative risk of the disease in Brazilian municipalities. J Geogr Syst. 2021 Jan;23:7–36.10.1007/s10109-020-00344-0Search in Google Scholar PubMed PubMed Central
[9] Karácsonyi D, Dyrting S, Taylor A. A spatial interpretation of Australia’s COVID-vulnerability. Int J Disaster Risk Reduct. 2021 Jul;61:102299.10.1016/j.ijdrr.2021.102299Search in Google Scholar PubMed PubMed Central
[10] Neelon B, Mutiso F, Mueller NT, Pearce JL, Benjamin-Neelon SE. Spatial and temporal trends in social vulnerability and COVID-19 incidence and death rates in the United States. PLoS One. 2021 Mar;16(3):e0248702.10.1371/journal.pone.0248702Search in Google Scholar PubMed PubMed Central
[11] Wu X, Zhang J. Exploration of spatial-temporal varying impacts on COVID-19 cumulative case in Texas using geographically weighted regression (GWR). Environ Sci Pollut Res. 2021 Aug;28:43732–46.10.1007/s11356-021-13653-8Search in Google Scholar PubMed PubMed Central
[12] Malik YS, Sircar S, Bhat S, Ansari MI, Pande T, Kumar P, et al. How artificial intelligence may help the Covid‐19 pandemic: Pitfalls and lessons for the future. Rev Med Virol. 2021 Sep;31(5):1.10.1002/rmv.2205Search in Google Scholar PubMed PubMed Central
[13] Khan W, Hussain A, Khan SA, Al-Jumailey M, Nawaz R, Liatsis P. Analysing the impact of global demographic characteristics over the COVID-19 spread using class rule mining and pattern matching. R Soc Open Sci. 2021 Jan;8(1):201823.10.1098/rsos.201823Search in Google Scholar PubMed PubMed Central
[14] Stutt ROJH, Retkute R, Bradley M, Gilligan CA, Colvin J. A modelling framework to assess the likely effectiveness of facemasks in combination with ‘lock-down’ in managing the COVID-19 pandemic. Proc Math Phys Eng Sci. 2020;476(2238):20200376.10.1098/rspa.2020.0376Search in Google Scholar PubMed PubMed Central
[15] Banoei MM, Dinparastisaleh R, Zadeh AV, Mirsaeidi M. Machine-learning-based COVID-19 mortality prediction model and identification of patients at low and high risk of dying. Crit Care. 2021 Dec;25(1):1–4.10.1186/s13054-021-03749-5Search in Google Scholar PubMed PubMed Central
[16] Lee S, Lee C, Xu M, Li W, Ory M. People living in disadvantaged areas faced greater challenges in staying active and using recreational facilities during the COVID-19 pandemic. Health Place. 2022 May;75:102805.10.1016/j.healthplace.2022.102805Search in Google Scholar PubMed PubMed Central
[17] Lak A, Sharifi A, Badr S, Zali A, Maher A, Mostafavi E, et al. Spatio-temporal patterns of the COVID-19 pandemic, and place-based influential factors at the neighborhood scale in Tehran. Sustain Provinces Soc. 2021 Sep;72:103034.10.1016/j.scs.2021.103034Search in Google Scholar PubMed PubMed Central
[18] Iyanda AE, Adeleke R, Lu Y, Osayomi T, Adaralegbe A, Lasode M, et al. A retrospective cross-national examination of COVID-19 outbreak in 175 countries: a multiscale geographically weighted regression analysis (January 11–June 28, 2020). J Infect Public Health. 2020;13(10):1438–45.10.1016/j.jiph.2020.07.006Search in Google Scholar PubMed PubMed Central
[19] Mansour S, Al Kindi A, Al-Said A, Al-Said A, Atkinson P. Sociodemographic determinants of COVID-19 incidence rates in Oman: Geospatial modelling using multiscale geographically weighted regression (MGWR). Sustain Provinces Soc. 2021 Feb;65:102627.10.1016/j.scs.2020.102627Search in Google Scholar PubMed PubMed Central
[20] Luo Y, Yan J, McClure S. Distribution of the environmental and socioeconomic risk factors on COVID-19 death rate across continental USA: a spatial nonlinear analysis. Environ Sci Pollut Res. 2021 Feb;28:6587–99.10.1007/s11356-020-10962-2Search in Google Scholar PubMed PubMed Central
[21] Grekousis G, Feng Z, Marakakis I, Lu Y, Wang R. Ranking the importance of demographic, socioeconomic, and underlying health factors on US COVID-19 deaths: A geographical random forest approach. Health Place. 2022 Mar;74:102744.10.1016/j.healthplace.2022.102744Search in Google Scholar PubMed PubMed Central
[22] Heidari A, Jafari Navimipour N, Unal M, Toumaj S. Machine learning applications for COVID-19 outbreak management. Neural Comput Appl. 2022 Sep;34(18):15313–48.10.1007/s00521-022-07424-wSearch in Google Scholar PubMed PubMed Central
[23] Uçar A, Arslan Ş, Manap H, Gürkan T, Çalişkan M, Dayioğlu A, et al. Türkiye’de COVID-19 pandemisinin monitörizasyonu için interaktif ve gerçek zamanlı bir web uygulaması: TURCOVID19. Anatol Clin J Med Sci. 2020 Mar;25(Special Issue on COVID 19):154–5.10.21673/anadoluklin.726347Search in Google Scholar
[24] Moran PA. Random associations on a lattice. In Mathematical Proceedings of the Cambridge Philosophical Society. Vol. 43, Issue 3. Cambridge University Press; 1947 Jul. p. 321–8.10.1017/S0305004100023550Search in Google Scholar
[25] Moran PA. The interpretation of statistical maps. J R Stat Soc Ser B (Methodol). 1948;10(2):243–51.10.1111/j.2517-6161.1948.tb00012.xSearch in Google Scholar
[26] Anselin L. Geoda. Local Spatial Autocorrelation (3). Retrieved January 9; 2023, from. https://geodacenter.github.io/workbook/6c_local_multi/lab6c.html.Search in Google Scholar
[27] Geary RC. The contiguity ratio and statistical mapping. Incorporated Statistician. 1954 Nov;5(3):115–46.10.2307/2986645Search in Google Scholar
[28] Anselin L. A local indicator of multivariate spatial association, extending Geary’s c. Geogr Anal. 2019;51(2):133–50.10.1111/gean.12164Search in Google Scholar
[29] Breiman L. Random forests. Mach Learn. 2001;45:5–32.10.1023/A:1010933404324Search in Google Scholar
[30] Geurts P, Ernst D, Wehenkel L. Extremely randomized trees. Mach Learn. 2006 Apr;63:3–42.10.1007/s10994-006-6226-1Search in Google Scholar
[31] Lundberg SM, Erion G, Chen H, DeGrave A, Prutkin JM, Nair B, et al. From local explanations to global understanding with explainable AI for trees. Nat Mach Intell. 2020 Jan;2(1):56–67.10.1038/s42256-019-0138-9Search in Google Scholar PubMed PubMed Central
[32] Aminifar A, Shokri M, Rabbi F, Pun VK, Lamo Y. Extremely randomized trees with privacy preservation for distributed structured health data. IEEE Access. 2022 Jan;10:6010–27.10.1109/ACCESS.2022.3141709Search in Google Scholar
[33] Khan A, Uddin J, Ali F, Kumar H, Alghamdi W, Ahmad A. AFP-SPTS: an accurate prediction of antifreeze proteins using sequential and pseudo-tri-slicing evolutionary features with an extremely randomized tree. J Chem Inf Model. 2023 Jan;63(3):826–34.10.1021/acs.jcim.2c01417Search in Google Scholar PubMed
[34] QGIS.org. QGIS Geographic Information System. QGIS Association; 2022.Search in Google Scholar
[35] Mollalo A, Vahedi B, Rivera KM. GIS-based spatial modeling of COVID-19 incidence rate in the continental United States. Sci Total Environ. 2020 Aug;728:138884.10.1016/j.scitotenv.2020.138884Search in Google Scholar PubMed PubMed Central
© 2023 the author(s), published by De Gruyter
This work is licensed under the Creative Commons Attribution 4.0 International License.
Articles in the same Issue
- Research Articles
- Social factors related to depression during COVID-19
- Prevalence of diaper need and diaper dermatitis and associated risk factors among children aged 1–24 months in a referral hospital in Ghana: A cross-sectional study
- A gravity model approach to understand the spread of pandemics: Evidence from the COVID-19 outbreak
- Raising security of first responders with C-ITS?
- Recomposition of work and attitudes of family assistants within Covid-19 in Poland: A pilot study
- Allelic variants of CYP2B6 gene expression and its implication on the pathogenesis of malaria among a cohort of outpatients in North-Central Nigeria
- Impact of medically supervised fasting on the vitamin D, glycemic control, quality of life and need for medication among type 2 diabetes mellitus: Protocol for a randomized control trial (FAVIT Trial)
- A Tumblr thematic analysis of perinatal health: Where users go to seek support
- Assessing the significance of socioeconomic and demographic factors on COVID-19 cases in Turkey along with the development levels of provinces
- Economic burden and health-related quality of life in patients with neurofibromatosis type 1 in Greece
- Review Articles
- The current status of diversity among physician assistants in surgery: A systematic review
- Planting a path to kidney health: The vegetarian diet and diabetic nephropathy
- Short Communications
- World Heart Day: Clinical case to raise awareness on cardiovascular disease in women
- Preserving sight: Managing and preventing diabetic retinopathy
- The rise of anti-vaccination legislation in two Midwestern US states: Implications for politics, policy, and society
- Letter to the Editor
- Tranexamic acid and pre-hospital trauma setting: Is everything clear by now?
- Pneumocephalus was commonly evident and pneumorrhachis was very commonly evident among our peri-anesthesia patients whose peri-partum neurological symptoms had warranted radiological investigations
- Ventilator-associated pneumonia: Epidemiological changes or disregarded bundles?
- Special Issue on Public Health Resilience - Part I
- Editorial: Special issue on public health resilience
- Message framing, partisanship, and popular support for COVID-19 vaccine mandate for all adults: Evidence from a preregistered survey experiment