Carbohydrate-protein interactions characterized by dual polarization hybrid plasmonic waveguide
-
Chen Chen


Abstract
Optical biosensors present good performance for the affinity analysis of a molecular binding event. However, most of those excited with single optical mode are “blind” to the conformational change of bound molecules. We theoretically demonstrate a dual polarization hybrid plasmonic (DPHP) waveguide with nano-slots. By addressing the structure with dual polarizations, the optogeometrical properties (density and thickness) of protein layers have been determined without ambiguity. Differences in the hybrid mode dispersion between the transverse electric (TE) and transverse magnetic (TM) modes allow to separately determine the thickness and the density at all stages during the molecular interaction. In addition, nano-slots can be equated with an effective optical capacitance resulting in a strong field confinement; thereby, subtle changes in the ambient medium can be sensed. A proof of concept is conducted by analyzing the conformational change of HepV, a recombinant fragment of collagen V, during complicated molecular interaction. Integrated with adlayer thickness and density, we can conclude that a thick sparse layer formed after heparin capture and a thin dense layer arising from HepV bound. Accordingly, HepV undergoing conformational change has been traced and verified as molecular interaction occurs.
1 Introduction
Biomolecules exert their biological effects via binding to other molecules. A significant number of interactions including antibody-antigen [1], receptor-hormone [2], and enzyme-substrate [3] play a crucial role in physiological activities. Thus, precise detection of biomolecules, especially proteins, is strongly required in the medical and bioprocess [4], [5]. Nuclear magnetic resonance (NMR) with an isotope-labeled biological sample is commonly used for determining protein conformation, yet high-quality protein consumption [6]. Without sacrificing the resources for more extensive biophysical characterization, label-free biochemical technologies, particularly evanescent wave biosensor techniques [7], [8], [9], [10], [11], [12], such as surface plasmon resonance (SPR) [13], [14], [15], provide considerable insight into biological events. The physics of SPR techniques relies on measurements to single transverse magnetic (TM) polarization [16]. Because of single measurement, it is unable to differentiate shifts in the biolayer thickness Δa and refractive index Δnl. Thus, SPR is hardly capable of distinguishing between a thick sparse layer and a thin dense layer. This means that such technology is “blind” to the conformational change of bound molecules. To gain greater information on biological events taking place at these interfaces, two measurements are required. Moreover, researchers lay increasing stress on the concept of proteome, which can be broadly interpreted as proteins expressed by genome, resulting in an obvious requirement for a huge collaborative effort in the protein signature [17]. Given that TE and TM modes excited simultaneously, both Δa and Δnl can be traced without ambiguity. Recently, a dual polarization interferometry (DPI) [18], [19], with its ability to monitor conformational change in molecules, has been deployed in the field of protein engineering. This commercially available approach has been demonstrated to provide both adlayer thickness a and refractive index nl in the biological system, such as protein-protein interaction. However, this technique lacks multiplexing abilities and suffers from a large footprint, setting limits on the development and application as a biosensor [20].
In this work, we investigate a dual polarization hybrid plasmonic (DPHP) waveguide. Two orthogonal polarizations of incident light are applied to the chip, in turn, exciting the fundamental quasi-TE mode and fundamental quasi-TM mode (hereafter, this text will be abbreviated as TE mode and TM mode), and the modes interrogate the biolayer by means of an evanescent tail [21], [22]. In this way, shifts in the adlayer thickness Δa and refractive index Δnl can be determined independently. Moreover, nano-slots formed between a metal (Ag) cladding and a silicon core can provide a combination of plasmonic and photonic modes contributing to sub-wavelength confinement with high sensitivity as well as relative long propagation distance. We adopt the resonance wavelength shift to interpret the molecular event. In order to verify the novel architecture, we quantitatively analyze the carbohydrate-protein interaction in which biotinylated heparin is immobilized to the surface through the biotin-streptavidin system subsequently, interacting with HepV, a recombinant fragment of collagen V. Collagen V [23], [24] is a member of the fibril subclass of collagens, and it plays a crucial role in fibrillogenesis [23], [24]. This collagen controls the initiation of the collagen fibril assembly and acts as an adhesive substrate for a large variety of cells. Collagen V specifically interacts with a number of extracellular components through its 300-nm-long predominant triple helical domain, which exhibits different molecular forms in the tissue [24]. The major form in most tissues is the heterotrimer [α1(V)]2α2(V), which was previously discovered to interact with heparin depending on glycosaminoglycan chains at physiological salt concentrations [24]. Specifically, the heparin-binding region is located within a12-kDa fragment in the triple helical part of the a1(V) chain [24], [25]. The recombinant fragment (Ile824 to Pro950), referred to as HepV, is sufficient for heparin binding and functions as a cell adhesion through a cell surface heparan sulfate proteoglycan [24], [25]. Therefore, the binding of HepV to heparin can modulate the interaction between collagen V and heparin sulfate proteoglycan in the tissues. The D-biotinstreptavidin model, which has been intensely investigated for decades and is used in immunological protocol is utilized for immobilizing heparin on the surface owing to its high binding affinity with a dissociation constant of Kd=10−15 mol/dm3 [26]. The whole process of HepV-heparin interaction is simulated based on the finite element method (FEM) via the commercially available software, COMSOL Multiphysics (COMOSOL Inc., Stockholm, Sweden) with success.
2 Design of DPHP waveguide
2.1 Schematic of DPHP waveguide
Figure 1A presents the three-dimensional (3D) schematic structure of the proposed DPHP waveguide, consisting of a silicon-on-insulator (SOI) rib and a metal (Ag) cladding. The region between the Si core and the Ag layer is filled with a tested analyte. In this way, double nano-slots are formed at both sides of the Si core as well as another slot is embedded on the top of the Si core. The cross-section view with geometric parameters is presented in Figure 1B. The widths of the Si core and the lateral nano-slot are denoted as wsi and wslot, respectively. The height of the Si ridge and the upper nano-slot are defined as hsi and hslot, respectively. The optimized values of wslot and hslot are setting as 40 nm and 60 nm, respectively, giving rise to a strong filed confinement and a low propagation loss. In Figure 1C, a field profile obtained by simulation reveals that the present configuration can support both the TE and TM modes. The values of the geometric parameters were assigned: wsi equals 550 nm; hsi equals 320 nm; hsio2 (substrate) is 3 μm high, and the length of the waveguide (l) is 25 μm. The thickness of the Ag cladding is set at 3 μm so as to neglect the influence of the simulation boundaries. This structure is manipulated compatibly with the conventional SOI optical as well. In the simulation work, the refractive indices [27] of Si and SiO2 are set as 3.5046 and 1.447, respectively, at a central wavelength of 1.3 μm. The wavelength selection [7] is based on a tradeoff between the absorption loss caused by the aqueous solution and the broadband light sources. The water solution optical absorption is smaller at a wavelength of 1.3 μm, compared with the 1.55-μm wavelength commonly used for operation. The permittivity of silver is achieved through the Durde model [28]:
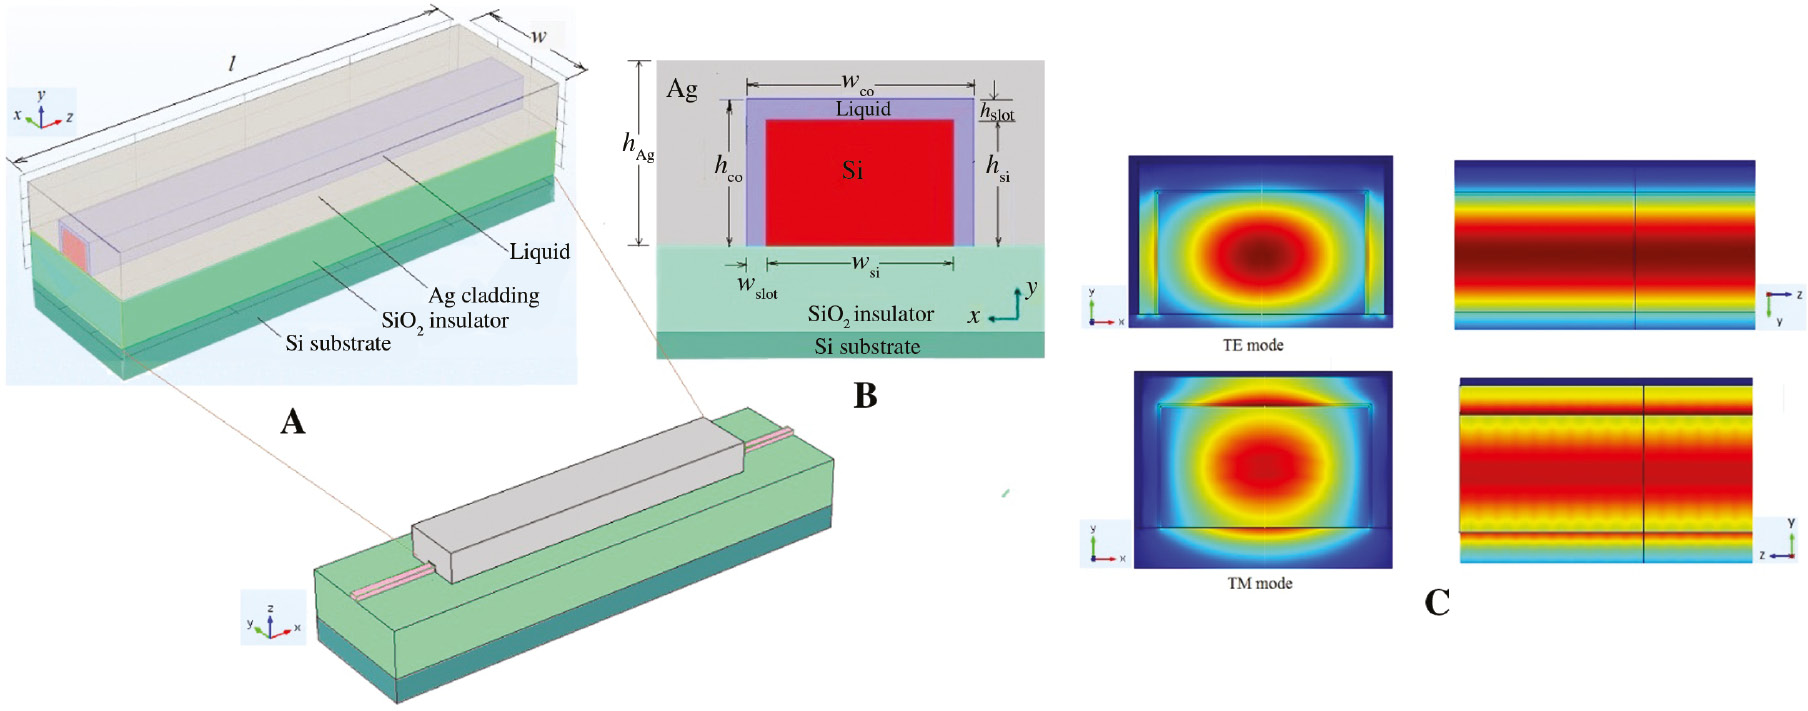
(A) Schematic of DPHP waveguide. (B) Cross-section view of the DPHP waveguide filled by test liquid. The values of the geometric parameters are wslot=40 nm, hslot=60 nm, wsi=550 nm, hsi=320 nm, hAg=3 μm, hsio2=3 μm, and l=25 μm. (C) Field profile of the DPHP waveguide.
where ε∞=3.1, ωp=140×1014 rad/s, and γ=0.31×10¹⁴ rad/s.
2.2 Theory of DPHP waveguide
For most waveguide systems, the evanescent wave decays exponentially with the decay length in the order of 0.1–1 μm [20]; thus, it only senses the changes taking place on the surface of the waveguide due to the higher intensity of the evanescent field in this particular region. Therefore, the shifts in the bulk solution is hardly considered, whereas the bulk index has an exact influence on the sensor response. With regard to the proposed structure, the incident light goes through the waveguide and excites the surface plasmon in the slots when the phase velocities of the optical mode and that of the surface plasmon match. The field is highly confined in the slots and sufficiently penetrates into the solution. As a result, the bulk refractive index can be measured. Evidently, the slots are able to store electromagnetic energy resulting in subwavelength optical guiding with lower propagation loss. The dielectric discontinuity at the Si core solution interface produces a polarization charge [29], which interacts with the plasma oscillations of the metal-solution interface. The gap region can be equated with an effective optical capacitance [29] resulting in a strong field confinement and a lower propagation loss. The propagation constant of the surface plasmon depends strongly on the wavelength, in comparison with the optical modes of the traditional dielectric waveguide. The phase-matching condition between an optical mode of the dielectric waveguide and a surface plasmon supported by metal (Ag) cladding might be fulfilled within a narrow spectral band. Therefore, when a broadband light (1.285 μm≤λ≤1.315 μm in this case) is applied to the waveguide, the spectrum presents a narrow dip with optical energy conversion into the surface plasmon [30]. The position of the resonance dip in the output spectrum strongly relies on the refractive index of the sensed medium. Any changes in the sensed medium will alter the resonance condition, which results in a shift in the resonance dip. Thus, we can adopt wavelength interrogation to interpret the molecular interaction.
2.3 Carbohydrate-protein interactions based on DPHP waveguide
Herein, HepV-heparin interaction was emulated based on the FEM and carried out with COMSOL. Generally, the HepV-heparin binding event can be simplified into four distinct steps [25]: (1) Tris buffer flowing over the biotin-functionalized waveguide surface for initial calibration, (2) streptavidin immobilized on the surface, (3) the capture of biotinylated heparin, (4) introducing recombinant HepV fragment to recognize the biotinylated heparin. During the biological event, the thickness a and the refractive index nl of the adlayer with a known numerical value were obtained from the typical literature data [25]. Besides, the bulk refractive indices, in this case, were calculated according to the empirical equation [25] expressed as nl=0.52*(np−ns)+ns, where np is the refractive index of pure protein (1.465) [31], [32], [33] or solvated carbohydrate (1.45) [34]. All the data, including nl, ns and a, are presented in Table 1. The effective mode indices (neff_TE and neff_TM) were measured for a wavelength spanning 1.285 μm≤λ≤1.315 μm at all stages. The fitting curves of the neff_TE and neff_TM versus the wavelength λ are plotted in Figure 2. One can see clearly the process of the HepV-heparin binding event in the whole spectrum range. The shifts in the resonance wavelength depending on the effective mode indices of the waveguide are significantly different. Thus, we can take the wavelength interrogation to interpret the molecular interaction.
Observed layer characteristics [25] of thickness a and refractive index nl during the whole process.
| Material (observation after each step) | Thickness a (nm) | RI of layer nl | RI of solution ns |
|---|---|---|---|
| Tris buffer | 0 | 0 | 1.366 |
| Streptavidin | 5.58 | 1.4037 | 1.3373 |
| Streptavidin+biotinylated heparin | 5.46 | 1.4077 | 1.3619 |
| HepV binding to heparin | 5.33 | 1.4073 | 1.3448 |
Calculated solution refractive index ns in each step by the equation nl=0.52 * (np−ns)+ns.

Simulation results of HepV-heparin binding event at a wavelength spanning 1.285 μm≤λ≤1.315 μm for the TE mode (A) and the TM mode (B), respectively. A plot of wavelength versus effective mode index provides a representation of each step.
2.4 Property of DPHP waveguide
In general, sensitivity and propagation loss are considered as significant criteria to evaluate the performance of a biosensor. It is necessary to validate these two physical quantities of the proposed DPHP waveguide. The waveguide sensor sensitivities respond to (1) the changes in the bulk refractive index ∆ns, (2) the shifts in the biolayer index Δnl, and (3) the adlayer thickness variation Δa. In the molecular interaction, all the effects occur, and consequently, the resulting effective mode index change is:
where
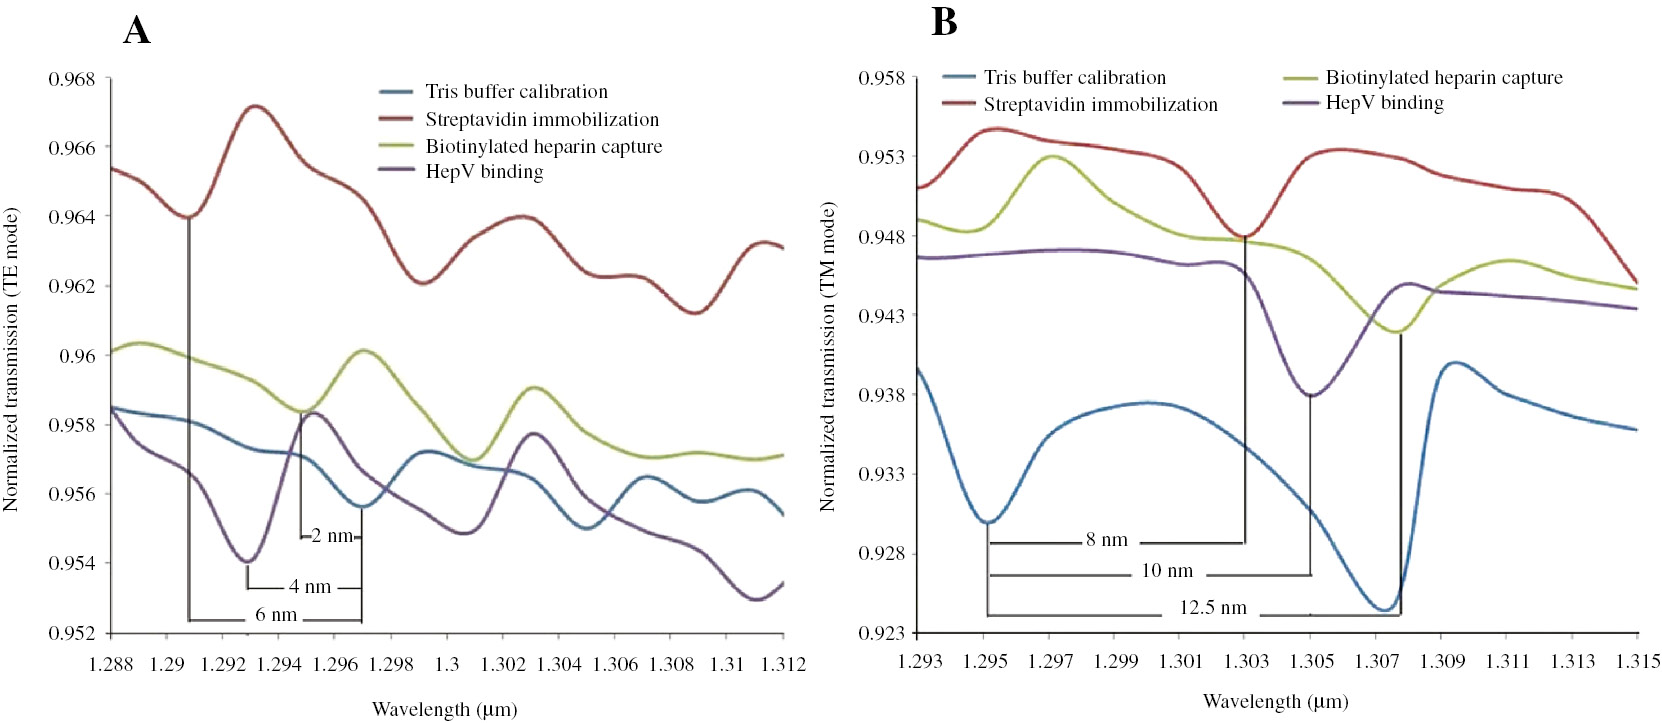
The dependence of resonance wavelength on transmissions during the whole process for both TE mode (A) and TM mode (B).
Afterward, the spectral interrogation sensitivities, caused by changes in bulk refractive index ∆ns for dual polarizations can be defined as follows:
where
where
where
where ΔλDPHP_i is the shift in resonance wavelength, and Δns, Δnl, and Δa are shifts in the bulk index, adlayer index, and thickness in each step (excluding step 1) compared with the calibration step.
In order to investigate the propagation loss for the hybrid plasmonic waveguide, the optical confinement factor Γ, defined previously [35], which was power confined in a particular area divided by the total power, was introduced. It has been shown [35] that Γ is not only influenced by the loss-less photonics mode but also by the lossy plasmonic mode. Thus, we can improve Γlayer (power confined in the layer compared with total power) by tuning the geometrical properties of the structure to gain lower loss. The optimized size of the waveguide is set as aforementioned: wslot=40 nm, hslot=60 nm, wsi=550 nm, hsi=320 nm, hAg=3 μm, hsio2=3 μm, and l=25 μm. To calculate the propagation loss, we derive the loss coefficient α (in dB/μm) in the following equation:

Dependence of propagation loss on the wavelength varying from 1.285 μm to 1.315 μm for the optimized waveguide dimension for dual polarization. The value for loss can reach as low as the order of 10−4.
2.5 Characterization of heparin-Hep V interaction
To extract the biolayer thickness and index, we rewrite equation (6) with fixed wavelengths at resonance dips (λ=1.291 μm, λ=1.295 μm, λ=1.293 μm for the TE mode and λ=1.303 μm, λ=1.3075 μm, λ=1.305 μm for the TM mode):
where ΔλDPHP_i (i=TE,TM) are shifts of resonance wavelengths at all stages compared with the Tris buffer calibration, and the numerical values can be achieved via Figure 3.
The

The variation of transmission arising from a different bulk refractive index (1.33≤ns≤1.37 with step 0.01) in the molecular binding event. (A) λ=1.291 μm for the TE mode, (B) λ=1.303 μm for the TM mode.
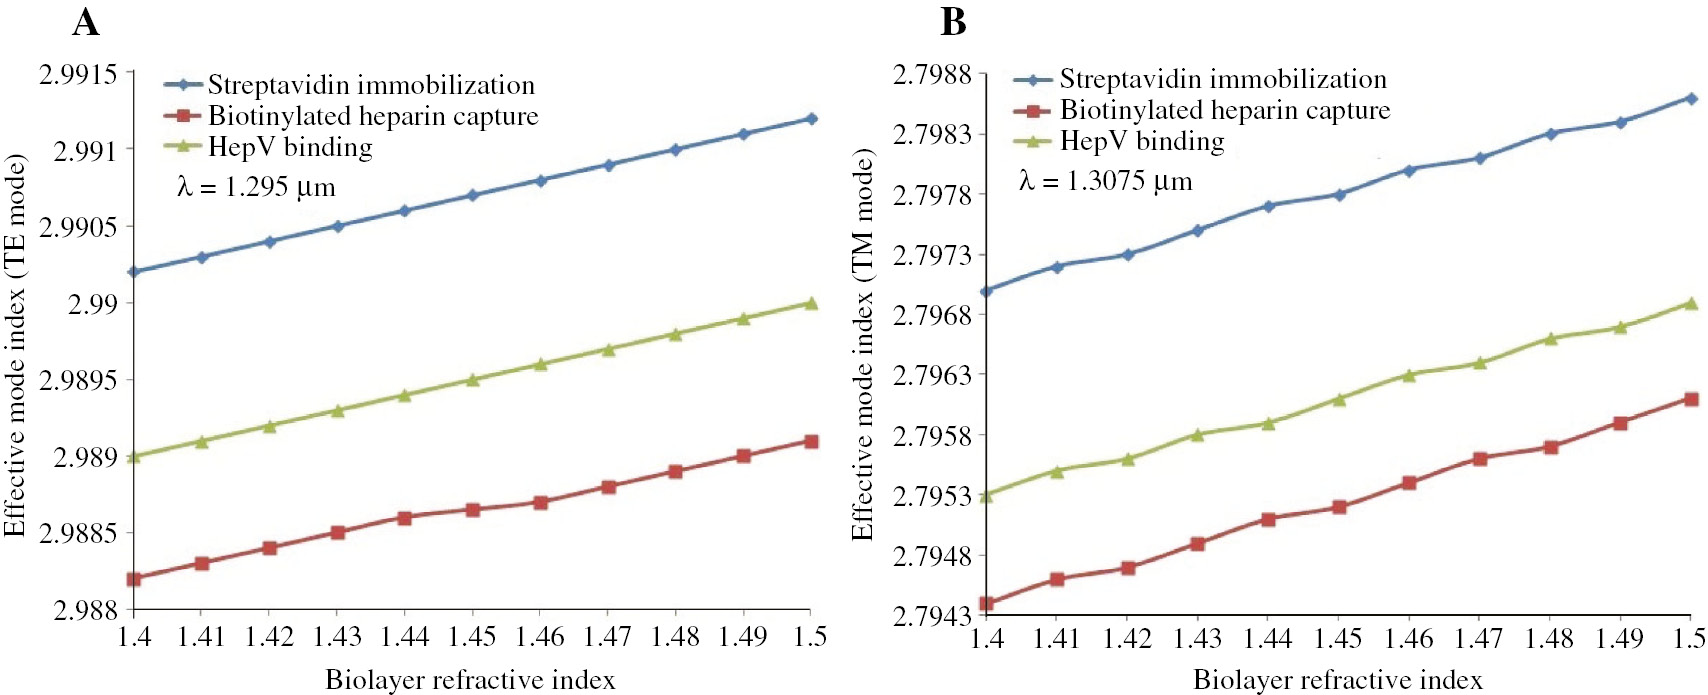
The variation of transmission caused by biolayer index changing (1.4≤nl≤1.41 with step 0.01) during molecular interaction. (A) λ=1.295 μm for the TE mode, (B) λ=1.3075 μm for the TM mode.

The variation of transmission induced by the shift in adlayer thickness (5 nm ≤a≤6 nm with step 0.2 nm) during the molecular interaction. (A) λ=1.293 μm for the TE mode, (B) λ=1.305 μm for the TM mode.
It is noteworthy that to simplify the numerical calculation, we substitute ns with nl via the empirical formula [25] nl=0.52*(np−ns)+ns and, thus, combine
Given the values of biolayer thickness and refractive index, the surface mass density during the binding event can be calculated through the De Feijter’s formula [36]: ρl=(nl−ns)/(dn/dc), where dn/dc is the refractive index increment (in cm3·g−1), which in the case of protein and carbohydrate are 0.186 cm3·g−1 and 0.142 cm3·g−1, respectively. The densities of the adlayer dedicated by streptavidin, biotinylated heparin, as well as HepV, are 0.357 g·cm−3, 0.322 g·cm−3, and 0.336 g·cm−3, respectively. Integrating with adlayer thickness and density, we can conclude that a thick sparse layer (a=5.46 nm, ρl=0.322 g·cm−3) is formed after heparin capture, and a thin dense layer (a=5.33 nm, ρl=0.336 g·cm−3) is formed as HepV is bound. This phenomenon can be explained by HepV undergoing conformational change on binding to heparin and a loss of streptavidin from the waveguide surface during HepV injection, thereby, a decrease in adlayer thickness and density, compared with that of streptavidin introduction.
2.6 DPHP waveguide fabrication
We have envisaged a CMOS-compatible fabrication process of the designed device. The process can start from a commercial SOI wafer. Alternatively the plasma-enhanced chemical vapor deposition (PECVD) technology is used to deposit the SiO2 and α-Si thin film on the Si substrate. The photoresist thin film is formed on the Si film, and the waveguide patterns are constructed using an E-beam lithography so as to gain high resolution. Then, an extreme thin aluminum (Al) film, with a 40-nm thickness on the sidewall and a 60-nm thickness on the top of the Si rib, was deposited by the sputtering process. This step could be followed by the deposition of a metal (Ag) layer with a 3-μm thickness on the sidewall and at the top of the Al film by the sputtering process. Afterward, the Al film is removed by selectively etching to form the vertical and horizontal slots.
3 Conclusion
We designed the DPHP waveguide and carried out a detailed investigation of the modal properties and the performance of the proposed device. The employment of the DPHP waveguide for protein analysis has been largely discussed. We take the wavelength shift detection to quantify the molecular interaction with success. The relationship between the biolayer property and the resonance wavelength was deduced as equation (8) in the text. The waveguide is capable of detecting shifts in the biolayer thickness and the refractive index without ambiguity, consequently distinguishing between a thick sparse layer and a thin dense layer. Associated with thickness and density of the adlayer, we can see HepV undergoing conformational change when the binding event occurs. In addition, the propagation loss for the optimized size of the waveguide can reach to as low value as the order of 10−4. Last but not the least, the novel device could be realized by a simple and CMOS-compatible fabrication process. In summary, the novel structure proposed with the help of the numerical and simulation analysis lays a good basis for the follow up work.
Acknowledgment
The authors gratefully acknowledge the financial support for this work provided by the National Natural Science Foundation of China (NSFC) under Grant nos. 61235003 and 61427816. This work was also supported by the Collaborative Innovation Center of Suzhou Nano Science and Technology.
References
[1] Nelson D, Cox M. Lehninger Principles of Biochemistry, W.H. Freeman and Company: New York, 2005.Search in Google Scholar
[2] Hammes SR. The further redefining of steroid-mediated signaling. Proc. Natl. Acad. Sci. USA 2003, 100, 2168–2170.10.1073/pnas.0530224100Search in Google Scholar
[3] Warshel A, Sharma PK, Kato M, Xiang Y, Liu HB, Mats Olsson MH. Electrostatic basis for enzyme catalysis, Chem. Rev. 2006, 106, 3210–3235.10.1021/cr0503106Search in Google Scholar
[4] Roth JA, Hong WK, Komaki RU, Tsao AS, Chang JY, Blackmon SH. Lung Cancer, John Wiley & Sons, Inc.: Hoboken, New Jersey, 2008.10.1002/9780470696330Search in Google Scholar
[5] Barh D, Carpi A, Verma M, Gunduz M. Cancer Biomarkers: Minimal and Noninvasive Early Diagnosis and Prognosis, Taylor and Francis: Boca Raton, FL, 2013.10.1201/b16389Search in Google Scholar
[6] Coan KE, Swann MJ, Ottl J. Measurement and differentiation of ligand-induced calmodulin conformations dual polarization interferometry. Anal. Chem. 2012, 84, 1586–1591.10.1021/ac202844eSearch in Google Scholar
[7] Dell‘Olio F, Conteduca D, Cimineli C, Armenise MN. New ultrasensitive resonant photonic platform for label-free biosensing. Opt. Express 2015, 23, 28593–28604.10.1364/OE.23.028593Search in Google Scholar
[8] Drapp B, Piehler J, Brecht A, Gauglitz G, Luff BJ, Ingenhoff J. Integrated optical Mach-Zehnder interfrometers as simazine imuunoprobes. Sens. Actuators B 1997, 38–39, 277–282.10.1016/S0925-4005(97)80218-3Search in Google Scholar
[9] Shew BY, Kou CH, Huang YC, Tsai YH. UV-LIGA interferometer biosensor based on the SU-8 optical waveguide. Sens. Actuators A 2005, 120, 383–389.10.1016/j.sna.2005.01.004Search in Google Scholar
[10] Prieto F, Sepulveda B, Calle A, Llobera A, Dominguez C, Abad A, Montoya A, Lechuga LM. An integrated optical interferometric nanodevice based on silicon technology for biosensor applications. Nanotechnology 2003, 14, 907–912.10.1088/0957-4484/14/8/312Search in Google Scholar
[11] Kitsara M, Misiakos K, Raptis I, Makarona E. Integrated optical frequency-resolved Mach-Zehnder interferometers for label-free affinity sensing. Opt. Express 2010, 18, 8193–8206.10.1364/OE.18.008193Search in Google Scholar PubMed
[12] Luff BJ, Wilkinson JS, Piehler J, Hollenbach U, Ingenhoff J, Fabricius N. Integrated optical Mach–Zehnder biosensor. J. Lightwave Technol. 1998, 16, 583–592.10.1109/50.664067Search in Google Scholar
[13] Tsai WC, Li IC. SPR-based immunosensor for determining staphylococcal enterotoxin A. Sens. Actuators B 2009, 136, 8–12.10.1016/j.snb.2008.10.061Search in Google Scholar
[14] Lao AI, Su X, Aung KM. SPR study of DNA hybridization with DNA and PNA probes under stringent conditions. Biosens Bioelectron 2009, 24, 1717–1722.10.1016/j.bios.2008.08.054Search in Google Scholar
[15] Yang CT, Mejard R, Griesser HJ, Bagnaninchi PO, Thierry B. Cellular micromotion monitored by long-range surface plasmon resonance with optical fluctuation analysis. Anal. Chem. 2015, 87, 1456–1461.10.1021/ac5031978Search in Google Scholar
[16] Malmqvist M. Biospecific interaction analysis using biosensor technology. Nature 1993, 361, 186–187.10.1038/361186a0Search in Google Scholar
[17] Cross GH, Reeves AA, Brand S, Popplewell JF, Peel LL, Swann MJ, Freeman NJ. A new quantitative optical biosensor for protein characterization. Biosens. Bioelectron. 2004, 19, 383–390.10.1016/S0956-5663(03)00203-3Search in Google Scholar
[18] Swann MJ, Peel LL, Carrington S, Freeman NJ. Dual-polarization interferometry: an analytical technique to measure changes in protein structure in real time, to determine the stoichiometry of binding events, and to differentiate between specific and nonspecific interactions. Anal. Biochem. 2004, 329, 190–198.10.1016/j.ab.2004.02.019Search in Google Scholar PubMed
[19] Berney H, Oliver K. Dual polarization interferometry size and density characterisation of DNA immobilisation and hybridization. Biosens. Bioelectron. 2005, 21, 618–626.10.1016/j.bios.2004.12.024Search in Google Scholar PubMed
[20] Estevez MC, Alvarez M, Lechuga ML. Integrated optical devices for lab-on-a-chip biosensing applications. Laser Photon. Rev. 2012, 6, 463–487.10.1002/lpor.201100025Search in Google Scholar
[21] Bahrami F, Alam MZ, Aitchison JS, Mojahedi M. Dual polarization measurements in the hybrid plasmonic biosensors. Plasmonics 2003, 8, 465–473.10.1007/s11468-012-9411-zSearch in Google Scholar
[22] Alam MZ, Bahrami F, Aitchison JS, Mojahedi M. Analysis and optimization of hybrid plasmonic waveguide as a platform for biosensing. IEEE Photon. J. 2014, 6, 1–10.10.1109/JPHOT.2014.2331232Search in Google Scholar
[23] Wenstrup RJ, Florer JB, Brunskill EW, Bell SM, Chervoneva I, Birk DE. Type V collagen controls the initiation of collagen fibril assembly. J. Biol. Chem. 2004, 279, 53331–53337.10.1074/jbc.M409622200Search in Google Scholar
[24] Delacoux F, Fichard A, Geourjon C, Garrone R, Ruggiero F. Molecular features of the collagen V heparin binding site. J. Biol. Chem. 1998, 273, 15069–15076.10.1074/jbc.273.24.15069Search in Google Scholar
[25] Ricard-Blum S, Peel LL, Ruggiero F, Freeman NJ. Dual polarization interferometry characterization of carbohydrate–protein interactions. Anal. Biochem. 2006, 352, 252–259.10.1016/j.ab.2006.02.011Search in Google Scholar
[26] Green NM. Avidin. Protein Chem. 1975, 29, 85–133.10.1016/S0065-3233(08)60411-8Search in Google Scholar
[27] Lide DR, CRC Handbook of Chemistry and Physics, Internet Version, Taylor and Francis: Boca Raton, FL, 2007.Search in Google Scholar
[28] Bohren CF, Huffman DR. Absorption and Scattering of Light by Small Particle. John Wiley & Sons, Inc.: New Jersey, 1983.Search in Google Scholar
[29] Bartal G, Oulton RF, Sorger VJ, Zhang X. A hybrid plasmonic waveguide for subwavelength confinement and long range propagation. Nat. Photonics 2008, 2, 496–500.10.1038/nphoton.2008.131Search in Google Scholar
[30] Dostalek J, Ctyroky J, Homola J, Brynda E, Skalsky M, Nekvindova P, Spirkova J, Skvor J, Schrofel J. Surface plasmon resonance biosensor based on integrated optical waveguide. Sens. Actuators B. 2001, 76, 8–12.10.1016/S0925-4005(01)00559-7Search in Google Scholar
[31] Awrin H. Ellipsometry on thin organic layers of biological interest:characterization and applications. Thin Solid Films 2002, 377, 48–5610.1016/S0040-6090(00)01385-7Search in Google Scholar
[32] Wen J, Arakawa T. Refractive index of proteins in aqueous sodium chloride. Anal. Biochem. 2000, 280, 327–329.10.1006/abio.2000.4524Search in Google Scholar PubMed
[33] Davis TM, Wilson WD. Determination of the refractive index increments of small molecules for correction of surface plasmon resonance data. Anal. Biochem. 2000, 284, 348–353.10.1006/abio.2000.4726Search in Google Scholar PubMed
[34] Nikolic GS, Cakic MD, Ilic LA. Specific refractive index increments of insulin. J. Serb. Chem. Soc. 2001, 66, 397–401.10.2298/JSC0106397NSearch in Google Scholar
[35] Sun X, Dai D, Thylen L, Wosinski L. High-sensitivity liquid refractive-index sensor based on a Mach-Zehnder interferometer with a double-slot hybrid plasmonic waveguide. Opt. Express 2015, 23, 25688–25699.10.1364/OE.23.025688Search in Google Scholar PubMed
[36] De Feijter JA, Benjamins J, Veer FA. Ellipsometry as a tool to study the adsorption behavior of synthetic and biopolymers at the air–water interface. Biopolymers 1978, 17, 1759–1772.10.1002/bip.1978.360170711Search in Google Scholar
©2017 Walter de Gruyter GmbH, Berlin/Boston
This article is distributed under the terms of the Creative Commons Attribution Non-Commercial License, which permits unrestricted non-commercial use, distribution, and reproduction in any medium, provided the original work is properly cited.
Articles in the same Issue
- Frontmatter
- In this issue
- Regular articles
- Relationship between Ag nanoparticles and Ag ions prepared by arc discharge method
- Carbohydrate-protein interactions characterized by dual polarization hybrid plasmonic waveguide
- Reviews
- Carbon nanomaterials and their application to electrochemical sensors: a review
- Cobalt ferrite nanoparticles (CoFe2O4 MNPs) as catalyst and support: magnetically recoverable nanocatalysts in organic synthesis
- Copper nanoparticles as an alternative feed additive in poultry diet: a review
- Stimulus-responsive liposomes as smart nanoplatforms for drug delivery applications