Strong coupling of multiple plasmon modes and excitons with excitation light controlled active tuning
-
Yijie Niu
 and
Hong Wei
and
Hong Wei


Abstract
While the strong coupling between cavity modes and quantum emitters has been investigated in various systems, multiple surface plasmon modes in single nanostructures strongly coupling with excitons are rarely explored. Here, we investigate the strong coupling between three surface plasmon modes in silver nanowires and excitons in monolayer WSe2 at room temperature. Four plasmon-exciton polariton (plexciton) states are observed in the scattering spectra. The photoluminescence (PL) spectra of the hybrid system show clear splitting due to strong coupling, and the energies of the emission corresponding to the two lower plexciton states agree with that of the scattering very well. In addition, we show that the plasmon-exciton interaction in this system can be efficiently tuned by controlling the excitation power. These results reveal the fundamental properties of strong coupling between multiple plasmon modes and excitons, deepen the understanding of the correlation between scattering and PL spectra of plasmon-exciton strong coupling systems, and open up a new way to actively control the coupling between plasmonic nanostructures and two-dimensional semiconductors.
1 Introduction
When the coherent energy exchange rate between an exciton and an optical cavity is faster than their average dissipation rate, the strong coupling is achieved, which is characterized by the Rabi splitting in frequency domain or Rabi oscillation in time domain. In the past decades, the strong coupling between traditional optical cavities and various quantum emitters has been widely studied [1–5], which shows great potentials for applications in physical and chemical sciences and related technologies. In recent years, the strong coupling of plasmonic nanocavities and excitons has attracted intense interest because surface plasmons (SPs) possess highly confined electromagnetic field with ultrasmall mode volume [6]. This unique property of SPs leads to larger coupling strength and allows for the observation of strong coupling at room temperature at single nanoparticle level [7–10] and even single exciton level [11–17].
Up to now, most works focused on the investigation of strong coupling between only one plasmon mode and one exciton state of emitters, and few studies demonstrated the multimode coupling [18–34]. At the single nanoparticle level, the multimode strong coupling was mainly investigated for one plasmon mode and two exciton states of the same emitters or two different kinds of emitters by scattering spectra [24, 27, 31, 32, 34]. Compared with two modes coupling systems, multimode coupling systems form more polariton states and provide more energy relaxation channels, which is beneficial to further novel applications [35–38].
Monolayers of transition metal dichalcogenides (TMDCs) with atomic thickness, direct band gap transition [39], large exciton binding energy [40], and high optical absorption [41] are ideal candidates for the realization of strong coupling at room temperature. Importantly, monolayer TMDCs at ambient conditions can be easily manipulated by electrostatic gating, thermal control, and optical pumping, exhibiting great capabilities in dynamically tuning plasmon-exciton interactions [42–45]. At the single nanoparticle level, the electrical and thermal control of gold nanrod-WS2 coupled system at room temperature [10], and the electrical control of silver nanoprism-WS2 coupled system at cryogenic and room temperatures [31] have been demonstrated. Additionally, monolayer TMDCs can also be manipulated by changing the excitation power [46–49], and to our knowledge, such excitation light controlled active tuning for plasmon-exciton strong coupling has not been reported yet.
Here, we firstly investigate the coupling of multiple SP modes on single Ag nanowires (NWs) and excitons in monolayer WSe2 by both scattering and PL spectra. The strong coupling of three SP modes and excitons is achieved, resulting in four plexciton branches. A four-coupled-oscillators model is used to analyze the strong coupling behavior. The PL spectra demonstrate the emission mainly from the two lower plexciton states, and the emission peaks agree very well with the energies of the corresponding plexcitons obtained from the scattering spectra. Furthermore, the active control of the strong coupling is achieved by tuning the excitation power, which is demonstrated by PL spectra.
2 Results and discussion
The top panel in Figure 1a shows the schematic of the cross section of the strong coupling system, which consists of a single Ag NW and a WSe2 monolayer on a glass substrate. In experiments, after placing the monolayer WSe2 and Ag NWs onto the glass substrate, an Al2O3 layer of initial thickness 5 nm was deposited on top of the sample surface to protect the Ag NWs from degradation (see Methods and Section 1 in Supplementary Material for details). The bottom panel in Figure 1a shows the optical image of one of the Ag NWs with proper dimensions (diameter ∼85 ± 5 nm, length ∼4.39 ± 0.17 μm) on monolayer WSe2. The monolayer WSe2 on glass substrate shows a transmission dip at E 0 = 1.665 eV (Figure 1b) which corresponds to the A exciton, and the full width at half maximum (FWHM) of the dip is about 55 meV according to a Lorentzian fit. Ag NWs support multiple SP resonance modes that can be easily tuned by modifying the diameter and/or length of the NW, and the refractive index of the surrounding environment. Therefore, Ag NW is an ideal candidate for investigating the strong coupling of multiple SP modes and excitons at the single particle level. When three adjacent SP modes have spectral overlap with excitons, it is possible to construct a three SP modes-excitons coupled system. These three SP modes (named as SP1, SP2, and SP3, with the energy of E 1, E 2, and E 3, respectively) interact with excitons (energy E 0) with coupling strength g 1, g 2, and g 3, respectively, forming four plexciton states P1, P2, P3, and P4, as schematically shown in Figure 1c.
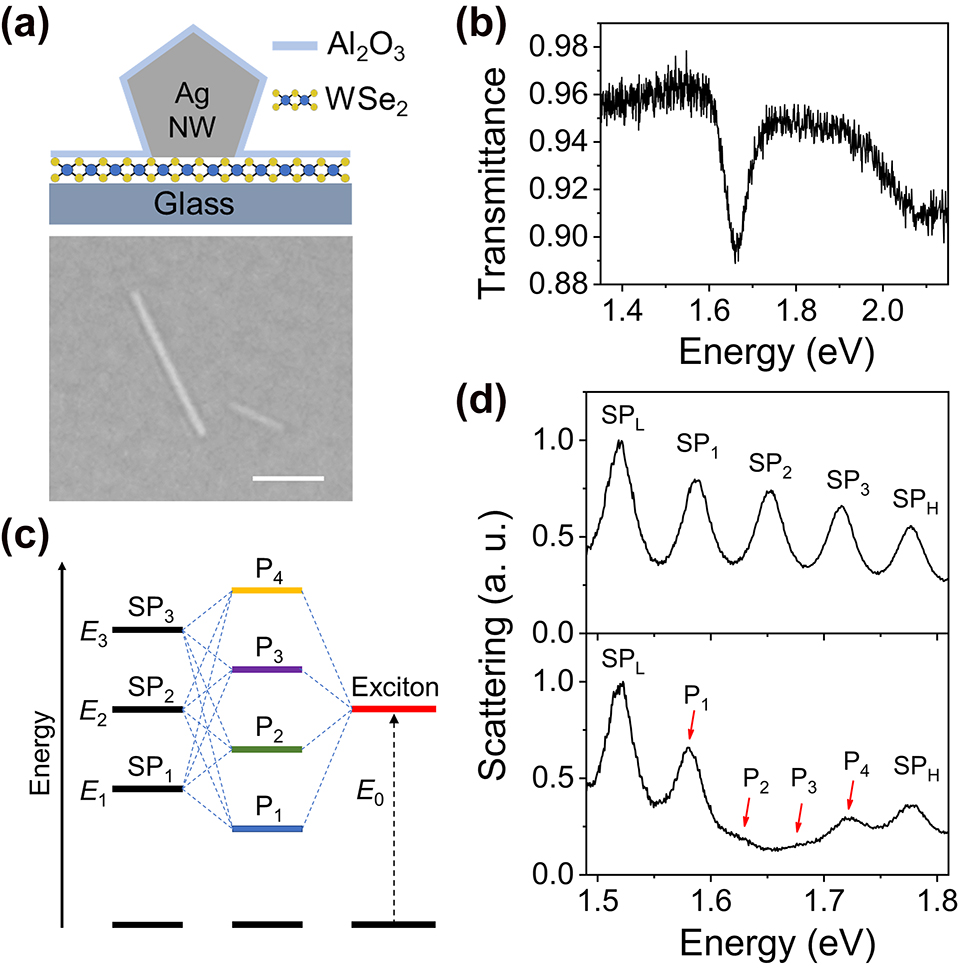
Schematics and characterizations of Ag NW-WSe2 coupled system. (a) Schematic of the cross section (top) and optical microscopy image (bottom) of a Ag NW on monolayer WSe2. The scale bar is 2 μm. (b) Transmission spectrum of a WSe2 monolayer on glass substrate. (c) Schematic representation of the strong coupling between three plasmon modes and one exciton state resulting in four plexciton states. (d) Scattering spectra of Ag NWs without (top) and with (bottom) monolayer WSe2. The plexciton peaks are marked with red arrows.
The scattering spectra of the coupled systems were measured by focusing the supercontinuum laser light at one end of the NW and collecting the signals at the other end of the NW (see Methods). Due to the small radii of the NWs, only the lowest-order propagating SP mode is excited [50, 51], resulting in the distinct line shapes of Fabry–Pérot resonances in the scattering spectra (see Section 2 in Supplementary Material for the simulation results of the electric field distributions). The top panel in Figure 1d shows the scattering spectrum of a Ag NW on glass substrate. The energy difference between SP1, SP2, and SP3 modes is small enough, so that all these three SP modes can couple with excitons. The SPL and SPH are the SP modes adjacent to SP1, SP2, and SP3 modes, which are far away from the energy of excitons and don’t take part in the interaction. For a Ag NW on monolayer WSe2, the spectral features in the middle area becomes largely different, as can be seen from the bottom panel of Figure 1d. The two NWs in Figure 1d have similar lengths and diameters, and the energies of SPL and SPH are similar. Therefore, it is supposed that these two NWs have the same SP resonances, and the SP2 mode is resonant with the excitons. In the scattering spectrum of Ag NW-WSe2 coupled system, a clear dip is observed at about 1.66 eV, and two peaks appear beside the dip, as marked by P2 and P3. The energies of P1 and P4 are redshifted and blueshifted, respectively, compared with that of SP1 and SP3 modes. These phenomena indicate that all the three SP modes are coupled with the excitons and the four peaks P1 to P4 correspond to the four plexciton states resulting from the strong coupling of three SP modes and excitons.
Figure 2a shows a set of scattering spectra for a single Ag NW on monolayer WSe2 with the Al2O3 coating thickness increased from bottom to top. The SP modes have an overall redshift with the increase of Al2O3 thickness, as marked with the red arrows for SPL and SPH modes. We define the energy difference between SP2 mode and excitons as detuning. When the SP2 mode is close to exciton energy, all the four plexciton branches are clearly observed. When the SP2 mode has a large detuning with excitons, the P2 (bottom spectrum in Figure 2a, positive detuning) or P3 (top spectrum in Figure 2a, negative detuning) are nearly absent in the scattering spectra. This phenomenon is also observed in the strong coupling system of two SP modes and one exciton state [33]. We measured the scattering spectra of dozens of Ag NWs on monolayer WSe2 with increasing thickness of Al2O3 coating layer. The experimental eigenenergies of P1, P2, P3, and P4 are obtained by using four Lorentzian peaks to fit the scattering spectra. For the scattering spectra in which the P2 or P3 is inapparent, three Lorentzian peaks are used for the fitting. The colored dots in Figure 2b show the experimental results of four plexciton branches as a function of the SP2 energy E 2.
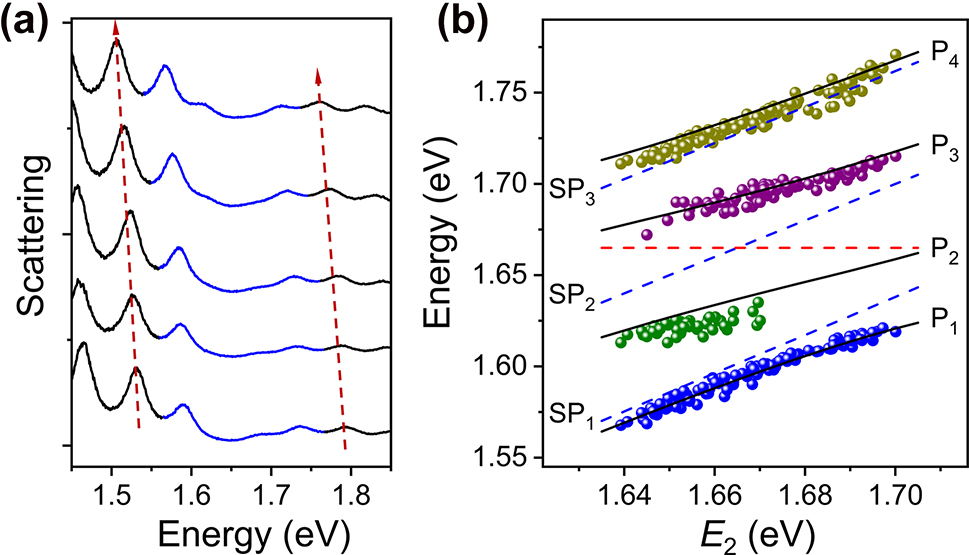
Analyses of scattering spectra for Ag NW-WSe2 coupled systems. (a) Scattering spectra of a Ag NW on monolayer WSe2 with Al2O3 of different thickness. The thickness of Al2O3 is 5 nm, 5.6 nm, 6.6 nm, 8.6 nm, and 10.6 nm from bottom to top. The red arrows mark the redshift of SPL and SPH modes. The strong coupling regions are drawn by blue curves. (b) Energies of P1, P2, P3, and P4 (blue, green, purple, and dark yellow dots) as a function of the energy of SP2 mode E 2. The black lines are calculated by the Hamiltonian of four-coupled-oscillators model with coupling strength of g 1 = g 3 = 22 meV, and g 2 = 32 meV. The blue dashed lines show the energies of SP1 (E 1), SP2 (E 2), and SP3 (E 3) as a function of E 2. The red dashed line indicates the transmission dip energy of excitons.
The energies of SP1, SP2, and SP3 modes are obtained as the average of the values calculated based on their linear relationships with the energies of SPL and SPH modes, since SPL and SPH modes do not couple with excitons (see Section 3 in Supplementary Material). The calculated results of E 1, E 2, and E 3 as a function of E 2 are plotted with the blue dashed lines in Figure 2b. Using a four-coupled-oscillators model (see Methods) and adjusting the coupling strength g 1, g 2, and g 3, the eigenenergies of the plexciton branches are obtained. As shown by the black lines in Figure 2b, the calculated dispersions agree well with the experimental results.
When the SP2 mode is in resonance with excitons, the minimal splitting between the two plexciton branches P2 and P3 is Ω ≈ 56 meV. In accordance with the criterion for the strong coupling of two oscillators, the minimal splitting between adjacent plexciton branches larger than their mean linewidth can be used as the criterion for the multimode strong coupling. The linewidths of P2 and P3 obtained from the four-coupled-oscillators model are
The PL spectra of the coupled systems were also measured by setting the excitation and detection positions at the two opposite ends of the NWs. The polarization of 532 nm laser light is perpendicular to the NWs and the excitation power is about 0.076 mW. Figure 3a shows the PL spectra when the SP2 mode scans across the exciton energy from positive detuning to negative detuning (see Figure S6 in Supplementary Material for the corresponding scattering spectra). As can be seen, the PL spectra of the coupled systems are largely different from that of bare WSe2 (bottom spectrum in Figure 3a), and multiple peaks are observed. The three peaks in the top spectrum in Figure 3a correspond to SPL, P1, and P2, respectively (see Section 6 in Supplementary Material). As E 2 is decreased, the SPL peak is redshifted, as marked by the red arrow. Meanwhile, the redshift of P1 is also clearly observed. At large positive detuning (large E 2 value), the intensity of P2 is lower compared with P1. With the decrease of E 2, the ratio of P2 to P1 intensities is increased, and the intensities of these two plexciton peaks become comparable.
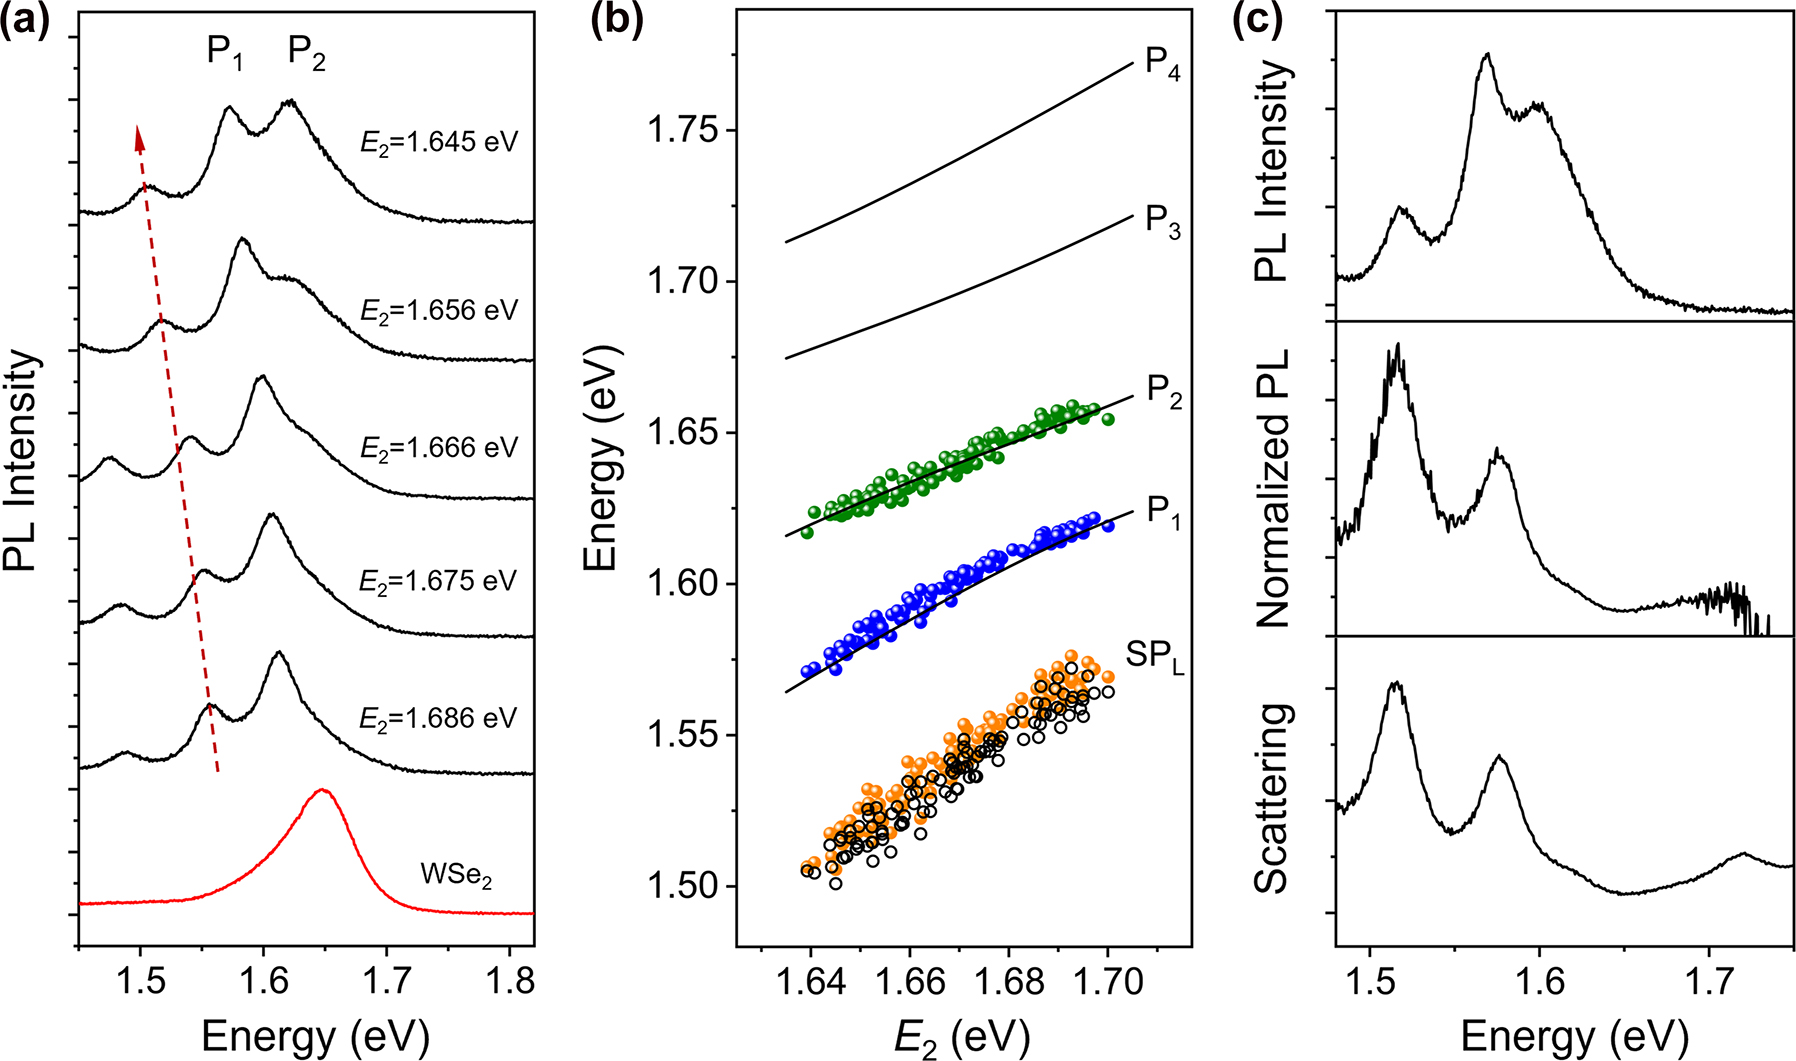
Analyses of PL spectra for Ag NW-WSe2 coupled systems. (a) PL spectra of Ag NWs on monolayer WSe2 with different E 2. The red arrow marks the redshift of SPL mode. The two plexciton peaks are labeled as P1 and P2. The PL spectrum of bare monolayer WSe2 without Ag NW is plotted at the bottom. (b) Energies of fitting peaks in the experimental PL spectra as a function of E 2 (orange, blue, and green dots). The black lines are the calculated results for the scattering in Figure 2b. The black hollow dots are the energies of SPL mode extracted from the corresponding scattering spectra. (c) Top: PL spectrum for a Ag NW-WSe2 coupled system when SP2 mode is close to exciton energy (E 2 = 1.650 eV). Middle: normalized PL spectrum resulting from dividing the top spectrum by the PL spectrum of bare WSe2. Bottom: scattering spectrum for the same coupled system.
The PL spectra are fitted by multiple Lorentzian peaks (see Figure S9 in Supplementary Material), and the energies of the three higher-energy fitting peaks are plotted as a function of the SP2 energy E 2 (orange, blue, and green dots in Figure 3b). As can be seen, the blue and green dots agree well with the black lines corresponding to P1 and P2 for scattering spectra, respectively. The energies of orange dots agree with the energies of SPL mode in the corresponding scattering spectra (black hollow dots in Figure 3b). When the PL spectrum of the coupled system is divided by that of bare WSe2, the resulting normalized PL spectrum shows the same profile as the corresponding scattering spectrum from the same coupled system, as shown in Figure 3c. The similarity of the two spectra demonstrates that the four plexciton states resulting from the strong coupling of three SP modes and excitons are also manifested in the PL spectrum of the coupled system [33]. These results clearly demonstrate that the spectra of PL emitted through the scattering of SP-exciton hybrid modes are closely related to the scattering spectra of the strong coupling system, and both the PL and scattering spectra can reflect the plexciton states formed due to the strong coupling.
At last, we demonstrate the active control by excitation light over the strong coupling. It is found that the peak energy of the PL spectra of bare monolayer WSe2 can be reversibly modulated by increasing or decreasing the excitation power of 532 nm laser (see Figures 4a and S10 in Supplementary Material). The redshift of the PL peak with increasing excitation power can be attributed to the lift of Fermi level and the creation of trions resulting from the increased density of photoionized carriers [46–49]. Additionally, as the PL peak is redshifted with the increase of temperature [10, 43, 47], the laser-induced thermal effect may also contribute to the redshift of the PL spectra. To check whether the thermal effect can influence the SP resonance energies, we measured the scattering spectra of a Ag NW on glass substrate excited by the supercontinuum laser light under the illumination of 532 nm laser light polarized parallel to the NW. The spectra show that the SP resonance energies are almost independent on the power of the 532 nm laser light (see Figure S11 in Supplementary Material), which indicates that the contribution of thermal effect to the PL spectral redshift of monolayer WSe2 may be small. In the following measurements for the coupled system, the polarization of the 532 nm laser light is set to be perpendicular to the NW, which can further suppress the influence of thermal effect induced by the SPs on the Ag NW [52].
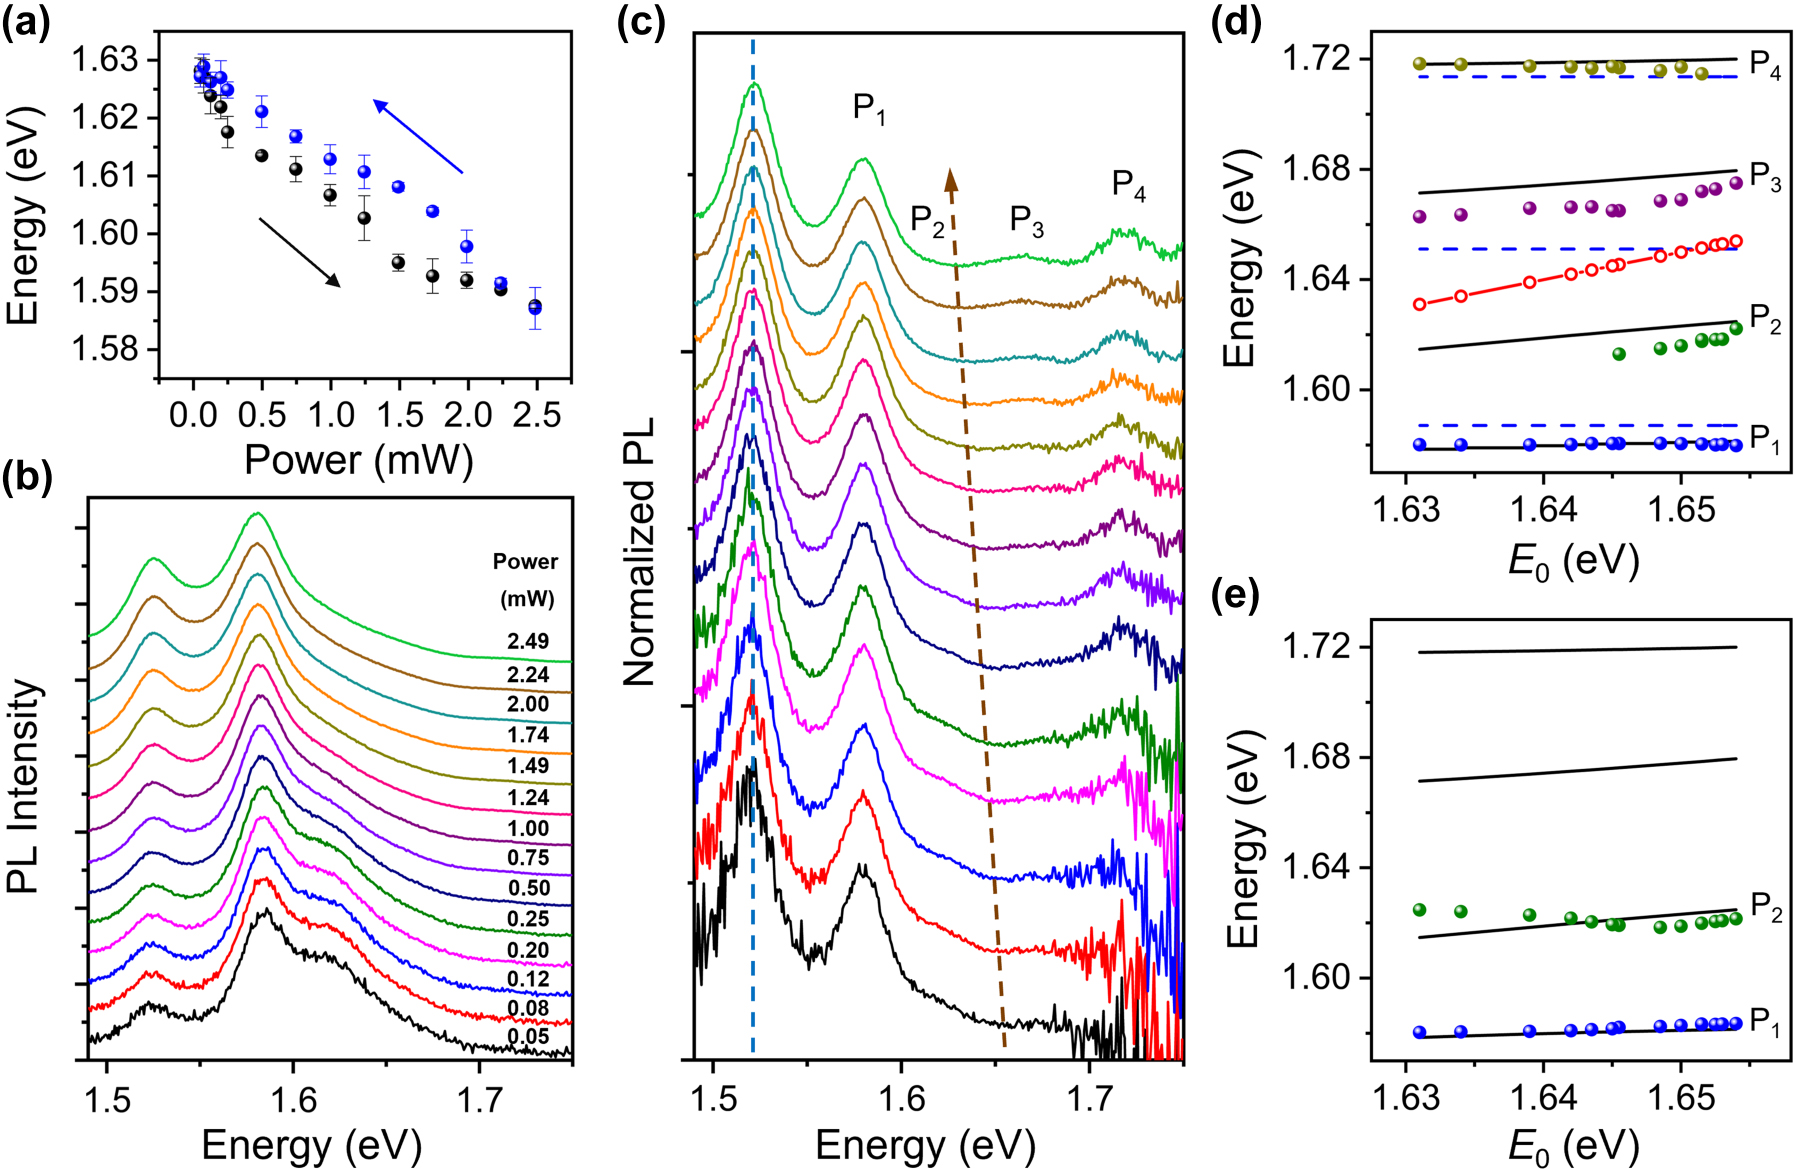
Active control over strong coupling by tuning excitation power. (a) PL peak energy of bare monolayer WSe2 as a function of excitation power. The black and blue arrows show the processes of increasing and decreasing the excitation power, respectively. The black and blue dots are the average values obtained from the spectra measured at three positions on the same WSe2 monolayer, and the error bars represent the standard deviation. (b) PL spectra of a Ag NW on monolayer WSe2 with excitation power increased from bottom to top. The thickness of Al2O3 is 15 nm. (c) Normalized PL spectra obtained by dividing the spectra in (b) by the PL spectra of bare WSe2 at the same excitation power. The redshift of the dip is marked with the brown arrow, and the SPL mode is marked with the blue dashed line. The four plexciton peaks are labeled as P1, P2, P3, and P4. (d) Energies of P1, P2, P3, and P4 (blue, green, purple, and dark yellow dots) extracted from (c) as a function of the dip energy E 0. The black lines are calculated by the Hamiltonian with coupling strength of g 1 = g 3 = 18 meV, and g 2 = 30 meV. The blue dashed lines show the energies of SP1, SP2, and SP3. The red solid line with hollow dots shows the energy of excitons extracted from (c). (e) Energies of P1 and P2 (blue and green dots) extracted from (b) as a function of E 0. The black lines are the same as in (d).
Figure 4b demonstrates a set of PL spectra from a coupled system when the excitation power is increased from 0.05 mW to 2.49 mW. The profiles of these spectra are similar to that in Figure 3a. Therefore, it can be determined that the three peaks in the spectra correspond to SPL, P1, and P2, respectively. With the increase of the excitation power, the intensity of P2 peak becomes relatively lower compared to that of P1 peak. Since the normalized PL spectra show the same profiles as the corresponding scattering spectra, the active control can be analyzed by the normalized PL spectra obtained by dividing the PL spectra of the coupled system by the PL spectra of the bare WSe2 at the same excitation power. The energy of the dip in the normalized PL spectra (marked by a brown arrow in Figure 4c) can be regarded as the transmission dip energy of excitons for each excitation power. With the increase of the excitation power, the dip energy is decreased (see Figure S12 in Supplementary Material). The energy of SPL mode keeps constant when increasing the excitation power, as marked with the blue dashed line in Figure 4c, which further confirms that the SP resonance energies are not affected by the excitation light. Using the energies of SPL and SPH obtained from the scattering spectrum and the linear relationships in Figure S3, the energies of SP1, SP2, and SP3 modes are determined to be E 1 = 1.587 eV, E 2 = 1.651 eV, and E 3 = 1.714 eV. With the increase of the excitation power, the energy of excitons scans across the SP2 mode from the less negative detuning to the positive detuning, which leads to the decrease of the intensity of P2 relative to P1 in Figure 4b and c and the increase of the intensity of P3 relative to P2 in Figure 4c. These results are consistent with Figures 2 and 3 which show the intensities of P2 and P3 are low at positive and negative detuning, respectively. By using Lorentzian peaks to fit the normalized PL spectra in Figure 4c and the PL spectra in Figure 4b, the experimental energies of the plexcitons are obtained, which are plotted as a function of the dip energy E 0 (colored solid dots in Figure 4d and e). The black lines in Figure 4d and e show the eigenenergies calculated by the four-coupled-oscillators model. All these results demonstrate the active control over the strong coupling.
3 Conclusions
We have investigated the strong coupling of three SP modes and excitons by both scattering and PL spectra in the coupled systems of Ag NWs and monolayer WSe2. Four plexciton branches resulting from the strong coupling are obtained from the scattering spectra. In the PL spectra, peak splitting due to strong coupling is clearly observed. The dispersions of the two lower plexciton branches obtained from the PL spectra agree very well with that from the scattering spectra. Furthermore, we have demonstrated excitation light controlled active tuning in this multimode strong coupling system. These results not only confirm the connection between PL and scattering spectra of plasmon-exciton strong coupling systems, but also provide more possibilities to manipulate the strong coupling. The coupling system of plasmonic NWs and two-dimensional TMDCs offers a versatile platform for exploring plasmon-exciton interactions and related applications.
4 Methods
4.1 Sample preparation
The WSe2 monolayers on 300 nm SiO2/Si substrate (1 cm × 1 cm) were purchased from a company (Nanjing Muke Nanotechnology). They were transferred to a glass substrate in the following way. Firstly, the solution of polystyrene (PS) in toluene (50 mg/mL) was spin-coated onto the SiO2/Si substrate with monolayer WSe2 at a speed of 3000 rpm for 60 s. Secondly, the substrate was placed on a hot plate (80 °C) for 15 min to ensure that the WSe2 monolayers were tightly attached to the PS layer. Thirdly, the sample was immersed in NaOH solution (2 mol/L, 60 °C) for 2 min to etch the interface between the silica substrate and the monolayer WSe2. Subsequently, the sample was slowly immersed into deionized water, where the PS layer with the attached WSe2 would be separated from the silica substrate. The PS piece was fished up onto a clean glass substrate, and was placed on a hot plate (130 °C) for 1 h to ensure that the WSe2 monolayers were tightly attached to the glass. Then the PS layer was removed by toluene (room temperature, 2 h). Finally, the sample was washed by ethanol (30 min) and deionized water (5 min), and dried by high purity nitrogen blow.
After transferring the monolayer WSe2 onto the glass substrate, chemically synthesized Ag NWs were drop-casted onto the monolayer WSe2. Then an Al2O3 layer of 5 nm thickness was deposited onto the sample by using atomic layer deposition method. Additional Al2O3 was deposited after the optical measurements to tune the SP resonance energies. For the experiments of laser power tuned PL, a sample with an Al2O3 layer of 15 nm thickness was used, because we found that the sample with thicker Al2O3 coating is more stable under high power laser illumination. Figure S1a shows the scanning electron microscopy image of a Ag NW with proper dimensions. The monolayer nature of the WSe2 is confirmed by measuring the Raman spectra (Figure S1b). The deposition of additional Al2O3 doesn’t induce noticeable change to the PL spectra of monolayer WSe2 (Figure S1c).
4.2 Optical measurements
To measure the scattering spectra of the coupled systems, supercontinuum laser light (repetition rate 10 MHz) was focused onto one end of the NW from the glass side through an oil immersion objective (100×, NA 1.49), and the emitted light from the other end of the NW was collected by the same objective and directed to a spectrometer (Princeton Instruments, Acton SP2500). For PL measurements, the configuration for excitation and detection is the same as that for the scattering spectra. The coupled systems were excited by 532 nm continuous-wave laser light with polarization perpendicular to the NW, and a 633 nm long wave pass filter was inserted in the detection path to block the laser light.
4.3 Coupled oscillators model
The strong coupling of three SP modes and excitons can be described by a four-coupled-oscillators model:
where E
1, E
2, E
3, and E
0 are the energies of the SP1 mode, SP2 mode, SP3 mode, and excitons, respectively; γ
1, γ
2, γ
3, and γ
0 are the FWHMs corresponding to E
1, E
2, E
3, and E
0, respectively; g
1, g
2, and g
3 are the coupling strengths of SP1 mode with excitons, SP2 mode with excitons, and SP3 mode with excitons, respectively; E is the eigenvalue of the energy for corresponding plexcitons; α, β, δ, and φ are the Hopfield coefficients which satisfy
Funding source: National Natural Science Foundation of China
Award Identifier / Grant number: 12074421
Award Identifier / Grant number: 91850207
Funding source: Ministry of Science and Technology of China
Award Identifier / Grant number: 2021YFA1201500
Award Identifier / Grant number: 2021YFA1401100
Funding source: Chinese Academy of Sciences
Award Identifier / Grant number: XDB33000000
Acknowledgment
We thank Dr. Qiang Li for providing the Ag NWs. We thank the Laboratory of Microfabrication in Institute of Physics, Chinese Academy of Sciences for the experimental support.
-
Author contributions: All the authors have accepted responsibility for the entire content of this submitted manuscript and approved submission.
-
Research funding: This work was supported by the National Key R&D Program of China (Grant Nos. 2021YFA1401100 and 2021YFA1201500), the National Natural Science Foundation of China (Grant Nos. 12074421 and 91850207), and the Strategic Priority Research Program of Chinese Academy of Sciences (Grant No. XDB33000000).
-
Conflict of interest statement: The authors declare no competing financial interest.
References
[1] J. Kasprzak, M. Richard, S. Kundermann, et al.., “Bose–Einstein condensation of exciton polaritons,” Nature, vol. 443, no. 7110, pp. 409–414, 2006. https://doi.org/10.1038/nature05131.Search in Google Scholar PubMed
[2] S. Kéna-Cohen and S. R. Forrest, “Room-temperature polariton lasing in an organic single-crystal microcavity,” Nat. Photonics, vol. 4, no. 6, pp. 371–375, 2010. https://doi.org/10.1038/nphoton.2010.86.Search in Google Scholar
[3] D. E. Chang, V. Vuletić, and M. D. Lukin, “Quantum nonlinear optics — photon by photon,” Nat. Photonics, vol. 8, no. 9, pp. 685–694, 2014. https://doi.org/10.1038/nphoton.2014.192.Search in Google Scholar
[4] A. Dreismann, H. Ohadi, Y. del Valle-Inclan Redondo, et al.., “A sub-femtojoule electrical spin-switch based on optically trapped polariton condensates,” Nat. Mater., vol. 15, no. 10, pp. 1074–1078, 2016. https://doi.org/10.1038/nmat4722.Search in Google Scholar PubMed
[5] A. Thomas, L. Lethuillier-Karl, K. Nagarajan, et al.., “Tilting a ground-state reactivity landscape by vibrational strong coupling,” Science, vol. 363, no. 6427, pp. 615–619, 2019. https://doi.org/10.1126/science.aau7742.Search in Google Scholar PubMed
[6] H. Wei, X. H. Yan, Y. J. Niu, Q. Li, Z. Jia, and H. Xu, “Plasmon–exciton interactions: spontaneous emission and strong coupling,” Adv. Funct. Mater., vol. 31, no. 51, p. 2100889, 2021. https://doi.org/10.1002/adfm.202100889.Search in Google Scholar
[7] A. E. Schlather, N. Large, A. S. Urban, P. Nordlander, and N. J. Halas, “Near-field mediated plexcitonic coupling and giant Rabi splitting in individual metallic dimers,” Nano Lett., vol. 13, no. 7, pp. 3281–3286, 2013. https://doi.org/10.1021/nl4014887.Search in Google Scholar PubMed
[8] G. Zengin, M. Wersall, S. Nilsson, T. J. Antosiewicz, M. Kall, and T. Shegai, “Realizing strong light-matter interactions between single-nanoparticle plasmons and molecular excitons at ambient conditions,” Phys. Rev. Lett., vol. 114, no. 15, p. 157401, 2015. https://doi.org/10.1103/PhysRevLett.114.157401.Search in Google Scholar PubMed
[9] D. Zheng, S. P. Zhang, Q. Deng, M. Kang, P. Nordlander, and H. Xu, “Manipulating coherent plasmon–exciton interaction in a single silver nanorod on monolayer WSe2,” Nano Lett., vol. 17, no. 6, pp. 3809–3814, 2017. https://doi.org/10.1021/acs.nanolett.7b01176.Search in Google Scholar PubMed
[10] J. X. Wen, H. Wang, W. L. Wang, et al.., “Room-temperature strong light–matter interaction with active control in single plasmonic nanorod coupled with two-dimensional atomic crystals,” Nano Lett., vol. 17, no. 8, pp. 4689–4697, 2017. https://doi.org/10.1021/acs.nanolett.7b01344.Search in Google Scholar PubMed
[11] R. Chikkaraddy, B. de Nijs, F. Benz, et al.., “Single-molecule strong coupling at room temperature in plasmonic nanocavities,” Nature, vol. 535, no. 7610, pp. 127–130, 2016. https://doi.org/10.1038/nature17974.Search in Google Scholar PubMed PubMed Central
[12] K. Santhosh, O. Bitton, L. Chuntonov, and G. Haran, “Vacuum Rabi splitting in a plasmonic cavity at the single quantum emitter limit,” Nat. Commun., vol. 7, p. 11823, 2016. https://doi.org/10.1038/ncomms11823.Search in Google Scholar PubMed PubMed Central
[13] R. Liu, Z. K. Zhou, Y. C. Yu, et al.., “Strong light-matter interactions in single open plasmonic nanocavities at the quantum optics limit,” Phys. Rev. Lett., vol. 118, no. 23, p. 237401, 2017. https://doi.org/10.1103/PhysRevLett.118.237401.Search in Google Scholar PubMed
[14] H. Groß, J. M. Hamm, T. Tufarelli, O. Hess, and B. Hecht, “Near-field strong coupling of single quantum dots,” Sci. Adv., vol. 4, no. 3, p. eaar4906, 2018. https://doi.org/10.1126/sciadv.aar4906.Search in Google Scholar PubMed PubMed Central
[15] H. Leng, B. Szychowski, M. C. Daniel, and M. Pelton, “Strong coupling and induced transparency at room temperature with single quantum dots and gap plasmons,” Nat. Commun., vol. 9, p. 4012, 2018. https://doi.org/10.1038/s41467-018-06450-4.Search in Google Scholar PubMed PubMed Central
[16] K. D. Park, M. A. May, H. X. Leng, et al.., “Tip-enhanced strong coupling spectroscopy, imaging, and control of a single quantum emitter,” Sci. Adv., vol. 5, no. 7, p. eaav5931, 2019. https://doi.org/10.1126/sciadv.aav5931.Search in Google Scholar PubMed PubMed Central
[17] J. Y. Li, W. Li, J. Liu, et al.., “Room-temperature strong coupling between a single quantum dot and a single plasmonic nanoparticle,” Nano Lett., vol. 22, no. 12, pp. 4686–4693, 2022. https://doi.org/10.1021/acs.nanolett.2c00606.Search in Google Scholar PubMed
[18] T. K. Hakala, J. J. Toppari, A. Kuzyk, et al.., “Vacuum Rabi splitting and strong-coupling dynamics for surface-plasmon polaritons and Rhodamine 6Gg molecules,” Phys. Rev. Lett., vol. 103, no. 5, p. 053602, 2009. https://doi.org/10.1103/PhysRevLett.103.053602.Search in Google Scholar PubMed
[19] N. I. Cade, T. Ritman-Meer, and D. Richards, “Strong coupling of localized plasmons and molecular excitons in nanostructured silver films,” Phys. Rev. B, vol. 79, no. 24, p. 241404, 2009. https://doi.org/10.1103/PhysRevB.79.241404.Search in Google Scholar
[20] S. Balci and C. Kocabas, “Ultra hybrid plasmonics: strong coupling of plexcitons with plasmon polaritons,” Opt. Lett., vol. 40, no. 14, pp. 3424–3427, 2015. https://doi.org/10.1364/OL.40.003424.Search in Google Scholar PubMed
[21] W. J. Liu, B. Lee, C. H. Naylor, et al.., “Strong exciton–plasmon coupling in MoS2 coupled with plasmonic lattice,” Nano Lett., vol. 16, no. 2, pp. 1262–1269, 2016. https://doi.org/10.1021/acs.nanolett.5b04588.Search in Google Scholar PubMed
[22] K. Zhang, W. B. Shi, D. Wang, et al.., “Couple molecular excitons to surface plasmon polaritons in an organic-dye-doped nanostructured cavity,” Appl. Phys. Lett., vol. 108, no. 19, p. 193111, 2016. https://doi.org/10.1063/1.4949562.Search in Google Scholar
[23] M. Balasubrahmaniyam, D. Kar, P. Sen, P. B. Bisht, and S. Kasiviswanathan, “Observation of subwavelength localization of cavity plasmons induced by ultra-strong exciton coupling,” Appl. Phys. Lett., vol. 110, no. 17, p. 171101, 2017. https://doi.org/10.1063/1.4979838.Search in Google Scholar
[24] J. Cuadra, D. G. Baranov, M. Wersäll, R. Verre, T. J. Antosiewicz, and T. Shegai, “Observation of tunable charged exciton polaritons in hybrid monolayer WS2−plasmonic nanoantenna system,” Nano Lett., vol. 18, no. 3, pp. 1777–1785, 2018. https://doi.org/10.1021/acs.nanolett.7b04965.Search in Google Scholar PubMed
[25] B. W. Li, S. Zu, Z. P. Zhang, et al.., “Large Rabi splitting obtained in Ag-WS2 strong-coupling heterostructure with optical microcavity at room temperature,” Opto-Electron. Adv., vol. 2, no. 5, p. 190008, 2019. https://doi.org/10.29026/oea.2019.190008.Search in Google Scholar
[26] A. Bisht, J. Cuadra, M. Wersäll, A. Canales, T. J. Antosiewicz, and T. Shegai, “Collective strong light-matter coupling in hierarchical microcavity-plasmon-exciton systems,” Nano Lett., vol. 19, no. 1, pp. 189–196, 2019. https://doi.org/10.1021/acs.nanolett.8b03639.Search in Google Scholar PubMed
[27] P. Jiang, G. Song, Y. Wang, C. Li, L. Wang, and L. Yu, “Tunable strong exciton-plasmon-exciton coupling in WS2-J-aggregates-plasmonic nanocavity,” Opt. Express, vol. 27, no. 12, pp. 16613–16623, 2019. https://doi.org/10.1364/OE.27.016613.Search in Google Scholar PubMed
[28] D. Melnikau, A. A. Govyadinov, A. Sánchez-Iglesias, et al.., “Double Rabi splitting in a strongly coupled system of core–shell Au@Ag nanorods and J-aggregates of multiple fluorophores,” J. Phys. Chem. Lett., vol. 10, no. 20, pp. 6137–6143, 2019. https://doi.org/10.1021/acs.jpclett.9b01988.Search in Google Scholar PubMed
[29] H. Zhang, B. Abhiraman, Q. Zhang, et al.., “Hybrid exciton-plasmon-polaritons in van der waals semiconductor gratings,” Nat. Commun., vol. 11, p. 3552, 2020. https://doi.org/10.1038/s41467-020-17313-2.Search in Google Scholar PubMed PubMed Central
[30] A. H. Rose, J. R. Dunklin, H. Zhang, J. M. Merlo, and J. van de Lagemaat, “Plasmon-mediated coherent superposition of discrete excitons under strong exciton–plasmon coupling in few-layer MoS2 at room temperature,” ACS Photonics, vol. 7, no. 5, pp. 1129–1134, 2020. https://doi.org/10.1021/acsphotonics.0c00233.Search in Google Scholar
[31] B. Munkhbat, D. G. Baranov, A. Bisht, et al.., “Electrical control of hybrid monolayer tungsten disulfide-plasmonic nanoantenna light-matter states at cryogenic and room temperatures,” ACS Nano, vol. 14, no. 1, pp. 1196–1206, 2020. https://doi.org/10.1021/acsnano.9b09684.Search in Google Scholar PubMed
[32] W. Zhang, J. B. You, J. Liu, et al.., “Steering room-temperature plexcitonic strong coupling: a diexcitonic perspective,” Nano Lett., vol. 21, no. 21, pp. 8979–8986, 2021. https://doi.org/10.1021/acs.nanolett.1c02248.Search in Google Scholar PubMed
[33] Y. J. Niu, H. X. Xu, and H. Wei, “Unified scattering and photoluminescence spectra for strong plasmon-exciton coupling,” Phys. Rev. Lett., vol. 128, no. 16, p. 167402, 2022. https://doi.org/10.1103/PhysRevLett.128.167402.Search in Google Scholar PubMed
[34] X. Han, F. Li, Z. He, et al.., “Double Rabi splitting in methylene blue dye-Ag nanocavity,” Nanophotonics, vol. 11, no. 3, pp. 603–611, 2022. https://doi.org/10.1515/nanoph-2021-0697.Search in Google Scholar
[35] D. M. Coles, N. Somaschi, P. Michetti, et al.., “Polariton-mediated energy transfer between organic dyes in a strongly coupled optical microcavity,” Nat. Mater., vol. 13, no. 7, pp. 712–719, 2014. https://doi.org/10.1038/nmat3950.Search in Google Scholar PubMed
[36] X. Zhong, T. Chervy, S. Wang, et al.., “Non-radiative energy transfer mediated by hybrid light-matter states,” Angew. Chem. Int. Ed., vol. 55, no. 21, pp. 6202–6206, 2016. https://doi.org/10.1002/ange.201600428.Search in Google Scholar
[37] V. C. Nikolis, A. Mischok, B. Siegmund, et al.., “Strong light-matter coupling for reduced photon energy losses in organic photovoltaics,” Nat. Commun., vol. 10, p. 3706, 2019. https://doi.org/10.1038/s41467-019-11717-5.Search in Google Scholar PubMed PubMed Central
[38] M. Hertzog, B. Munkhbat, D. Baranov, T. Shegai, and K. Börjesson, “Enhancing vibrational light–matter coupling strength beyond the molecular concentration limit using plasmonic arrays,” Nano Lett., vol. 21, no. 3, pp. 1320–1326, 2021. https://doi.org/10.1021/acs.nanolett.0c04014.Search in Google Scholar PubMed PubMed Central
[39] K. F. Mak, C. Lee, J. Hone, J. Shan, and T. F. Heinz, “Atomically thin MoS2: a new direct-gap semiconductor,” Phys. Rev. Lett., vol. 105, no. 13, p. 136805, 2010. https://doi.org/10.1103/PhysRevLett.105.136805.Search in Google Scholar PubMed
[40] K. He, N. Kumar, L. Zhao, et al.., “Tightly bound excitons in monolayer WSe2,” Phys. Rev. Lett., vol. 113, no. 2, p. 026803, 2014. https://doi.org/10.1103/PhysRevLett.113.026803.Search in Google Scholar PubMed
[41] Y. Li, A. Chernikov, X. Zhang, et al.., “Measurement of the optical dielectric function of monolayer transition-metal dichalcogenides: MoS2, MoSe2, WS2, and WSe2,” Phys. Rev. B, vol. 90, no. 20, p. 205422, 2014. https://doi.org/10.1103/PhysRevB.90.205422.Search in Google Scholar
[42] B. Lee, W. Liu, C. H. Naylor, et al.., “Electrical tuning of exciton–plasmon polariton coupling in monolayer MoS2 integrated with plasmonic nanoantenna lattice,” Nano Lett., vol. 17, no. 7, pp. 4541–4547, 2017. https://doi.org/10.1021/acs.nanolett.7b02245.Search in Google Scholar PubMed
[43] T. W. Lo, Q. Zhang, M. Qiu, et al.., “Thermal redistribution of exciton population in monolayer transition metal dichalcogenides probed with plasmon–exciton coupling spectroscopy,” ACS Photonics, vol. 6, no. 2, pp. 411–421, 2019. https://doi.org/10.1021/acsphotonics.8b01349.Search in Google Scholar
[44] W. Du, J. Zhao, W. Zhao, S. Zhang, H. Xu, and Q. Xiong, “Ultrafast modulation of exciton–plasmon coupling in a monolayer WS2–Ag nanodisk hybrid system,” ACS Photonics, vol. 6, no. 11, pp. 2832–2840, 2019. https://doi.org/10.1021/acsphotonics.9b00923.Search in Google Scholar
[45] Y. Tang, Y. Zhang, Q. Liu, et al.., “Interacting plexcitons for designed ultrafast optical nonlinearity in a monolayer semiconductor,” Light Sci. Appl., vol. 11, p. 94, 2022. https://doi.org/10.1038/s41377-022-00754-3.Search in Google Scholar PubMed PubMed Central
[46] A. A. Mitioglu, P. Plochocka, J. N. Jadczak, et al.., “Optical manipulation of the exciton charge state in single-layer tungsten disulfide,” Phys. Rev. B, vol. 88, no. 24, p. 245403, 2013. https://doi.org/10.1103/PhysRevB.88.245403.Search in Google Scholar
[47] T. Yan, X. Qiao, X. Liu, P. Tan, and X. Zhang, “Photoluminescence properties and exciton dynamics in monolayer WSe2,” Appl. Phys. Lett., vol. 105, no. 10, p. 101901, 2014. https://doi.org/10.1063/1.4895471.Search in Google Scholar
[48] M. Currie, A. T. Hanbicki, G. Kioseoglou, and B. T. Jonker, “Optical control of charged exciton states in tungsten disulfide,” Appl. Phys. Lett., vol. 106, no. 20, p. 201907, 2015. https://doi.org/10.1063/1.4921472.Search in Google Scholar
[49] X. Fan, W. Zheng, H. Liu, et al.., “Nonlinear photoluminescence in monolayer WS2: parabolic emission and excitation fluence-dependent recombination dynamics,” Nanoscale, vol. 9, no. 21, pp. 7235–7241, 2017. https://doi.org/10.1039/C7NR01345K.Search in Google Scholar
[50] S. P. Zhang, H. Wei, K. Bao, et al.., “Chiral surface plasmon polaritons on metallic nanowires,” Phys. Rev. Lett., vol. 107, no. 9, p. 096801, 2011. https://doi.org/10.1103/PhysRevLett.107.096801.Search in Google Scholar PubMed
[51] D. Pan, H. Wei, Z. L. Jia, and H. X. Xu, “Mode conversion of propagating surface plasmons in nanophotonic networks induced by structural symmetry breaking,” Sci. Rep., vol. 4, p. 4993, 2014. https://doi.org/10.1038/srep04993.Search in Google Scholar
[52] Q. Li, L. Chen, H. X. Xu, Z. W. Liu, and H. Wei, “Photothermal modulation of propagating surface plasmons on silver nanowires,” ACS Photonics, vol. 6, no. 8, pp. 2133–2140, 2019. https://doi.org/10.1021/acsphotonics.9b00711.Search in Google Scholar
Supplementary Material
This article contains supplementary material (https://doi.org/10.1515/nanoph-2022-0701).
© 2023 the author(s), published by De Gruyter, Berlin/Boston
This work is licensed under the Creative Commons Attribution 4.0 International License.
Articles in the same Issue
- Frontmatter
- Reviews
- Advances in electrochromic device technology through the exploitation of nanophotonic and nanoplasmonic effects
- Emerging topics in nanophononics and elastic, acoustic, and mechanical metamaterials: an overview
- Research Articles
- An inverse Faraday effect generated by linearly polarized light through a plasmonic nano-antenna
- Prolonging exciton lifetime of WSe2 monolayer through image dipole interaction leading to huge enhancement of photocurrent
- High-performance waveguide coupled Germanium-on-silicon single-photon avalanche diode with independently controllable absorption and multiplication
- On-chip micro-ring resonator array spectrum detection system based on convex optimization algorithm
- Plasmonic metafiber for all-fiber Q-switched cylindrical vector lasers
- Strong coupling of multiple plasmon modes and excitons with excitation light controlled active tuning
- Plasmonic ultraviolet filter for fast-timing applications
- Tailoring photoluminescence of WS2-microcavity coupling devices in broad visible range
- Tunable replica symmetry breaking in random laser