
Maximized vertical photoluminescence from optical material with losses employing resonant excitation and extraction of photonic crystal modes
-
Jan Fait

 ,
Marián Varga
,
Marián Varga

Abstract
Optical losses of a host material together with the total internal reflection phenomenon can significantly reduce photoluminescence external quantum efficiency of embedded light-emitters. This is not only the case for light-emitting color centers in thin layers of nanocrystalline diamond, but also for silicon nanocrystals in silica dioxide matrices and for some types of perovskite materials. Here, we show that a significant boost (more than 100-fold enhancement) of the directional light emission efficiency from light-emitters in diamond can be achieved by using two-dimensional photonic crystal slabs (PhCs) to extract the light emission into vertical direction (resonant extraction) and at the same time to couple the excitation beam into the structure (resonant excitation). We have further shown that this so-called resonant extraction and excitation scheme provides the highest enhancement when the overlap between the electric field distribution of extraction leaky mode and the region of the excited light-emitters is maximized. This can be achieved by using the same type of the photonic mode for both extraction and excitation, and by optimizing the thickness of a diamond layer. The usage of the same type of modes appears to be more significant than tuning of the Q-factors of the excitation and extraction leaky modes individually. The results of our measurements are supported by the outputs of computer simulations. Our findings may be helpful in designing future PhCs for extraction of luminescence originating from various optoelectronic and sensor devices making use of the unique properties of the diamond. Moreover, our concept can be easily extended to other light-emitting materials with optical losses.
1 Introduction
Low optical quality of a material with otherwise perfect physical and chemical properties can significantly reduce its practical application in the field of photonics. One such material is the nanocrystalline diamond, which shares high mechanical and chemical stability [1], or the ability to host single-photon sources [2], [3] with the monocrystalline diamond. However, its optical quality is significantly worse due to the optical losses and light scattering on grain boundaries [4], [5], [6]. Another material in which optical quality hinders its usage as an efficient light source, for example, as an alternative to the materials used nowadays for organic light-emitting diodes, are halide perovskites [7], [8]. In addition to the optical losses, the relatively high refractive index causes that only a small portion of light within an escape cone is radiated out from the thin layers of these materials [9]. The major part of the emitted light is coupled to guided modes supported by the layer and then gradually absorbed [10]. The extraction is slightly enhanced due to the scattering on inhomogeneities [11], [12]. Nevertheless, the emission has a Lambertian radiation pattern, which requires the usage of sophisticated optical elements in order to achieve reasonable collection efficiency [13].
Various photonic structures can be used for manipulating light emission from materials with absorption and scattering losses [14], [15], [16], [17], [18]. For instance, both the total internal reflection and the amount of absorbed light can be reduced by fabricating a suitable two-dimensional photonic crystal (PhC) on the top of a thin layer [19], [20], [21], [22], [23]. Luminescence of the embedded light-emitters couples to the leaky photonic modes of the PhCs which then radiate to air under defined directions via the Bragg diffraction phenomenon [24]. The extracted emission is thus strongly directional and the far-field radiation pattern can be tuned based on the required application by dimensions of the PhC [25].
This is particularly important for etendue limited applications [26] because then the extracted light can be easily collected by a simple optical system or sent directly onto a detector. Moreover, the amount of absorbed radiation is reduced due to relatively short optical path [27]. Recently, we have shown that by using 2D PhCs on a polycrystalline diamond, up to 14-fold extraction efficiency enhancement of the vertical light emission on a peak wavelength can be achieved [28]. The vertical extraction provides the highest emission intensity with respect to other extraction directions due to the degeneracy of the vertically out-coupled modes [29].
When optical excitation is used for generating emission, the PhC structure can be designed so that the excitation beam is coupled into the layer through an excitation leaky mode. This causes a significant increase of the excitation efficiency and by this also the enhancement of the photoluminescence (PL) intensity without the need to increase the excitation power. The concept which combines excitation and collection via leaky modes was first introduced in 2007 by Ganesh et al. [30], [31], and is called the resonant excitation and extraction, and it is successfully employed for the materials with negligible optical losses and surface deposited light-emitters. The authors argued, and their experiments proved that the main factor affecting the efficiency of this process, are the Q-factors of the excitation and extraction modes. Namely, the high Q-factor of the excitation mode enables the long-lasting localization of the pumping beam within the layer and, on the other hand, the low Q-factor of the extraction mode causes fast out-coupling of the emitted radiation to the desired direction.
In this contribution we demonstrate that the enhancement of the PL intensity into vertical direction from light-emitters distributed homogeneously inside a thin layer with low optical quality can be also significantly enhanced by accommodating the resonant excitation and extraction scheme, but in a specific regime. Namely, we propose and verify that employing one type of the leaky mode for both the excitation and the extraction in combination with maximized coupling of the emission to the extraction mode is pivotal when the emitters are distributed homogeneously inside the material. Further we show that the Q-factor analysis must also include absorption and scattering of light in the material with low optical quality. On the example of a nanocrystalline diamond layer with a PhC on its surface, we demonstrate up to 115-fold PL intensity enhancement at the wavelength of the extraction leaky mode using this approach. The nanocrystalline diamond was chosen because it comprises optical losses due to absorption and scattering [4], and in the same time it possesses spectrally broad visible PL [32]. The latter enabled us to elaborate this scheme for both the fundamental TE and TM modes on the similar sample. Finally, we demonstrate that our experimental results agree with the outputs of the simulations.
2 Sample design
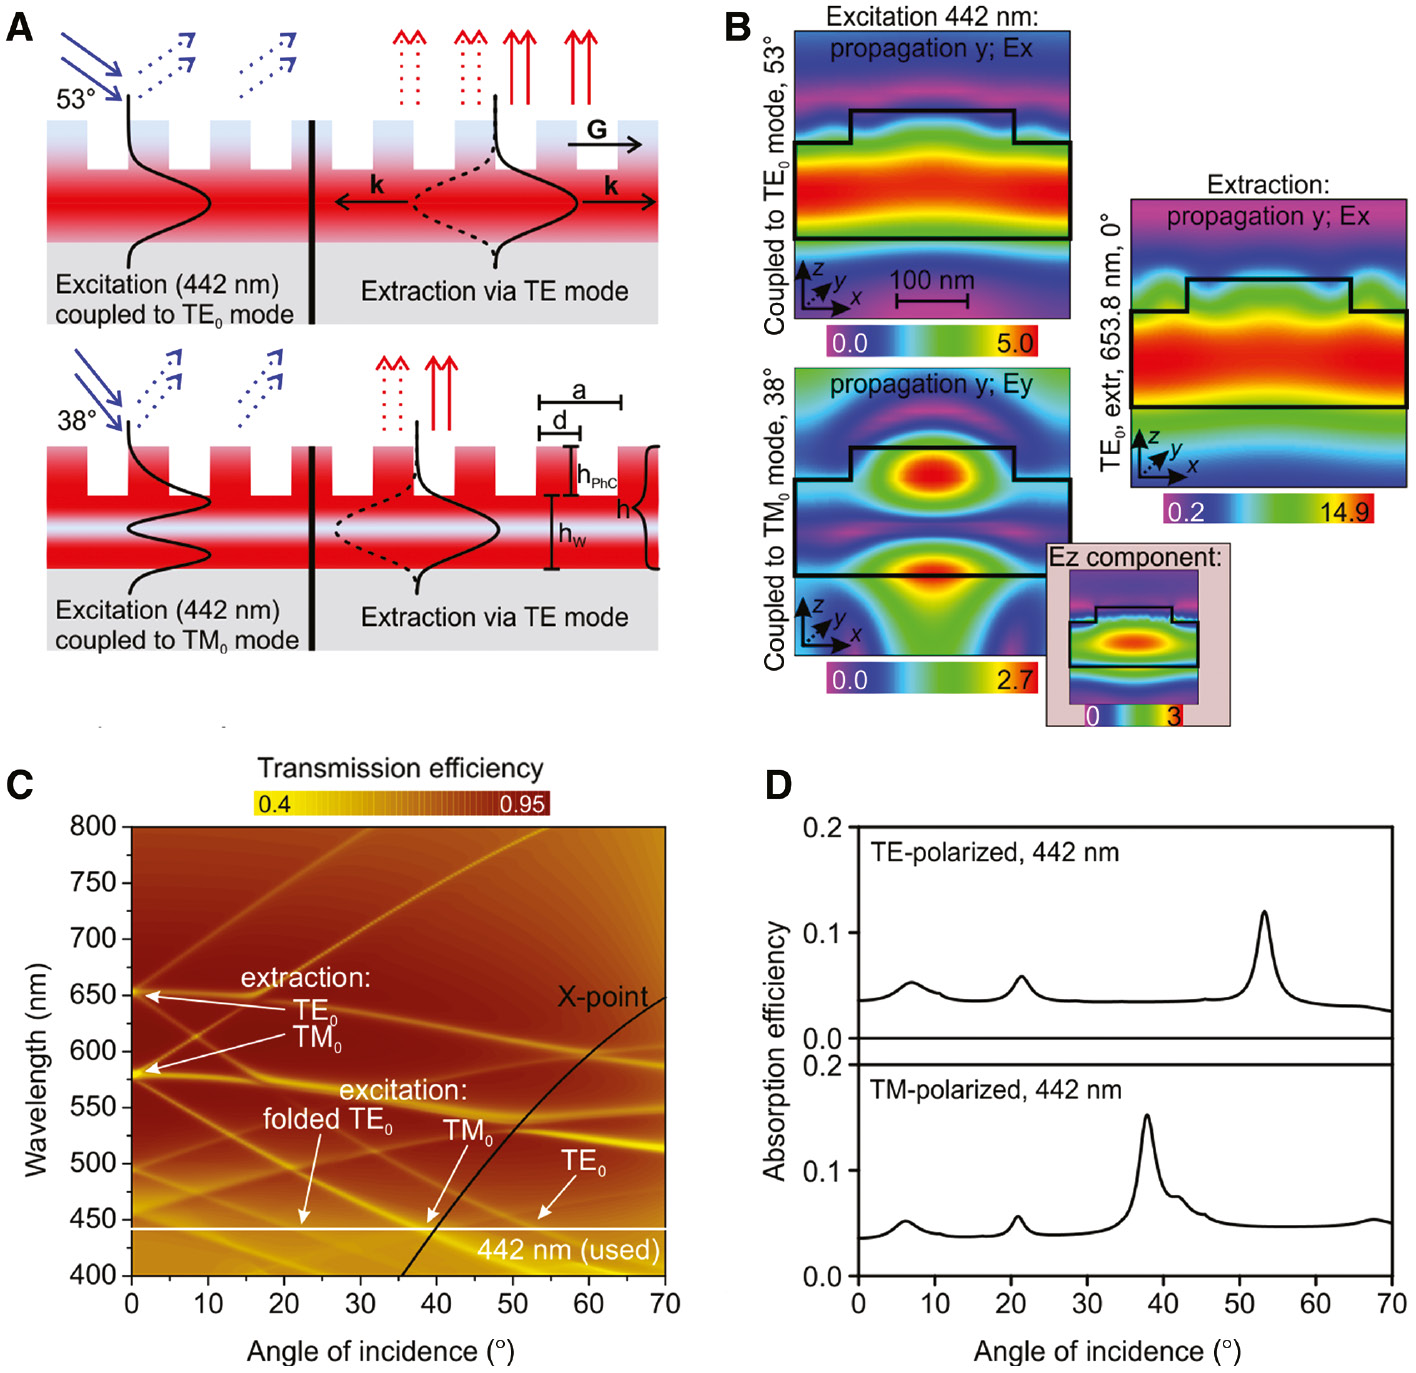
The PhCs were designed with a goal to achieve resonant excitation with blue (or green) laser and, at the same time, efficient resonant extraction of the wavelengths within a red spectral region. The resonant excitation and resonant extraction scheme includes the following steps (Figure 1A): (1) in-coupling of blue excitation beam into the leaky mode of the photonic structure, (2) absorption of the in-coupled light by the material, (3) emission of red PL from the excited emitters and its subsequent coupling into the extraction leaky mode, and (4) out-coupling of the light via the extraction leaky mode into the vertical direction. Some other effects such as direct absorption of laser beam or direct emission from the material into space also contribute to the observed PL intensity in a vertical direction. However, their contribution is marginal, and we concentrate solely on the resonant excitation and extraction scheme.
Principle of light extraction via leaky modes and the properties of leaky modes.
(A) Schematic sketch of the resonant excitation (left part of the image) and extraction (right part) of photoluminescence (PL) via Bragg diffraction of leaky modes. Excitation laser (blue solid arrows) is coupled into the leaky mode of the photonic crystal (PhC) (black solid curve). While propagating in the material, it is partially absorbed (red region) and partially diffracted out (blue dashed arrows). The excited emitters (located in red region) then emit light that partially couples to the extraction leaky mode (black solid and dashed curves) and is diffracted out from the material (red arrows). Spatial overlap of the excited region (defined by the excitation leaky mode) with the extraction leaky mode is crucial for maximizing PL enhancement using the resonant excitation/extraction scheme. (B) Simulated electric field intensity for the PhC-A sample (see Figure 2) for TE0 and TM0 excitation mode (left) and TE0 extraction mode (right). Note that the TM0 mode has two nonzero components of E-field with different distributions. The black line shows the boarders of PhC unit cell. The intensity of the field is normalized to the unit amplitude of the incident wave. See Figure S5 in Suppl. info for simulations of field components of all modes relevant for the discussion throughout the paper. (C) Simulated photonic band diagram of PhC-A sample for angles of incidence between 0° and 70°. The graph shows the transmission efficiency of unpolarized light for given wavelength and angle of incidence. (D) Simulated absorption efficiency of PhC-A as a function of the angle of incidence (between 0° and 70°). Increased absorption at 442 nm matches the position of leaky modes in (C). The effects of scattering and fabrication defects are not included.
The steps (1), (2), and (4) depend on the dimensions of the PhC and their efficiency can be described by the Q-factors of the excitation and extraction leaky modes. The total Q-factor of the mode is composed of three contributions, which quantify the losses caused by individual mechanisms:
where ω0 is the central frequency of the leaky mode and Δω is the leaky mode full width at half maximum and Qdif, Qabs, and Qscat characterizes the losses caused by Bragg diffraction, absorption, and scattering (both on material inhomogeneities and on defects caused by fabrication) of light, respectively. The out-coupling efficiency of a leaky mode from the PhC slab is maximized when the Qdif is minimized, and simultaneously Qabs and Qscat are maximized. Subsequently, most of the light is diffracted into defined direction instead of being absorbed or randomly scattered. On the other hand, the excitation efficiency is maximized when Qabs is minimized, and Qdif and Qscat are maximized. The low Qabs implies high absorption and high Qdif and Qscat extend the optical path of the mode in the material. The absorption and scattering losses are given by characteristics of the material, which we do not try to tune (although it is possible by changing the deposition conditions). Nevertheless, all, Qdif, Qabs, and Qscat, can be changed by the physical dimensions of the PhC. Note that it follows from the above-discussion, that the Qdif and Qabs requirements on the extraction and excitation leaky modes are exactly opposite.
The efficiency of step (3) depends on the single-mode local density of optical states (SM-LDOS) that quantifies the power that is coupled to the specific mode from the dipole source. Note that the total LDOS is higher than SM-LDOS because it includes also light that couples to other modes and the light that is directly radiated to space. The spatial profile of the SM-LDOS is proportional to the electric field distribution of the respective mode. The efficiency of step (3) is thus proportional to the spatial integral overlap between the electric field distribution of the extraction mode (black curve in the right part of Figure 1A) and the region of excited light-emitters (red-colored region in Figure 1A), in accordance with Fermi’s golden rule [33]. The distribution of excited light-emitters follows the intensity profile of the excitation leaky mode, when resonant excitation is used. Figure 1A outlines this situation for two cases of the excitation mode: fundamental TE (TE0) and fundamental TM (TM0). Clearly, the highest spatial overlap between the excited region and the electric field distribution of extraction mode is achieved when both excitation and extraction is done via the leaky modes with similar intensity distributions (Figure 1A top), i.e. modes of the same type (TE or TM) and order. When two different modes are used (e.g. TM0 for excitation and TE0 for extraction Figure 1A bottom) the spatial overlap is reduced. The simulated electric field distribution for the modes is shown in Figures 1B and S5 in the Suppl. info. We chose the TE0 mode for extraction and excitation as it has the highest overlap of the electric field distribution with the layer, and thus provides the highest SM-LDOS, when the light-emitters are distributed homogeneously in the layer, as we confirmed also experimentally. On the other hand, TM0 mode is advantageous when the emitters are located near the surface because its electric field distribution is localized near edges of the structure (Figure 1B).
Overall, for maximizing the efficiency of the whole excitation/extraction process, we require high Qdif for excitation leaky mode, low Qdif for extraction leaky mode, and the usage of the same type and order of the excitation and extraction leaky mode. However, it is not possible to fulfill all the three requirements in the same time as the Q-factors on one photonic mode branch cannot be tuned separately. As we will show, the excitation/extraction scheme realized via the similar mode is for the case of materials with low optical quality, and emitters inside the material more important than choosing different types of modes with ideal Q-factors.
The other factor that influences the efficiency of the step (3) is the thickness of the diamond layer. Optimal layer thickness, for which the SM-LDOS in PhC is maximized, exist for each mode [34]. Both LDOS and SM-LDOS can be estimated by performing 3D finite-difference time-domain (FDTD [35]) simulations. For the case of waveguide that supports only fundamental modes, the FDTD simulation directly shows the amount of light coupled to the respective photonic mode, which is proportional to the SM-LDOS of that mode [36]. We performed simulations for the dipole source placed in the middle, in the top and bottom quarter, and on the top and bottom edge of the planar diamond waveguide (Suppl. info section: 2. coupling efficiency to modes). The simulation confirms that the coupling efficiency depends on the electric field distribution of the modes. For instance, the highest portion of light is coupled to the TE0 mode for the dipole source positioned in the middle of the waveguide, because the TE0 mode has maximal electric field there. Moreover, we used a wide-frequency source, which allows to detect the optimal thickness-to-wavelength ratio for obtaining optimal coupling of emitted light to the guided mode (the ratio for which the SM-LDOS of the extraction mode is maximized).
The optimal thickness of diamond layers (nD=2.32, see Figure S7 in Suppl. info) on SiO2 substrate
Upon acquiring the optimal thickness (hw) for the main waveguiding layer, we computed dimensions (lattice constant a, column diameter d, and column height hPhC, see the schematic image in Figure 1A) of square-lattice PhCs to be fabricated on the top of it. We designed and fabricated two PhC structures (Figure 2) to support vertical extraction of the PL in red spectral region via TE0 leaky mode. The first structure (PhC-A) had waveguiding layer (hw, see Figure 1A) within the range of the optimal thickness. The second structure (PhC-B) was designed to have low Qdif on extraction wavelength, which denotes more effective out-coupling of the extraction leaky mode into the vertical direction. The total thickness (h=hw+hPhC) was 160 nm for both samples. The main idea was to show that the effect of efficient coupling to extraction mode (pronounced in PhC-A) leads to better overall enhancement than high efficiency in out-coupling of the extraction leaky mode alone (PhC-B; Figure S13 in Suppl. info shows the TE0 mode profile of this sample). The square symmetry was chosen because it has less complicated photonic band structure than the hexagonal one and the effect of resonant excitation/extraction can be thus more easily demonstrated.
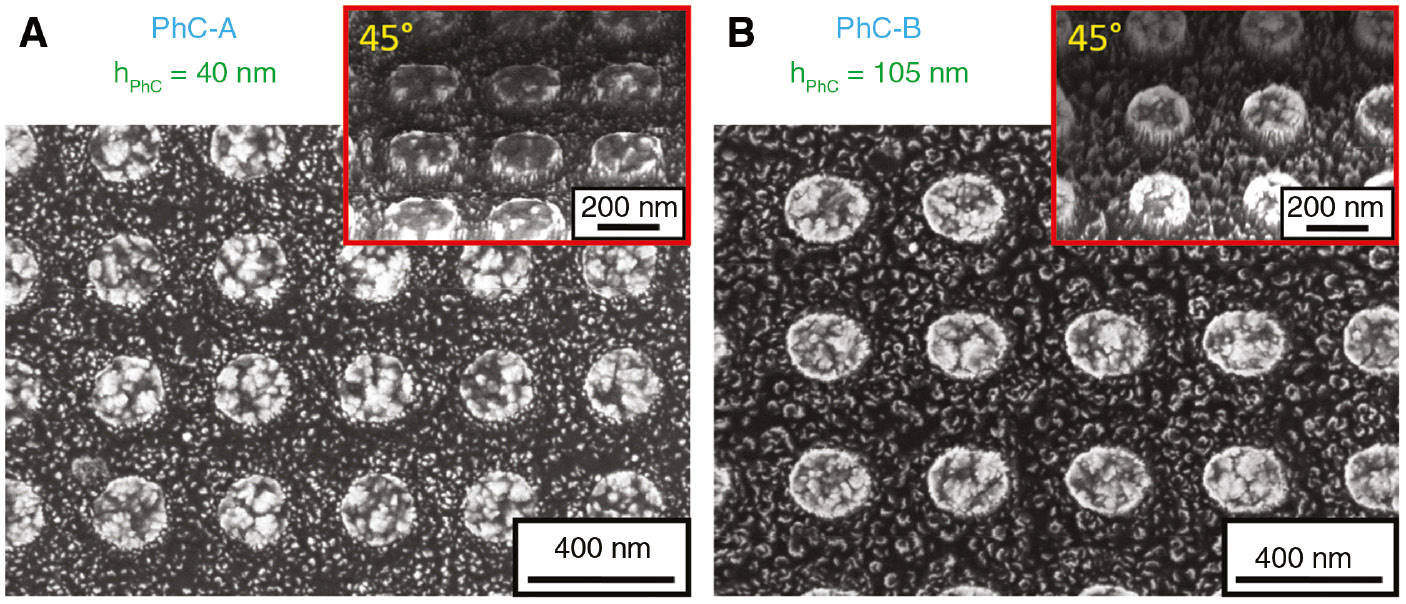
Scanning electron microscopy micrographs of the diamond-based 2D PhCs.
(A) PhC-A: lattice constant a=345 nm, column diameter d=205 nm, thickness of diamond layer before etching h=160 nm, and thickness of diamond layer after etching hw=120 nm. (B) PhC-B: lattice constant a=390 nm, column diameter d=215 nm, thickness of diamond layer before etching h=160 nm, and thickness of diamond layer after etching hw=55 nm. The insets show the morphology of respective samples under 45° angle.
3 Results
3.1 PL enhancement
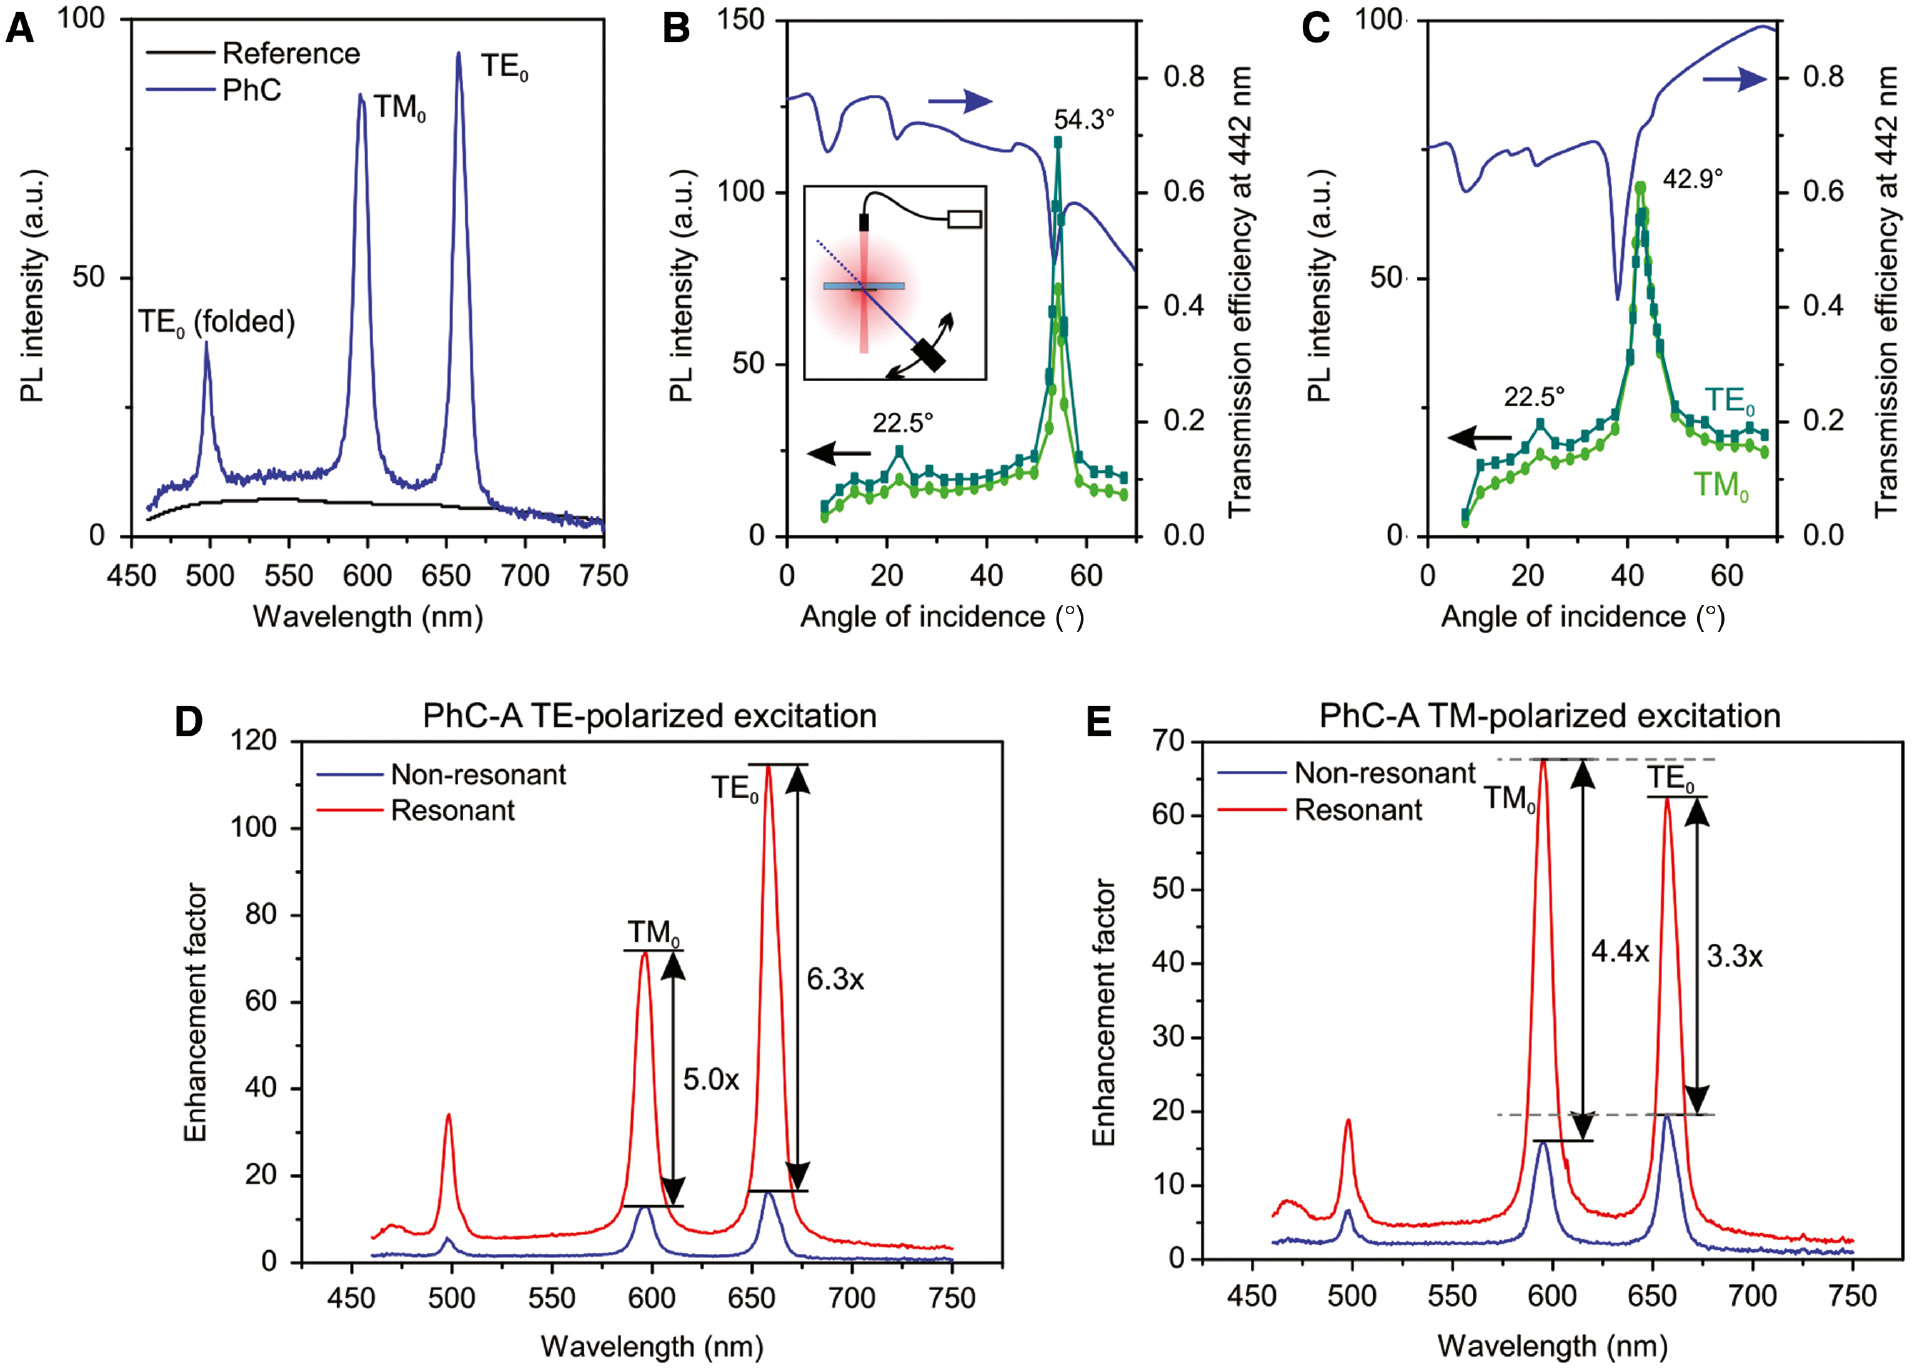
The sample was excited with the TE (s) or TM (p) polarized cw laser beam (442 nm) incident along the Γ-X [37] direction of high symmetry. The excitation angle of incidence was varied from 7.5° to 67.5° and the PL signal was collected with an optical fiber being perpendicular with respect to the sample surface in order to collect only the normally extracted leaky modes within a small collection cone. An example of such a PL spectrum for the nonresonant excitation of the PhC-A is shown in Figure 3A. The extraction leaky modes are manifested as sharp resonances at particular wavelengths. Their spectral positions are in agreement with the computed ones (Figure 1C).
PL spectra and enhancement factor under non-resonant and resonant excitation.
(A) The comparison of PL intensity measured on plain diamond layer (black) and on PhC-A (blue, nonresonant excitation). (B, C) The normalized PL intensity measured on PhC-A sample at the wavelength of the TE0 (658 nm) and TM0 (596 nm) extraction leaky mode as a function of the angle of incidence of the excitation beam (the connecting lines are guides to the eye), and rigorous coupled-wave analysis (RCWA) simulated transmission efficiency of the excitation beam (442 nm-blue line): (B) TE-polarized excitation beam; inset shows the measurement setup (see Suppl. info for details), (C) TM-polarized excitation beam. (D, E) The enhancement factor of PhC-A sample when excited with (D) TE-polarized and (E) TM-polarized excitation beam.
Figure 3B plots the measured PL intensity at the wavelength of the TE0 extraction mode as a function of the excitation angle for the TE excitation of the PhC-A. The two PL signal maxima, one at around 22.5° and the other at 54.3°, occur at the similar angles as the leaky modes in the simulated curve of the transmission efficiency of the excitation laser, which implies that the enhancement of the signal is due to resonant in-coupling of the excitation laser into the structure. Similarly, the TM polarized excitation beam is coupled to TM0 mode when incident at 42.9° (Figure 3C). Here the correspondence with the computed transmission spectrum is not perfect, which is caused by the inaccuracy of numerical simulation for TM0 mode as explained in Suppl. info (Figure S12).
As a next step, the performance of the PhCs with respect to the light emission enhancement was evaluated via an enhancement factor, which we define as a ratio of the PL intensity measured on the PhC (IPhC) to the PL intensity measured on the unpatterned diamond layer (Iref) with thickness h. Figure 3D and E shows the dependence of the enhancement factor on the emission wavelength for the resonant excitation via TE0 and TM0, respectively, in comparison to the nonresonant excitation for the PhC-A. The total enhancement factor (EFtot) can be written as
where the EFleaky is the contribution of leaky modes to the PL and the EFLamb is the spectrally independent enhancement of the Lambertian radiation (further denoted as a Lambertian enhancement factor) being simply the enhancement of the radiation not coupled to guided or leaky modes. The correction −1 must be added so that the total enhancement remains 1 if both the EFLamb and EFleaky are equal to 1 (i.e. the PL is not enhanced). Numerical values of the PL enhancement factors at the peak wavelengths of the extraction modes are summarized in Table 1. For the PhC-A, various combinations of the extraction and excitation leaky modes were evaluated, whereas for the PhC-B, only the combination relevant for the discussion is listed.
Enhancement factors for the photonic crystal (PhC)-A and PhC-B samples (for detailed explanation see the main text).
| PhC-A | PhC-B | ||||||
|---|---|---|---|---|---|---|---|
| Extraction mode | TE0 | TM0 | TE0 | TM0 | TE0 | ||
| Excitation mode | TE0 | TE0 | TM0 | TM0 | TE0 | ||
| Total enhancement factor | 114.7 | 71.9 | 62.9 | 67.6 | 67.7 | ||
 | Lambertian enh.a | 6.1 | 6.1 | 4.8 | 4.8 | 7.6 | |
| Leaky mode enh. | 109.6 | 66.8 | 58.8 | 63.8 | 61.1 | ||
 | Extraction enh. | 17.4 | 13.4 | 17.7 | 14.4 | 21.5 | |
| Excitation enh. | 6.3 | 5.0 | 3.3 | 4.4 | 2.8 | ||
Various combinations of excitation/extraction modes were measured for PhC-A. Note that the excitation enhancement factor includes both, the in-coupling (Q-factor related) and field overlap (between excitation/extraction leaky modes) effects. aLambertian enhancement factor under resonant excitation.
As Table 1 shows for the PhC-A, the listed values of the Lambertian enhancement factor depend on the polarization of the excitation beam mainly because they reflect the enhancement with the resonant excitation. The radiation resonantly coupled to the TE0 excitation leaky mode has higher spatial overlap with the emitters than the TM0 mode and thus it provides higher excitation efficiency and subsequently the increase of the overall PL. The EFLamb values then naturally remain approximately constant over the whole PL spectrum (we have observed only small variations due to the Fabry-Pérot resonances). The Lambertian enhancement factor is much smaller for nonresonant excitation, where it may be caused by several factors: (1) diffraction of light on the PhC into the first real diffraction order, which changes the electric field distribution of excitation beam inside the sample, (2) different volume and surface of the PhC with respect to the reference layer, and (3) Fabry-Pérot resonances. Overall, the Lambertian enhancement factor presents only about 5% of the total PL enhancement (Table 1). The remaining 95% of the PL enhancement is due to leaky modes enhancement.
The leaky modes enhancement factor (at the wavelength of the leaky mode λ0) can be divided into (1) pure extraction enhancement factor (EFExtr) measured under nonresonant excitation angle and (2) resonant excitation enhancement factor (EFExcit):
The highest, 110-fold leaky mode enhancement was obtained for the TE0 resonant excitation and the TE0 extraction leaky mode of the PhC-A (Figure 3D), which is six times more than for the nonresonant excitation (Table 1). For the TM0 leaky extraction mode, the enhancement is around 67× when excited with TE0 mode. On the other hand, for the TM0 resonant excitation (Figure 3E), the PL enhancement at the TE0 extraction mode is only around 59× whereas it is higher for the TM0 extraction (64×). Clearly, the overlap of the excitation and the extraction modes (both TM0) outweighs the fact that the structure is optimized for the extraction via the TE0 mode. However, in overall the enhancement factor is much smaller than that obtained at this sample with TE0 resonant excitation and extraction (Table 1), because the spatial overlap of the TM0 mode with diamond and hence with the light-emitters is smaller than for the TE0 mode (Figure 1B). These experimental results confirm our hypothesis that the PL emission can be significantly enhanced when coupling and out-coupling is realized via the photonic modes of the same type and order.
Furthermore, the extraction enhancement factors for a single type of the extraction mode are (within the error of the measurements) similar for both polarizations of the excitation beam, for example 17.4× and 17.7× (Table 1) for the TE0 extraction mode. This is due to the fact that the diamond light-emitters do not possess any preferential orientation in the layer and thus respond similarly to both polarizations of the excitation beam.
For the case of PhC-B, the total enhancement factor is around 61, which is approximately three times more than for the nonresonant excitation (Table 1). The effect of resonant excitation is significantly lower when compared to PhC-A sample because the thickness of the waveguiding layer (hw) is not optimized for resonant excitation and extraction scheme. On the other hand, as designed, the sample has higher extraction enhancement factor than PhC-A due to higher spatial overlap of the TE0 with the PhC structure.
3.2 Q-factor analysis
The excitation and extraction enhancement can be contrasted with the Q-factor analysis. The Q-factors in Table 2 were extracted from measured and simulated band diagrams (Figure 4) and their computation is described in Suppl. info (Section 4, Experimental). The main cause of losses for TE0 leaky mode is absorption (low Qabs) because this mode is localized in the material and has thus high overlap with the lossy material. On the other hand, the losses of TM0 mode are caused primarily by Bragg diffraction (low Qdif) and scattering on surface defects (low Qscat) as this mode is localized on the edge of the structure, where the PhC and fabrication defects are located.
The total Q-factor (Q) of leaky modes, which we determined from transmission measurement, is divided according to the type of losses: diffraction losses Qdif, absorption losses Qabs, and scattering losses Qscat.
| Leaky mode | PhC-A | PhC-B | ||||
|---|---|---|---|---|---|---|
| TE0 | TM0 | TE0 | ||||
| Wavelength (nm) | 658 | 442 | 596 | 442 | 631 | 442 |
| Q | 82 | 61 | 36 | |||
| Qdif | 344 | 340 | 187 | 114 | 67 | 29 |
| Qabs | 142 | 116 | 207 | 130 | 242 | 315 |
| Qscat | 445 | 161 | 115 | |||
The relationship between Q-factors is given by (1).
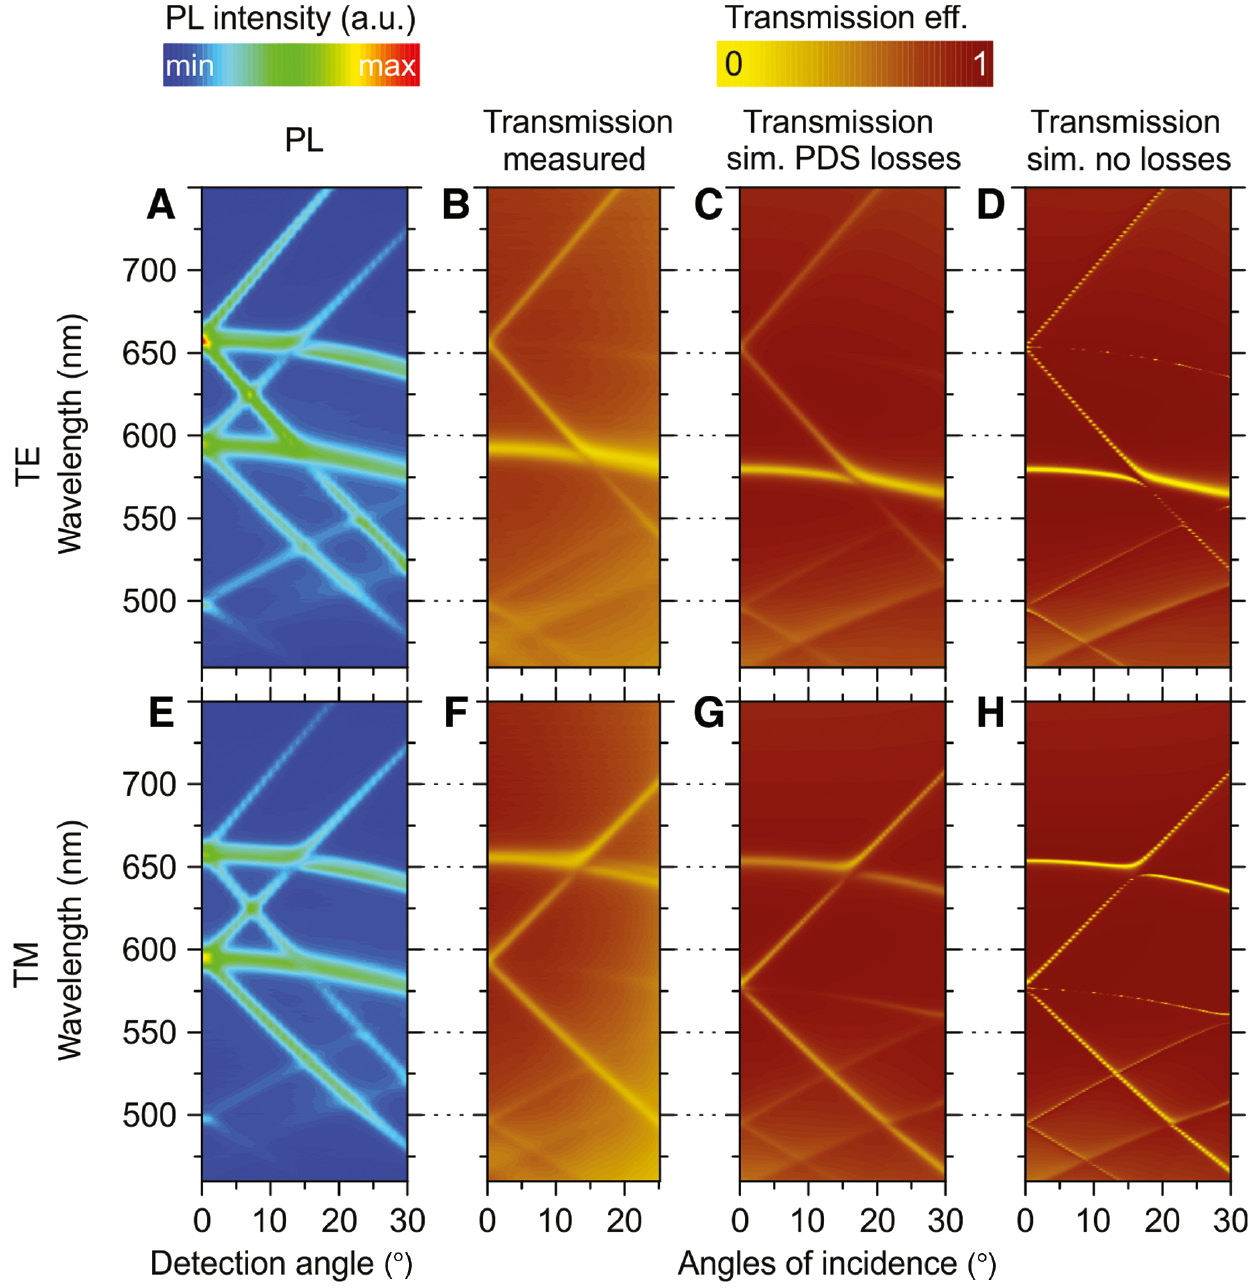
Measured PL spectra (PhC-A) as a function of the extraction angle, and transmission band diagrams.
(A) Angle-resolved PL spectra excited by TE-polarized laser beam incident at the resonant angle of 54.3° and (E) excited by the TM-polarized laser beam incident at the resonant angle of 42.9°. Measured (B), RCWA simulated with losses (C), and simulated without losses (D) transmission efficiency as a function of the angle of incidence (along the Γ-X direction of high symmetry) for the TE-polarized light. (F–H) Same for the TM-polarized light.
For the efficient out-coupling of the leaky modes high Qabs and Qscat, and low Qdif is desirable. This assures that the PL coupled to the leaky mode is diffracted into the desired (normal) direction instead of being absorbed or scattered into random direction on material inhomogeneities and structural defects. When the Q-factors of TE0 and TM0 leaky modes of PhC-A are compared (Table 2), the TM0 mode should work better for out-coupling. However, the highest extraction (i.e. under nonresonant excitation) enhancement factor around 17.5× was obtained with the TE0 extraction mode (Table 1). The reason is that the Q-factor describes only the out-coupling of leaky modes from the structure and not the initial coupling of the PL to leaky modes, which was optimized for the TE0 mode via the optimal thickness. Here the higher SM-LDOS of TE0 mode plays more significant role than the better out-coupling of the TM0 leaky mode from the structure. This clearly manifests the importance of both the spatial overlap between the extraction mode profile with the distribution of the excited light-emitters and the optimized thickness of the layer for coupling to this TE0 mode.
In the case of excitation efficiency, the high Qdif and Qscat, and low Qabs are desirable. In such a case the excitation beam stays long in the PhC and is simultaneously efficiently absorbed. Based on the Q-factors (Table 2) the TE0 mode works best for the excitation efficiency, which is in accordance with the measured excitation enhancement factor (Table 1). Nevertheless, in the value of the excitation enhancement factor, also the overlap between the excitation and extraction mode plays an important role, which is evidenced by dependence of the excitation enhancement (Table 1) on the extraction leaky mode. Note, that although the thickness of the layer is optimized to achieve highest SM-LDOS for TE0 mode at wavelengths around 650 nm, the excitation TE0 leaky mode is even more localized in the layer because of shorter wavelength. The reduced SM-LDOS is not important for the absorption efficiency.
The in-coupling of excitation beam into structure is affected not only by the diffraction Q-factor but also by the monochromacy and directivity of light. The high Qdif is advantageous only for monochromatic and highly directional light in this respect. The total excitation enhancement (absorbed energy) can be partially simulated by rigorous coupled-wave analysis (RCWA) simulations (see Figure 1D). Nevertheless, it does not count with the scattering of light and fabrication imperfections, which decrease the overall performance.
For the case of PhC-B the diamond layer is thinner (hw) than for the PhC-A, whereas the PhC columns are higher (hPhC). The TE0 mode is thus more spread outside diamond layer, which decreases its single-mode local density of optical states in the diamond and increases its interaction with PhC structure that causes faster diffraction. The effect on Q-factors is that Qdif is low and Qabs high. As a result, the PhC-B should work better for extraction and worse for excitation when compared to the PhC-A sample, which we observed (Table 1).
4 Discussion and conclusion
The importance of spatial overlap of the extraction and excitation leaky mode may be manifested by considering the competition in PL extraction between the supported modes. The 78–124 nm thick diamond layer supports both TE0 and TM0 modes at all wavelengths. Each mode is diffracted into vertical direction at different extraction wavelength. The other mode also exists for these wavelengths, but it is extracted into different direction, e.g., the steep TM0 band crossing the TE0 extraction wavelength at around 17° (Figure 4A). Nevertheless, Figure 4A clearly shows that the steep TM0 extraction band is weaker for resonant excitation with TE0 mode when compared to the resonant excitation with TM0 mode (Figure 4E). Similarly, the steep TE0 extraction band is weaker in Figure 4E.
A significant portion of PL intensity coupled to TE0 (or TM0) mode is lost due to diffraction into nonvertical angles (flat bands in Figure 4A,E). The light diffracted into these directions can be collected by placing the optical fiber closer to the sample or by using objectives with higher numerical aperture. Nevertheless, it leads to the loss of spectral selectivity of leaky modes, because other wavelengths are also diffracted into these directions. Note that the spectral selectivity is especially important for sensing applications.
Figure 4 also compares the simulated and measured transmission efficiency. The most prominent difference between the simulated and measured transmission efficiency lies in the shift of the TM0 mode spectral position. The difference originates from localization of electric field of this mode near the diamond surface as described in Suppl. info (Section 6, TM-polarized excitation).
The PhC structures under the study were designed to obtain high vertical PL enhancement in the red part of the visible spectrum. This is spectrally near to zero phonon spectral lines of negatively charged nitrogen vacancy (637 nm) or silicon vacancy (738 nm) color centers [2], [38], [39], which are potential single photon sources [3] and sensing components [40], [41]. Even though there were no (or very few) color centers in the present samples, they can be introduced into the diamond using ion implantation technique or directly during fabrication of new samples [42], [43]. The spectral position of the leaky modes may be shifted to the emission peak of the color center by adjusting the lattice constant [24]. However, due to the fabrication imperfections, tuning of the PhC structures to an exact a priori selected wavelength is not possible. Nevertheless, fine tuning of the extraction resonance spectral position can be done by postprocessing: overgrowth of the PhC structures with thin diamond layer to increase layer height or sample etching to reduce the layer height. The former was used for fabrication and spectral tuning of leaky resonances by bottom-up approach [28]. Also note that the spectral shift of resonances is not detrimental for excitation in-coupling as it only requires slight adjustment of the excitation beam angle of incidence. Furthermore, Figure 1C shows that the same TE0 excitation mode can be excited also by other wavelengths if the resonant angle is shifted appropriately. Moreover, other resonant angles exist also for the excitation in the other direction of high symmetry, the Γ-M direction. Finally, the TM0 leaky mode has high field intensity located on the PhC surface (Figure 1B). Combination of near-surface color centers sensitive to the changes of surroundings with a photonic crystal tuned at the TM0 resonance is, therefore, promising for increased optical sensor sensitivity.
To conclude, we have shown that the resonant excitation/extraction scheme can be used to achieve 115-fold enhancement of PL intensity originating from light-emitters in nanocrystalline diamond-based photonic crystals. Even though that the nanocrystalline diamond possesses relatively high optical losses, the achieved enhancement is comparable to that obtained for a material with negligible losses [30]. In order to reach such enhancement, we have shown that both the spatial overlap between the excitation and the extraction leaky mode, and the spatial overlap between the light-emitters and the extraction leaky mode must be maximized. This condition is fulfilled for the TE0 leaky mode used both for the excitation in-coupling and for the extraction of PL in the case of nanocrystalline diamond PhCs. The usage of the same mode for both excitation and extraction is more important than tuning of the Q-factors of excitation and extraction leaky modes individually. Moreover, the Q-factor must be separated into the effect of Bragg diffraction, absorption, and scattering in order to reasonably explain the excitation/extraction efficiency of the leaky modes. Our results, even though obtained on a specific material, can be extended towards any dielectric material with optical losses.
Acknowledgments
This work was supported by the Czech Science Foundation (GAČR) (16-09692Y); Czech Technical University (CTU) (SGS18/179/OHK4/3T/13); and projects of Operational Programme Research, Development and Education financed by European Structural and Investment Funds and the Czech Ministry of Education, Youth and Sports (CZ.02.1.01/0.0/0.0/15_003/0000464 and CZ.02.1.01/0.0/0.0/16_019/0000760). It occurred in the frame of LNSM infrastructure. We would like to acknowledge Prof. I. Pelant for fruitful discussions.
References
[1] Philip J, Hess P, Feygelson T, et al. Elastic, mechanical, and thermal properties of nanocrystalline diamond films. Appl Phys 2003;93:2164–71.10.1063/1.1537465Search in Google Scholar
[2] Iakoubovskii K, Adriaenssens GJ. Optical detection of defect centers in CVD diamond. Diamond Relate Mater 2000;9: 1349–56.10.1016/S0925-9635(00)00248-XSearch in Google Scholar
[3] Aharonovich I, Castelletto S, Simpson DA, Su C-H, Greentree AD, Prawer S. Diamond-based single-photon emitters. Rep Prog Phys 2011;74:076501.10.1088/0034-4885/74/7/076501Search in Google Scholar
[4] Varga M, Remes Z, Babchenko O, Kromka A. Optical study of defects in nano-diamond films grown in linear antenna microwave plasma CVD from H2/CH4/CO2 gas mixture. Phys Status Solidi B 2012;249:2635–9.10.1002/pssb.201200154Search in Google Scholar
[5] Nesládek M, Meykens K, Stals LM, Vaněček M, Rosa J. Origin of characteristic subgap optical absorption in CVD diamond films. Phys Rev B 1996;54:5552–61.10.1103/PhysRevB.54.5552Search in Google Scholar PubMed
[6] Balmer RS, Brandon JR, Clewes SL, et al. Chemical vapour deposition synthetic diamond: materials, technology and applications. J Phys Condens Matter 2009;21:364221.10.1088/0953-8984/21/36/364221Search in Google Scholar PubMed
[7] Tan Z-K, Moghaddam RS, Lai ML, et al. Bright light-emitting diodes based on organometal halide perovskite. Nat Nanotechnol 2014;9:687–92.10.1038/nnano.2014.149Search in Google Scholar PubMed
[8] Stranks SD, Snaith HJ. Metal-halide perovskites for photovoltaic and light-emitting devices. Nat Nanotechnol 2015;10:391–402.10.1038/nnano.2015.90Search in Google Scholar PubMed
[9] Fujii T, Gao Y, Sharma R, Hu EL, DenBaars SP, Nakamura S. Increase in the extraction efficiency of GaN-based light-emitting diodes via surface roughening. Appl Phys Lett 2004;84:855–7.10.1063/1.1645992Search in Google Scholar
[10] Ondič L, Kůsová K, Cibulka O. Enhanced photoluminescence extraction efficiency from a diamond photonic crystal via leaky modes. New J Phys 2011;13:063005.10.1088/1367-2630/13/6/063005Search in Google Scholar
[11] Uzunoglu NK, Fikioris JG. Scattering from an inhomogeneity inside a dielectric-slab waveguide. J Opt Soc Am 1982;72:628–37.10.1364/JOSA.72.000628Search in Google Scholar
[12] Schnitzer I, Yablonovitch E, Caneau C, Gmitter TJ, Scherer A. 30% external quantum efficiency from surface textured, thin-film light-emitting diodes. Appl Phys Lett 1993;63:2174–6.10.1063/1.110575Search in Google Scholar
[13] Moreno I, Sun C-C. Modeling the radiation pattern of LEDs. Opt Exp 2008;16:1808–19.10.1364/OE.16.001808Search in Google Scholar
[14] Checoury X, Néel D, Boucaud P, et al. Nanocrystalline diamond photonics platform with high quality factor photonic crystal cavities. Appl Phys Lett 2012;101:171115.10.1063/1.4764548Search in Google Scholar
[15] Wang CF, Hanson R, Awschalom DD, et al. Fabrication and characterization of two-dimensional photonic crystal microcavities in nanocrystalline diamond. Appl Phys Lett 2007;91:201112.10.1063/1.2813023Search in Google Scholar
[16] Kreuzer C, Riedrich-Möller J, Neu E, Becher C. Design of photonic crystal microcavities in diamond films. Opt Exp OE 2008;16:1632–44.10.1364/OE.16.001632Search in Google Scholar
[17] Makarov S, Furasova A, Tiguntseva E, et al. Halide-perovskite resonant nanophotonics. Adv Opt Mater 2019;7:1800784.10.1002/adom.201800784Search in Google Scholar
[18] Richter JM, Abdi-Jalebi M, Sadhanala A, et al. Enhancing photoluminescence yields in lead halide perovskites by photon recycling and light out-coupling. Nat Commun 2016;7:13941.10.1038/ncomms13941Search in Google Scholar PubMed PubMed Central
[19] Wierer JJ, David A, Megens MM. III-nitride photonic-crystal light-emitting diodes with high extraction efficiency. Nat Photon 2009;3:163–9.10.1038/nphoton.2009.21Search in Google Scholar
[20] Wiesmann C, Bergenek K, Linder N, Schwarz UT. Photonic crystal LEDs – designing light extraction. Laser Photon Rev 2009;3:262–86.10.1002/lpor.200810053Search in Google Scholar
[21] Matioli E, Weisbuch C. Impact of photonic crystals on LED light extraction efficiency: approaches and limits to vertical structure designs. J Phys D: Appl Phys 2010;43:354005.10.1088/0022-3727/43/35/354005Search in Google Scholar
[22] Inoue T, Zoysa MD, Asano T, Noda S. Realization of narrowband thermal emission with optical nanostructures. OPTICA 2015;2:27–35.10.1364/OPTICA.2.000027Search in Google Scholar
[23] Krishnan C, Brossard M, Lee K-Y, et al. Hybrid photonic crystal light-emitting diode renders 123% color conversion effective quantum yield. OPTICA 2016;3:503–9.10.1364/OPTICA.3.000503Search in Google Scholar
[24] Joannopoulos JD, Johnson SG, Winn JN, Meade RD. Photonic crystals: molding the flow of light, 2nd ed. Princeton and Oxford, Princeton University Press, 2011.10.2307/j.ctvcm4gz9Search in Google Scholar
[25] Wu S, Xia H, Xu J, Sun X, Liu X. Manipulating luminescence of light emitters by photonic crystals. Adv Mater 2018;30:1803362.10.1002/adma.201803362Search in Google Scholar PubMed
[26] Wilm A. Requirements on LEDs in etendue limited light engines, in: photonics in multimedia II. Int Soc Optics Photonics 2008;7001:70010F.10.1117/12.781199Search in Google Scholar
[27] Zelsmann M, Picard E, Charvolin T, et al. Seventy-fold enhancement of light extraction from a defectless photonic crystal made on silicon-on-insulator. Appl Phys Lett 2003;83:2542–4.10.1063/1.1614832Search in Google Scholar
[28] Ondič L, Varga M, Hruška K, Fait J, Kapusta P. Enhanced extraction of silicon-vacancy centers light emission using bottom-up engineered polycrystalline diamond photonic crystal slabs. ACS Nano 2017;11:2972–81.10.1021/acsnano.6b08412Search in Google Scholar PubMed
[29] Ondič L, Dohnalová K, Ledinský M, Kromka A, Babchenko O, Rezek B. Effective extraction of photoluminescence from a diamond layer with a photonic crystal. ACS Nano 2011;5:346–50.10.1021/nn1021555Search in Google Scholar PubMed
[30] Ganesh N, Zhang W, Mathias PC, et al. Enhanced fluorescence emission from quantum dots on a photonic crystal surface. Nat Nano 2007;2:515–20.10.1038/nnano.2007.216Search in Google Scholar PubMed
[31] Ganesh N, Block ID, Mathias PC, et al. Leaky-mode assisted fluorescence extraction: application to fluorescence enhancement biosensors. Opt Exp 2008;16:21626–40.10.1364/OE.16.021626Search in Google Scholar
[32] Galář P, Dzurňák B, Varga M, Marton M, Kromka A, Malý P. Influence of non-diamond carbon phase on recombination mechanisms of photoexcited charge carriers in microcrystalline and nanocrystalline diamond studied by time resolved photoluminescence spectroscopy. Opt Mater Exp 2014;4:624–37.10.1364/OME.4.000624Search in Google Scholar
[33] Verhart NR, Lepert G, Billing AL, Hwang J, Hinds EA. Single dipole evanescently coupled to a multimode waveguide. Opt Exp OE 2014;22:19633–40.10.1364/OE.22.019633Search in Google Scholar
[34] Brueck SRJ. Radiation from a dipole embedded in a dielectric slab. IEEE J Selected Topics Quant Electron 2000;6:899–910.10.1109/2944.902140Search in Google Scholar
[35] Oskooi AF, Roundy D, Ibanescu M, Bermel P, Joannopoulos JD, Johnson SG. Meep: a flexible free-software package for electromagnetic simulations by the FDTD method. Comp Phys Commun 2010;18:687–702.10.1016/j.cpc.2009.11.008Search in Google Scholar
[36] Taflove A, Johnson SG, Oskooi A. Advances in FDTD computational electrodynamics: photonics and nanotechnology. Boston, Artech House, 2013.Search in Google Scholar
[37] Ondič L, Babchenko O, Varga M, Kromka A, Čtyroký J, Pelant I. Diamond photonic crystal slab: leaky modes and modified photoluminescence emission of surface-deposited quantum dots. Sci Rep 2012;2:srep00914.10.1038/srep00914Search in Google Scholar
[38] Davies G, Lawson SC, Collins AT, Mainwood A, Sharp SJ. Vacancy-related centers in diamond. Phys Rev B 1992;46:13157–70.10.1103/PhysRevB.46.13157Search in Google Scholar
[39] Iakoubovskii K, Adriaenssens GJ, Dogadkin NN, Shiryaev AA. Optical characterization of some irradiation-induced centers in diamond. Diamond Relate Mater 2001;10:18–26.10.1016/S0925-9635(00)00361-7Search in Google Scholar
[40] Stehlík Š, Ondič L, Varga M, et al. Silicon-vacancy centers in ultra-thin nanocrystalline diamond films. Micromachines 2018;9:281.10.3390/mi9060281Search in Google Scholar PubMed PubMed Central
[41] Petráková V, Taylor A, Kratochvílová I, et al. Luminescence of nanodiamond driven by atomic functionalization: towards novel detection principles. Adv Funct Mater 2012;22:812–19.10.1002/adfm.201101936Search in Google Scholar
[42] Barjon J, Rzepka E, Jomard F, et al. Silicon incorporation in CVD diamond layers. Phys Stat Sol A 2005;202:2177–81.10.1002/pssa.200561920Search in Google Scholar
[43] Potocký Š, Holovský J, Remeš Z, Müller M, Kočka J, Kromka A. Si-related color centers in nanocrystalline diamond thin films. Phys Stat Sol B 2014;251:2603–6.10.1002/pssb.201451177Search in Google Scholar
Supplementary Material
The online version of this article offers supplementary material (https://doi.org/10.1515/nanoph-2019-0042).
©2019 Jan Fait et al., published by De Gruyter, Berlin/Boston
This work is licensed under the Creative Commons Attribution 4.0 Public License.
Articles in the same Issue
- Review Articles
- Semiconductor infrared plasmonics
- Coherent Raman scattering with plasmonic antennas
- Optical trapping in vivo: theory, practice, and applications
- Research Articles
- Maximized vertical photoluminescence from optical material with losses employing resonant excitation and extraction of photonic crystal modes
- Quadratic phase modulation and diffraction-limited microfocusing generated by pairs of subwavelength dielectric scatterers
- Causal homogenization of metamaterials
- Enhanced THz EIT resonance based on the coupled electric field dropping effect within the undulated meta-surface
- High-efficiency Bessel beam array generation by Huygens metasurfaces
- Fast fabrication of silver helical metamaterial with single-exposure femtosecond laser photoreduction
- Semiconductor-enhanced Raman scattering sensors via quasi-three-dimensional Au/Si/Au structures
- Photonic realization of erasure-based nonlocal measurements
- Optical pulling forces on Rayleigh particles using ambient optical nonlinearity