Nonlinear spectroscopy in the near-field: time resolved spectroscopy and subwavelength resolution non-invasive imaging
-
Mahesh Namboodiri


Abstract
The combination of near-field microscopy along with nonlinear optical spectroscopic techniques is presented here. The scanning near-field imaging technique can be integrated with nonlinear spectroscopic techniques to improve spatial and axial resolution of the images. Additionally, ultrafast dynamics can be probed down to nano-scale dimension. The review shows some examples for this combination, which resulted in an exciton map and vibrational contrast images with sub-wavelength resolution. Results of two-color femtosecond time-resolved pump-probe experiments using scanning near-field optical microscopy (SNOM) on thin films of the organic semiconductor 3,4,9,10 Perylenetetracarboxylic dianhydride (PTCDA) are presented. While nonlinear Raman techniques have been used to obtain highly resolved images in combination with near-field microscopy, the use of femtosecond laser pulses in electronic resonance still constitutes a big challenge. Here, we present our first results on coherent anti-Stokes Raman scattering (fs-CARS) with femtosecond laser pulses detected in the near-field using SNOM. We demonstrate that highly spatially resolved images can be obtained from poly(3-hexylthiophene) (P3HT) nano-structures where the fs-CARS process was in resonance with the P3HT absorption and with characteristic P3HT vibrational modes without destruction of the samples. Sub-diffraction limited lateral resolution is achieved. Especially the height resolution clearly surpasses that obtained with standard microCARS. These results will be the basis for future investigations of mode-selective dynamics in the near-field.
Reviewed Publication:
Lewis Aaron
1 Introduction
The spatial resolution of an optical microscope is limited by the diffraction limit (0.61×λ/NA) [1]. SNOM techniques can be combined with microscopy to further improve the spatial resolution [2–5]. The combination of SNOM for recording signals induced by ultrafast laser pulses yields better image resolution and allows for local probing of ultrafast dynamics confined to a nanometer scale. Hess et al. [6] have shown that spatial averaging of spectral information is reduced by local detection using SNOM. The SNOM techniques can be categorized into two subgroups, (i) one using tips with an aperture and (ii) one using apertureless tips. In aperture SNOM, a tip with an aperture diameter smaller than the excitation wavelength(s) is employed to collect the signal or as a point source for excitation in the near-field [7]. The latter is not applicable with femtosecond pulses because of the chirp-induced temporal and intensity-induced spectral broadening effects when a fiber is used. Aperture SNOM has been widely used for high resolution imaging applications that are based on the collection of fluorescence and photoluminescence. Recently, we have demonstrated that a femtosecond pump-probe experiment (transient absorption) in combination with the SNOM technique can be applied for chemical specific imaging along with probing the local dynamics [8]. In the apertureless type, a metallic nano particle attached to the tip is used to enhance the signal produced in the near-field. Tip-enhanced Raman is a well-known technique and applied in imaging; single molecule detection schemes are being developed in this field [9, 10]. Publications presenting examples for a combination of CARS and SNOM techniques are very limited. Schaller et al. [11] combined aperture SNOM techniques to improve the spatial resolution of CARS images. In this experiment, the phase-matching condition, which is already relaxed when using high NA objectives, is not playing a role anymore due to the near-field detection, under which interferences do not occur. Kawata and co-workers [12, 13] employed tips with metallic nanoparticle to enhance the CARS signal and could obtain CARS images with a high spatial resolution. However, these implementations of tip-enhanced CARS in the near-field were restricted to the use of long laser pulses (picoseconds) with excitation far from electronic resonances.
In the following, we would like to review some of our own works, which already have been published elsewhere [8, 14, 15]. Besides this, the review will also give an insight into the state of art in the field of nonlinear optical spectroscopy with sub-diffraction limited spatial resolution. We especially will also point to the problems, which still exist, and to open questions, which still have to be answered.
2 Experimental scheme
The experimental scheme used to realize near-field pump-probe and CARS spectroscopy is briefly outlined here. The 150 fs (775 nm, 1 kHz repetition rate, 1 mJ energy/pulse) pulses from the regeneratively amplified Ti:Sapphire laser (CPA 2010, Clark MXR Inc., Dexter, Michigan, USA) are used to pump two optical parametric amplifiers (TOPAS, Light Conversion Ltd., Vilnius, Lithuania). One of the OPAs serves as source for the pump pulses and the other one yields the Stokes/probe pulses for the pump-probe/CARS experiments. The experimental setup is shown in Figure 1. Pulses are compressed to ≈100 fs using prism pair setups. The timing of the individual pulses was controlled using computer-controlled delay stages in a Michelson interferometer-like setup. Moreover, the pulses were aligned collinearly and coupled into an inverted microscope (Parts from Olympus Corporation, Tokyo, Japan) equipped with a commercial scanning probe microscope (SPM) system (Multiview 2000, Nanonics Imaging Ltd., Jerusalem, Israel). The sample was placed on a piezo-controlled XYZ translator. The pulses were focused onto the sample with an objective lens (PLAN N 10×, NA=0.25, Olympus Corporation, Tokyo, Japan). The far-field probe/CARS signal was collected by a similar objective in the forward direction. The signal was detected by an avalanche photo-diode (STM1DAPD10, Amplification Technologies Inc., Paramus, New Jersey, USA) after filtering out the pump and Stokes frequencies. Noise and background signals were reduced using a boxcar amplifier. The sample was scanned and simultaneously the intensity was recorded at different (x,y) positions. The near-field CARS signal was collected by a SNOM tip attached to a tuning fork (Nanonics design, s. above). The signal was guided through a multi mode fiber to the detector and recorded by the avalanche photo-diode after filtering out the pump and Stokes pulses using a short pass filter. Commercially available (Nanonics, s. above) cantilevered optical fiber SNOM tips coated with thin films of Cr and Au with an aperture diameter of less than approx. 300 nm (down to approx. 50 nm) were used in the experiments. The height of the tip above the sample was kept constant using a phase feed-back mechanism [16]. Thus, the fiber could also be used to obtain AFM topographies from the sample with a spatial resolution limited by the fiber tip diameter. The 128×128 pixels images were recorded with 50–100 ms integration time per pixel.
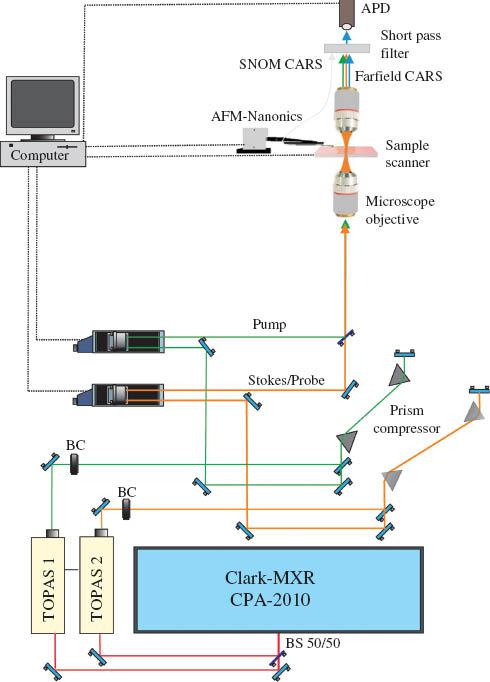
The near-field pump probe and CARS experimental scheme.
The scheme for surface enhanced CARS experiments is shown in Figure 2. The output of one of the OPAs was equally split, giving rise to the pump and the probe pulses of the CARS process. The other OPA was used to generate the Stokes pulses. In order to achieve phase matching necessary for the CARS process, a three-dimensional forward geometry of beams (folded BoxCARS) was chosen. The folded BoxCARS arrangement of the beams spatially separates the signal for background-free detection. The CARS signal was collected both in the phase matched forward direction and non-phase matched 90° sideward direction. The presence of enhanced CARS signal in the sideward direction is ascribed to the relaxation of the CARS phase matching condition due to the optical inhomogeneity of the sample media. This effect is different from the partially coherent anti-Stokes Raman scattering (PCARS) described by Hamaguchi and co-workers [17, 18].
![Figure 2 Detection schemes employed for the SE-CARS experiments. Both the forward directed signal and 90° scattered signal are detected. In the femtosecond experiments only the forward directed (phase matched) signal could be observed [15].](/document/doi/10.1515/nanoph-2013-0044/asset/graphic/nanoph-2013-0044_fig2.jpg)
Detection schemes employed for the SE-CARS experiments. Both the forward directed signal and 90° scattered signal are detected. In the femtosecond experiments only the forward directed (phase matched) signal could be observed [15].
3 Pump-probe scanning near-field microscopy (PP-SNOM)
The SNOM technique has been combined with time-resolved spectroscopy using a pump-probe setup to study the ultrafast dynamics in quantum wells, wires, and dots of inorganic semiconductors [19–22]. Feldstein et al. [23], employed an attenuated total reflection setup to probe the surface plasmon polariton of a silver film. Kubo et al. [24] used two-photon emission to map the surface plasmon dynamics from a nano-structured silver grating after excitation with 10 fs phase-correlated pump-probe pulses. We have used a collinear pump-probe technique to study the exciton dynamics in 160 nm thin films of 3,4,9,10 Perylenetetracarboxylic dianhydride (PTCDA) composed of nano-crystals on glass prepared by molecular beam evaporation in ultra-high vacuum.
The absorption spectrum (Figure 3) of the film shows a broad band peaked around a wavelength of 490 nm, which is due to the excitation of the molecules to their first singlet (S1) excitonic state. In our experiments, a pump pulse with center wavelength at 520 nm was used for the excitation and the transient absorption from the S1 state was measured with a probe pulse centered at 650 nm.
![Figure 3 Absorption spectra of a 160 nm thin film of PTCDA on glass [8].](/document/doi/10.1515/nanoph-2013-0044/asset/graphic/nanoph-2013-0044_fig3.jpg)
Absorption spectra of a 160 nm thin film of PTCDA on glass [8].
Figure 4A shows the transient absorbance for different pump intensities recorded using the SNOM tip. The time profiles of the absorbance map the population of the excitons in the S1 state, both the free (F) excitons and the self trapped (ST) excitons. The transients are found to be different for different pump intensities. At low energies of approx. 20 pJ per pulse the decay in absorbance is mono-exponential while at higher energies the decay has more components. This can be seen from the transients obtained for 120 and 350 pJ per pulse shown in Figure 4A. The average exciton densities at these pulse energies are 8.12×10¹⁸, 3.828×10¹⁹, and 9.86×1019 cm–3 for 20, 120, and 350 pJ pulses, respectively. The intensity-dependent decay profiles can be modeled taking into account the following three processes: (i) exciton-exciton annihilation, (ii) relaxation of the F excitons to the ST excitons, and (iii) relaxation of the ST excitons to the ground state. The decay profiles show that exciton annihilation is discernible only for densities higher than 1×1019 cm–3. A similar model has been used to describe exciton dynamics in β-perylene crystals [25]. The detailed description of the fitting of the transient is given in ref. [8]. The near-field experiments yield an annihilation rate γ=2.2±0.1×10⁻⁸ cm3 s–1. Similar measurements done in the far field give γ=2.95×10⁻⁸ cm3 s–1, which is larger than the value obtained by using the SNOM technique. The difference in the annihilation rates obtained from the measurements in the near-field and the far-field highlight the importance of the SNOM technique in obtaining accurate information about the exciton dynamics. As shown in Figure 4B, the profiles of the transient absorbance recorded using the SNOM at different positions within the focus area are different, which is because the intensity of the pulse over the focus is not uniform, but is best described by a Gaussian distribution function; the intensity profile over the focus scanned by the SNOM is shown in the inset. The exciton densities, which are proportional to the intensity of the beam at the different positions in the focus area, are different. As a result, the transient absorbance recorded in the far-field is averaged over different decay profiles. As seen in our measurements, using the average exciton density to calculate the annihilation constant from the absorbance profile overestimates the annihilation constant.
![Figure 4 Time profile of transient absorbtion of the probe laser at 650 nm in a PTCDA thin film sample, at different pump (520 nm) intensities at the maximum of the focal spot (A), and at different points in the focal spot area (B) [8].](/document/doi/10.1515/nanoph-2013-0044/asset/graphic/nanoph-2013-0044_fig4.jpg)
Time profile of transient absorbtion of the probe laser at 650 nm in a PTCDA thin film sample, at different pump (520 nm) intensities at the maximum of the focal spot (A), and at different points in the focal spot area (B) [8].
We also used the PP-SNOM technique to image thin films. Compared to AFM imaging, which gives topographical information only, PP-SNOM also gives chemical information of the specimen investigated. In case of PTCDA thin films, PP-SNOM can be used to map the population of excitons, which is not possible with either AFM or conventional SNOM. Figures 5A and B show the PP-SNOM and AFM topography image, respectively, taken using the SNOM tip during the scanning of the edge of the 160 nm film of PTCDA on glass. In the PP-SNOM image, the intensity of the probe beam, delayed by 200 fs after the pump, is recorded to image the F excitons in the film. The left part in the PP-SNOM image, where the intensity of the probe beam is high, shows the glass surface and the right part, where the intensity of the probe beam is low due to the absorption by the F excitons, shows the organic semiconductor film. The glass surface and the PTCDA film are also distinguishable in the AFM image, however the resolution of the AFM image is worse than that of the PP-SNOM image. The better resolution in the PP-SNOM image is due to two reasons: the aperture that collects the evanescent field in the SNOM tip is smaller than the tip itself and the PP-SNOM image is less affected by the drifts in the voltage feedback used to actuate the piezo scanner during the scanning process, which reduce the resolution of the AFM.
![Figure 5 SNOM image of a 160 nm film of PTCDA, displaying transient absorption of the probe pulse at 650 nm, 200 fs after the pump excitation at 520 nm (A), and AFM topography (B) [8].](/document/doi/10.1515/nanoph-2013-0044/asset/graphic/nanoph-2013-0044_fig5.jpg)
SNOM image of a 160 nm film of PTCDA, displaying transient absorption of the probe pulse at 650 nm, 200 fs after the pump excitation at 520 nm (A), and AFM topography (B) [8].
We have also investigated the performance of the PP-SNOM vs. conventional SNOM. Figures 6A and B show the images of the film using the PP-SNOM and the change in the absorption of the probe beam alone (conventional SNOM), respectively. The images were taken using single shots of the probe pulse per pixel. The glass on the left and the PTCDA film on the right side of the image are clearly visible in the PP-SNOM while, apart from the edge effects from surface inhomogeneities [7], such distinction is not clear in the conventional SNOM image. It is interesting to note that images are taken with a single laser shot per point and that the energies required to take the images are very low – 500 pJ for the pump and 10 pJ for the probe in our example. Such pulse energies are readily available from a high repetition rate oscillator (100 MHz and higher), which could be used to take a 512×512 pixel image in only 3 ms provided the scanners can be actuated at high frequencies. Video-rate imaging would be possible with such a system. The use of high repetition laser systems has another advantage. The energy per pulse used for transient absorbance measurements can be reduced further, which would allow for the investigation of more sensitive samples like, e.g., plant cells or other biological materials.
![Figure 6 SNOM images of a 160 nm film of PTCDA displaying absorption of the probe pulse at 650 nm, 200 fs after the pump excitation at 520 nm (A), and without pump excitation (B). The images were taken without accumulation of laser pulses (single shot data points) [8].](/document/doi/10.1515/nanoph-2013-0044/asset/graphic/nanoph-2013-0044_fig6.jpg)
SNOM images of a 160 nm film of PTCDA displaying absorption of the probe pulse at 650 nm, 200 fs after the pump excitation at 520 nm (A), and without pump excitation (B). The images were taken without accumulation of laser pulses (single shot data points) [8].
4 Scanning near-field CARS (SNOM-CARS)
CARS microscopy has emerged as a well-known nonlinear microscopy technique for imaging chemical and biological samples. The non-invasive, chemical specificity inherent to the contrast originating from vibrations of the nuclei and high signal strength due to the coherent nonlinear interaction make this technique special compared to other existing microscope techniques. Duncan et al. [26] first constructed a CARS microscope by employing a non-collinear geometry. The molecular specificity inherent to this technique was demonstrated by differentiating in a CARS image a two immiscible liquid mixture (octane and acetonitrile) contained in an optical cell. The images were recorded by scanning the interface between the two liquids. In the CARS process, the frequency difference between the pump pulse (ωp) and Stokes pulse (ωs) is tuned to be in resonance with a vibrational (Raman) mode of the molecule (ωp–ωs=ΩR). The coherent excitation of the vibrations makes the third probe pulse (ωpr) to scatter at the anti-Stokes frequency (ωaS) such that, ωaS=ωp–ωS+ωpr, following the conservation of energy. In a degenerate pump-probe CARS experiment, the pump itself acts as the probe (ωp=ωpr), giving the CARS signal at ωaS=2ωp–ωS. Zumbusch et al. [27] improved the CARS microscope by employing collinear geometry and tight focusing of the laser beams using high NA objectives. This has improved the spatial resolution compared to the non-collinear configuration by (Duncan et al. [26]). The tight focusing helps to reduce the effect of the phase mismatch on the signal intensity. The main problem affecting the contrast of the CARS images is the unwanted non-resonant background signal from, e.g., solvent molecules or the non-vibrational contributions from the analyte itself. A lot of developments have been made in terms of improving image contrast (suppressing the non-resonant background) and faster imaging [28]. The modern CARS microscope can record images in vivo at video rate speed [29]. A possible way to minimize the non-resonant background is the use of a time delay between the laser pulses in a femtosecond CARS experiment due to the short life time of the non-resonant contributions [30].
In order to allow for high temporal resolution, femtosecond laser pulses have to be used. When electronic state specificity is required (as in most time-resolved experiments), resonance with an absorption or transient absorption transition is mandatory. Both ultrashort pulses and excitation resonant with molecular absorptions is making CARS microscopy and even more near-field CARS microscopy a very demanding task, since samples can be easily destroyed. Here, we demonstrate that fs-CARS with both electronic and vibrational resonance is capable of yielding highly resolved images of P3HT in different environments [14]. It has to be pointed out, that the goal of our work was not to improve existing CARS imaging techniques, but rather to make an important step towards a time-resolved application in the near-field. Better spatial resolution could be obtained under tight-focusing conditions using lasers in the near infrared spectral region and with picosecond duration along with reduced damage of the sample. However, this would not meet our requirements.
The AFM topography of the P3HT thin film (the details of the sample preparation is given in ref. [14]) was calculated using WSXM software developed by Horcas et al. [31]; it is shown in Figure 7C. In order to guarantee that the AFM topography matches the SNOM image as precisely as possible, the images were recorded using a SNOM tip having an aperture of ≈200–300 nm and a metal coating of 0.2 μm thickness. Therefore, the lateral resolution of the AFM images is poorer than that expected from measurements with normal AFM tips. The resolution is also less than that of the SNOM-CARS images where only the aperture diameter is relevant, resulting in an (x, y) precision of slightly less than 300 nm (taken from the full width at half maximum of the smallest resolved features in the cross sections taken from the image data). As already mentioned above, the spin coating and annealing process does not offer a uniform homogeneous morphology of the thin film surface. The height of the “hump” on the right side (in the x direction at ≈1.5–3 μm) is ≈145 nm. The CARS images were recorded with the difference between pump and Stokes laser wavenumbers set to approx. 1440 cm–1; this is in resonance mainly with the C=C ring stretching mode of P3HT [32, 33]. Considering the broad bandwidth of the pulses (≈100 cm–1) also some neighboring, less intense modes will be excited simultaneously. The pump laser wavelength was set to 650 nm and the Stokes laser was tuned to 717 nm. Thus, the pump laser was resonant with the ground state absorption of the P3HT thin film [34]. The electronically resonant CARS process helps to reduce the non-resonant background in the CARS images, which can be further improved by introducing a time delay between the exciting laser pulse in the order of the pulse length. As is obvious from our CARS images, the non-resonant background signal from the P3HT environment is having a negligible intensity compared to the P3HT signal. Tuning the pump–Stokes wavenumber difference away from the resonance with intense Raman modes clearly reduced the signal just leaving the non-resonant background of the analyte, which is of the same magnitude than the substrate background signal. This demonstrates that next to the chemical specificity due to the electronic resonance also a mode-specific CARS signal was detected in our experiments. The major limiting factor of the aperture SNOM technique is the low signal throughput with reduced aperture sizes. A lot of effort was put into optimizing the SNOM-CARS setup. Finally, the signal strength was high enough to be detected by our filter-detector assembly attached to the SNOM fiber probes without destruction of the sample. A total laser pulse energy of only ≈0.75 nJ was focused onto the sample (each pulse ≈0.25 nJ). The destruction of the sample was one of the major reasons why we could not use objectives with high numerical apertures. The damage induced by using a 2 nJ energy pulse and the resulting decrease in CARS signal intensity is shown in Figure 8. The polydiacetylene (PDA) shown here is an interesting organic semiconductor material, which we have also studied using the SNOM technique. As was just pointed out, unfortunately, a general problem in fs-CARS microscopy is the easy damage of samples. The use of near-infrared light sources would help to reduce the risk of damage, but for time-resolved studies a resonant excitation is mandatory. While, P3HT has a rather good damage threshold, PDAs are very sensitive, which is demonstrated in Figure 8. Interestingly, even when adjusting the laser pulse energies such that no damage is observed in far-field CARS microscopy, when approaching the SNOM tip, in many cases nevertheless damages occur. This is due to a local field enhancement by the metal-coated fiber tips.
![Figure 7 MicroCARS image (A), SNOM-CARS image (B), AFM topography (C) and CARS intensity profile (D), along a section parallel to the x direction of the images (3×3 μm2 area) are displayed. The color code has been adapted to the full intensity range of the image. The P3HT structure seen on the right side of the AFM image has a thickness of ≈145 nm [14].](/document/doi/10.1515/nanoph-2013-0044/asset/graphic/nanoph-2013-0044_fig8.jpg)
MicroCARS image (A), SNOM-CARS image (B), AFM topography (C) and CARS intensity profile (D), along a section parallel to the x direction of the images (3×3 μm2 area) are displayed. The color code has been adapted to the full intensity range of the image. The P3HT structure seen on the right side of the AFM image has a thickness of ≈145 nm [14].
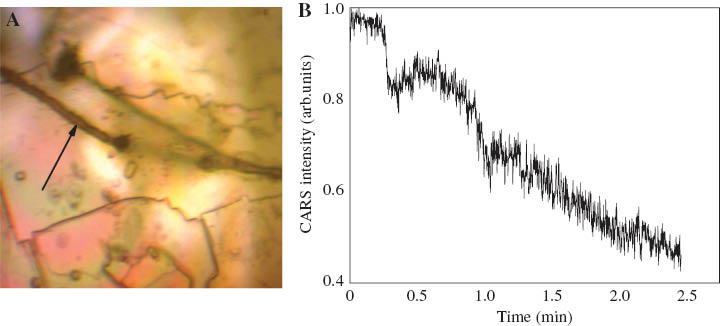
(A) Microscope image showing the micro channels burnt on to polydiacetylenecrystal surface (B) CARS signal intensity over time.
Additionally, the use of the 10× objective also helped to excite the sample layer more homogeneously over its full thickness. The sample was stable during the course of the measurement, but only relatively small pulse energies already chemically changed the P3HT sample as was also observed by others [35]. We have observed that when the focusing of the femtosecond pulses by the microscope objective alone (“microCARS”) is close below the destruction level, the approach of the SNOM fiber tip is resulting in highly localized damages to the sample. This is due to the tip-enhancement effect [12, 13], which also occurs with our SNOM probes due to their metal coating. In the present case SNOM-CARS resulted in an instantaneous damage of the P3HT samples at energies >1 nJ. The far-field and the near-field CARS images obtained from the same surface area displayed in Figure 7C are shown in panels (A) and (B) of the same figure, respectively.
Please note that the intensities were normalized, but the color code used was chosen to cover the full intensity range seen in the respective images. The SNOM-CARS images are correlated well with the AFM topography. The lateral resolution is very high in the SNOM-CARS images and is – as was already pointed out above – even better than that of the corresponding AFM image where the influence of the metal film coating has to be taken into account. The focal spot diameter (full width at half maximum, FWHM) of the laser pulses was determined to be ≈2 μm. The microCARS image (far field) of the same area is poorly resolved, which is also due to the use of an objective with relatively small numerical aperture (NA). In panel (D) of Figure 7, the intensity profile along a horizontal section (shown in the CARS images) is shown. The variation in intensity with the thickness is well resolved in the near-field profile. As mentioned above, an interesting finding is that a local enhancement of the laser and CARS signal fields due to the thin coating of the gold film occurs. Unfortunately, it is rather difficult to quantify this in our experiment. The pump pulse frequency is close to the plasmon absorption of the gold nano structures [3]. Cheng et al. [36] have performed FDTD simulations of the near-field effects on CARS imaging and have shown that, the near-field enhancement varies with different parameters such as refractive index, edge effect and surface roughness, etc. The evanescent field is confined to the vicinity of the particles (or here coating of the tapered fiber). This helps to improve the sensitivity and resolution of near-field CARS images.
The variation in intensities near the edge of the nano-structure is due to the thickness variation. The thicker the P3HT structure, the more oscillators are included in the probe volume giving rise to the CARS signal. In order to compare the variation of CARS intensity with respect to thickness, we found a region in another sample where the height of the P3HT structure is ≈1.5 μm.
Figure 9, shows the near-field image (B) and the corresponding AFM topography (C) of this structure. The area away from the thick region corresponds to glass (SiO2), which neither contributes to the resonant CARS nor gives rise to a big non-resonant background signal, which also demonstrates our chemical selectivity and good suppression of nonresonant background signals. It can be seen that both far-field (A) and the near-field images (B) correlate with the AFM topography, with the SNOM-CARS image having a better lateral resolution [panel (D) gives the respective sections]. As the structure is rather thick, relative intensity changes are seen in both far-field and near-field images. When the thickness is down to a nanometer scale like in the first sample discussed above (compare Figure 7), the far-field signal intensity is almost flat and SNOM-CARS can differentiate the topographic feature much better than microCARS. Since the SNOM probe only collects light in the near-field, the SNOM-CARS does not only provide a very good lateral resolution, but clearly surpasses microCARS (also when high NA objectives are used where the lateral resolution becomes rather good) in its axial resolution. Using the axial resolution formula 1.5×λ×n/NA2 [37], the maximum resolution is 742 nm for a wavelength of λ=650 nm and a refractive index of n=1.6 [38] for high NA (1.4) objectives (even much more for the objective with NA=0.25 used in our work). Here, the SNOM CARS data result in a considerably better value.
![Figure 9 MicroCARS image (A), SNOM-CARS image (B), AFM topography (C) and CARS intensity profile (D), along a section parallel to the x direction of the images (20×20 μm2 area) are displayed. The color code has been adapted to the full intensity range of the image. The P3HT roughness feature on the right side of the AFM image has a thickness of ≈1.5 μm [14].](/document/doi/10.1515/nanoph-2013-0044/asset/graphic/nanoph-2013-0044_fig9.jpg)
MicroCARS image (A), SNOM-CARS image (B), AFM topography (C) and CARS intensity profile (D), along a section parallel to the x direction of the images (20×20 μm2 area) are displayed. The color code has been adapted to the full intensity range of the image. The P3HT roughness feature on the right side of the AFM image has a thickness of ≈1.5 μm [14].
The cross correlation between the pump and Stokes pulses are shown in Figure 10. The full width at half maximum (≈150 fs) is equal for the near-field and the far-field experiments, showing that the temporal resolution (instrument response function) is not influenced by the SNOM tip. This is not self-evident and has to do with the fact that the pulses used in our experiments are not showing a considerable spatial chirp, which otherwise would result in different contributions at each point of the focal area.
![Figure 10 In order to estimate the temporal resolution of the CARS interaction, the cross correlation between the femtosecond pump and Stokes pulses has been measured using the microCARS and the SNOM-CARS setup. The full width at half maximum (≈150 fs) of the near-field and the far-field cross correlation traces reflects the respective instrument response functions, which are equal for microCARS and SNOM-CARS [14].](/document/doi/10.1515/nanoph-2013-0044/asset/graphic/nanoph-2013-0044_fig10.jpg)
In order to estimate the temporal resolution of the CARS interaction, the cross correlation between the femtosecond pump and Stokes pulses has been measured using the microCARS and the SNOM-CARS setup. The full width at half maximum (≈150 fs) of the near-field and the far-field cross correlation traces reflects the respective instrument response functions, which are equal for microCARS and SNOM-CARS [14].
5 Surface enhanced CARS (SE-CARS)
The experiments discussed above make use of the SNOM technique. The minimum resolution we were able to achieve there was approximately 50 nm. A sharp metal tip would allow for apertureless near-field microscopy with an even higher resolution. This has been already demonstrated in combination with linear Raman spectroscopy. Tip-enhanced Raman scattering (TERS) allows for resolutions down to few nanometers [9, 10]. Unfortunately, the interaction between the nanometer sized metal tips and femtosecond laser pulses is not well understood up to now and the combination with nonlinear spectroscopic techniques like CARS also needs additional research work. In order to prepare femtosecond time-resolved experiments with even higher spatial resolution based on the tip enhancement effect, we have performed a number of experiments. In the following, we will present some first results on the investigation of the surface enhancement of CARS with femtosecond laser pulses.
Surface enhanced Raman Scattering (SERS) has become one of the most widely used techniques since its first observation by Fleischmann et al. in 1974 from the molecule pyridine adsorbed on to roughened silver electrodes. Thereafter, the effect has been demonstrated with a variety of molecules and with a number of metals [39]. Most commonly used metals are coin metals, such as silver, gold, copper, etc. Metal surfaces containing several coupled microscopic domains are seen to give the highest enhancement for the Raman spectra. Such surfaces are termed as SERS-active systems. Besides the metal surfaces, metal colloids consisting of isolated metal particles of nanometer size in aqueous media are also identified to be good candidates for enhancing the Raman spectra of adsorbed molecules. However, the most intense SERS effect is observed from aggregated metal colloids consisting of large groups of aggregated metal nanoparticles. Even though the use of SERS effect is widespread, the mechanism behind the effect is still not clearly understood. There are two theories describing the enhancement effect. One is the electromagnetic theory (EM theory) of enhancement and the other is the chemical enhancement theory [40]. It is assumed that the enhancement factor due to the chemical effect is less than that due to the EM effect. This difference in the enhancement factors due to EM effect and chemical effect is still a matter of debate.
Nonlinear optical processes are also seen to be enhanced when using rough surfaces [12, 41, 42]. Since the induced nonlinear polarization depends on higher powers of the electric field, huge enhancement of nonlinear optical effects can also be expected. This is because nonlinear optical effects involve the interaction of multiple laser fields with the matter and if any of the incident fields are within the plasmon resonance, the enhancement of the fields results in a huge enhancement of the nonlinear optical effect. This principle can be applied to CARS. Chew et al. theoretically predicted the possibility of SE-CARS from molecules located near colloidal spheres [43]. The calculated results for benzene based on the electromagnetic theory of enhancement gave maximum enhancement factors of about 1010. In their calculation, the enhancement factor was shown to depend critically on the excitation profile and fall off sharply with increase in the distance between the metal particle and molecule.
Surface enhancement of CARS was observed experimentally by Liang et al. using a nanosecond laser [44]. In their experiment, samples used were organic solvents, such as benzene and toluene adsorbed onto colloidal silver particles prepared in N,N-dimethylformamide. The CARS signal scattered at right angles to the input lasers were detected and it showed enhancement of up to two orders of magnitude. Scanning the pump angular frequency (ωp) over the absorption spectrum of the mixture of silver colloid with sample showed that the enhancement of CARS signal occurs for a very narrow range of wavelengths (≈6 nm) around the absorption peak of the mixture. The CARS signal detected in the forward direction was weaker, which was explained to be due to the scattering of the signal by the silver particles. The work described here is an extension of this experiment using femtosecond pulses and is aimed at understanding the mechanism of enhancement of the CARS signal from molecules adsorbed onto colloidal nanoparticles of coin metals, such as silver and gold [15]. Recently, there has been a number of reports on SE-CARS. Voronine et al. [45] combined pulse shaping to enhance the CARS signal from pyridine-colloid mixture by introducing a sinc shaped probing process and reported an enhancement factor of 107. Christian et al. [46] performed SE-CARS on benzenethiol molecules adsorbed onto nano-structured gold surfaces; they observed an enhancement factor of 109. Renee et al. [47] used gold nano-antennas to enhance the femtosecond stimulated Raman signal (SE-FSRS), where they could observe an enhancement of 104.
In our studies, the largest enhancement factor observed for femtosecond SE-CARS was 10 when using a pump wavelength of 550 nm. No enhancement of the CARS spectra was observed for the other wavelengths used. Also, no enhancement effect was observed in the 90° detection scheme in contrast to the earlier observations made when using nanosecond laser pulses [44]. The observed enhancement of CARS spectra from pyridine is seen to have a sensitive dependence on a variety of parameters. In the nanosecond experiments a strong dependence of the signal intensity on the excitation wavelength had been observed. The excitation profile of SE-CARS was found to be much narrower than the observed absorption of the metal sol (colloidal suspension of metal nano clusters). Additionally, the peak of the excitation profile was red-shifted to the absorption maximum. Therefore, firstly, we have investigated the dependence on the excitation wavelength. In the experiments performed by varying the pump laser wavelength from 490 to 550 nm, no enhancement effect was observed except when the pump laser was tuned to approx. 550 nm. The observation of this extremely narrow enhancement profile is in accordance with the earlier findings. The wavelength of the Stokes laser in this case was set to 580 nm corresponding to the strongest Raman modes of pyridine, resulting in a wavelength of the CARS signal centered around 522 nm. These wavelengths are on the red side of the resonance frequency of the surface plasmons observed as maximum in the absorption spectrum at approx. 420 nm. In the nanosecond SE-CARS experiment this separation was not so obvious. The conclusion there was that only very specific aggregates of silver or gold with the adsorbed molecules contributed to the enhancement effect. Since in those experiments only the sidewards scattered signal (not phase matched) was considered, the mechanism of the process was still not absolutely clear. The main question, which remained for the nanosecond results, was, whether the signal detected under 90° resulted from non-phase matched SE-CARS or just from the regular CARS signal scattered by the metal particles. In the experiments presented here, the phase-matched forward CARS signal was investigated. Without surface enhancement, a decrease of forward CARS signal intensity can be expected due to diffuse scattering processes to all sides. Thus, the observed increase of forward CARS signal intensity definitely is due to the SE effect. The fact that the enhancement is found only for a very narrow wavelength range of the exciting lasers supports the assumption that only a minority of the metal aggregates within the distribution of different sizes and shapes gives rise to the enhancement. Since the observation of the SE-CARS strongly depends also on the correct phase matching arrangement of the three lasers pulses (folded BoxCARS geomentry), we believe that the macroscopic phase relation between the enhanced fields plays an important role. This is in accordance to the observations reported by Liang et al. The sidewards scattered signal, which itself was off the phase matched direction, only could be produced by using pump, Stokes, and probe lasers in an geometric arrangement predicted by the momentum conservation condition.
The obvious enhancement of the CARS signal should depend on the concentration of the silver sol. This could be verified experimentally. Here, a critical dependence on the concentration of the silver colloids was observed. Figure 11 shows the enhancement obtained for different concentrations of the silver colloid added to pyridine. For a low concentration of silver colloid (e.g., 5%) a small enhancement results. The effect is maximum for a concentration of colloid of approx. 10%. Further addition of colloids resulted in a decrease of the enhancement factor. Starting from a very small concentration of silver sol, the increase of the enhancement with addition of silver sol is according to the expectations. The decrease in the enhancement factor for higher colloid concentration can be explained by the increase of scattering of both the lasers and the CARS signal by the large number of colloidal silver particles away from the phase matched forward direction of the CARS process. As was already mentioned in the discussion above, our experiments investigating the wavelengths dependence strongly point to the fact that only specific metal aggregates contribute to the SE-CARS effect. Two further experimental findings support this assumption.
![Figure 11 Surface enhanced CARS spectra obtained from pyridine. The CARS spectra from pyridine alone is shown in black. The other colored curves are for different concentrations of silver colloids [15].](/document/doi/10.1515/nanoph-2013-0044/asset/graphic/nanoph-2013-0044_fig11.jpg)
Surface enhanced CARS spectra obtained from pyridine. The CARS spectra from pyridine alone is shown in black. The other colored curves are for different concentrations of silver colloids [15].
The properties of the silver sol (cluster size, shape) can be influenced by the preparation. Also in SERS, the effect of surface enhancement is seen to have very sensitive dependence on the method of synthesis. The principle preparation technique (detailed in ref. 15), temperature and light conditions, speed of addition of reagents for the preparation of colloids etc. affect the SERS activity of the colloids. Unfortunately, even colloids prepared using the same method and parameters not always yield the same efficiency of enhancement. In our experiments a correlation between SERS activity and SE-CARS efficiency could be observed. Therefore, for each silver sol used, firstly Raman spectra were taken, in order to check the quality of the silver sol. It is obvious that not all sols, i.e., cluster sizes and shapes, result in the enhancement of CARS similar to the observations made for SERS. However, at the moment we do not know to what extent the SERS and CARS enhancement capabilities of a certain sol are correlated.
Another indication of the strong dependence of the SE-CARS effect on the cluster properties can be found when the dependence on the laser intensity is investigated. The stability of the colloids was seen to be affected by the intensity of the laser pulses. In general, large fluctuations are observed in the CARS signal due to the random motion of the colloidal particles within the laser focus. Therefore, it was required to accumulate the signal over a long time to average out the fluctuation effects. However, exposing the silver colloid to the intense femtosecond laser pulses affected the stability of the colloid, which could be seen from a steady decrease of the signal with time. Increasing the laser intensity was increasing both signal intensity and fluctuation (noise) and at the same time resulted in a steeper decrease of the signal life time. These two counter acting effects pose a major difficulty in the reliable performance of the experiment. The destruction of the cluster sizes and shapes needed for the SE-CARS process mechanically or due to laser ablation result in a signal decrease. This is also reported in the SE-FSRS experiments by Renee et al. [47]
Our observations made with SNOM tips as well as with AFM tips, which have nanometer-sized gold spheres attached, confirmed that SE-CARS can be used also for near-field microscopy. A better understanding of the SE effect is however needed. Especially, the so-called chemical enhancement effect has to be investigated in more detail, since the direct coupling of the metal electrons to the electronic system of the probed molecules will influence the energetic as well as dynamic properties.
6 Conclusions and outlook
In summary, the two color pump-probe measurements done using the SNOM technique show intensity-dependent exciton dynamics at exciton densities higher than 1019 cm–3, which can be attributed to exciton-exciton annihilation. From the time profiles of the transient absorbance we were able to calculate the annihilation rate of the excitons. Comparison of the results with the measurements done in the far-field revealed that the annihilation constant obtained from those measurements is overestimated. Our measurements also show that the pump-probe SNOM gives better image contrast than the conventional SNOM and a single laser shot per pixel is good enough for imaging. We note that SNOM with high repetition rate laser systems can significantly speed up the imaging and also enable pump-probe measurements with very low, few femto joule, pulse energies.
SNOM CARS imaging was performed in P3HT thin films. The major challenge during the course of near-field CARS and pump-probe experiments was the avoidance of photodamage of the sample due to the tight focusing of the femtosecond laser pulses. The major problem is the high peak power of the femtosecond pulses and the low repetition rate of the laser system. The low repetition rate reduces the speed of imaging and in combination with the low laser pulse energies a reduced number of signal photons results in unfavorable photon statistics. The signal detection in pump-probe experiment is less problematic since the laser itself is detected. However, the CARS signal power obtained at laser pulse energies <1 nJ is of the order of few picowatt, which is close to the detection limit of the avalanche photodiodes used in the experimental setup. The images obtained clearly show an improved axial resolution in SNOM CARS images. Like the PP-SNOM also the SNOM CARS setup could be improved using a high repetition rate laser source. Time-resolved CARS in collinear geometry is very challenging as the noise background is rather high compared to the weak resonant CARS signal at larger probe delays. The combination of a pump pulse followed by a CARS process as a probe could be implemented for observing the vibrational energy flow in both excited and ground state of the molecules. For CARS imaging the use of femto second pulses is not the ideal choice because of the reduced spectral resolution and increased non-resonant background due the broad spectrum of the pulses, but it is required for gaining dynamical information, which is the goal of our work. For pure imaging purposes, Raman modes would be more efficiently excited using 3–5 picosecond pulses, which have spectral widths of the order of few ≈10 cm–1, which is more comparable to the width of Raman lines.
Surface enhancement plays a role even when SNOM experiments are performed. This is due to the metal coating of the tips. Therefore, a better understanding of processes like surface enhanced CARS (SE CARS) is needed. The results of the experiments on the SE effect of CARS demonstrate that the CARS signal can be enhanced in the presence of colloidal metal particles. However, the enhancement factor observed is much less than that observed for the conventional Raman scattering. Besides that, the effect is seen to be sensitively dependent on the method of preparation of the colloids, concentration of the colloids, the wavelengths of the laser pulses involved, and the laser intensity. The enhancement effect was observed only when the folded-BoxCARS arrangement of beams was used. The results from the studies of surface enhanced CARS shows that a better knowledge of the physical and chemical properties of the metal substrates is needed to characterize their ability to give enhancement. In order to overcome the problems due to the random motion of colloidal particles within the laser focus, alternative techniques such as tip enhancement or use of rough metal surfaces can be used. Sensitive detection techniques can be used in order to reduce the laser intensity, which affects the stability of the metal structures.
Acknowledgements
Financial support from NanoFun-Center, Jacobs University Bremen and DFG (MA-17 Femto-opt.Nahfeld) is gratefully acknowledged. Authors thank Gesa Helms and Prof. Jürgen Fritz for the high resolution AFM images of the thin films and Prof. Veit Wagner for the help in preparing the thin films.
References
[1] Betzig E, Trautman JK. Near-field optics: microscopy, spectroscopy, and surface modification beyond the diffraction limit. Science 1992;257:195.10.1126/science.257.5067.189Search in Google Scholar
[2] Lucas M, Riedo E. Invited review article: combining scanning probe microscopy with optical spectroscopy for applications in biology and materials science. Rev. Sci. Instrum. 2012;83:06110135.Search in Google Scholar
[3] Novotny L, Stranick JS. Near-field optical microscopy and spectroscopy with pointed probes. Annu Rev Phys Chem 2006;57:331.10.1146/annurev.physchem.56.092503.141236Search in Google Scholar
[4] Pohl DW, Denk W, Lanz M. Optical stethoscopy: image recording with resolution λ/20. Appl Phys Lett 1984;44:651.10.1063/1.94865Search in Google Scholar
[5] Lewis A, Issacson M, Harootunian A, Murray A. Development of a 500 Å spatial resolution light microscope: I. Light is efficiently transmitted through λ/16 diameter apertures. Ultramicroscopy 1984;13:227–31.10.1016/0304-3991(84)90201-8Search in Google Scholar
[6] Harris E, Pfeiffer TD, Hess LN, Betzig HF, West KW. Near-field spectroscopy of the quantum constituents of a luminescent system. Science 1994;264:1745.Search in Google Scholar
[7] Hecht B, Sick B, Wild UP, Deckert V, Zenobi R, Martin OJF, Pohl DW. Scanning near-field optical microscopy with aperture probes: fundamentals and applications. J Chem Phys 2000;112:7761.10.1063/1.481382Search in Google Scholar
[8] Khan M, Karki TZ, Namboodiri K, Materny A. Femtosecond pump-probe scanning near-field optical microscopy (PP-SNOM): sub-wavelength resolution chemical imaging and local dynamics. Appl Phys Lett 2012;100:1531033.Search in Google Scholar
[9] Deckert V. Tip-enhanced Raman spectroscopy. J Raman Spectrosc 2009;40:1336–7.10.1002/jrs.2452Search in Google Scholar
[10] Dunn RC. Near-field scanning optical microscopy. Chem Rev 1999;99:2927.10.1021/cr980130eSearch in Google Scholar
[11] Lee J, Haber LF, Schaller LH, Ziegelbauer RD, Sayakally RJ. Chemically selective imaging of subcellular structure in human hepatocytes with coherent anti-stokes Raman scattering (CARS) near-field scanning optical microscopy (NSOM). J Phys Chem B 2002;106:8492.Search in Google Scholar
[12] Hashimoto N, Inouye M, Ichimura Y, Hayazawa T, Kawata S. Subnanometric near-field Raman investigation in the vicinity of a metallic nanostructure. Phys Rev Lett 2004;92:2208014.Search in Google Scholar
[13] Catalan N, Okamoto FC, Furusawa T, Hayazawa K, Kawata S. Tip-enhanced broadband CARS spectroscopy and imaging using a photonic crystal fiber based broadband light source. J Raman Spectrosc 2012;43:661.Search in Google Scholar
[14] Namboodiri M, Khan TZ, Bom S, Flachenecker G, Materny A. Scanning near-field optical coherent anti-Stokes Raman microscopy (SNOM-CARS) with femtosecond laser pulses in vibrational and electronic resonance. Opt Express 2013;21:918–26.10.1364/OE.21.000918Search in Google Scholar
[15] Namboodiri V, Namboodiri M, Cava Diaz GI, Oppermann M, Flachenecker G, Materny A. Surface-enhanced femtosecond CARS spectroscopy (SE-CARS) on pyridine. Vib Spec 2011; 56:9–12.10.1016/j.vibspec.2010.08.005Search in Google Scholar
[16] Inouye H, Pohl Y, Hecht DW, Bielefeldt B, Novotny L. Facts and artifacts in near-field optical microscopy. J Appl Phys 1997;81:2498.Search in Google Scholar
[17] Ishibashi T, Hamaguchi H. Partially coherent anti-Stokes Raman scattering (PCARS). Chem Phys Lett 1990;175:543–7.10.1016/0009-2614(90)85578-ZSearch in Google Scholar
[18] Ishibashi T, Hamaguchi H. Partially coherent anti-Stokes Raman scattering (PCARS): a comparative band-shape analysis of the spontaneous Raman and PCARS spectra of toluene. J Chem Phys 1995;103:1.10.1063/1.469631Search in Google Scholar
[19] Levy J, Nikitin V, Kikkawa JM, Cohen A, Samarth N, Garcia R, Awschalom DD. Spatiotemporal near-field spin microscopy in patterned magnetic heterostructures. Phys Rev Lett 1996;76:1948.10.1103/PhysRevLett.76.1948Search in Google Scholar
[20] Smith S, Holme NCR, Orr B, Kopelman R, Norris T. Ultrafast measurement in GaAs thin films using NSOM. Ultramicroscopy 1998;71:213–23.10.1016/S0304-3991(97)00062-4Search in Google Scholar
[21] Achermann M, Nechay BA, Morier-Genoud F, Schertel A, Siegner U, Keller U. Direct experimental observation of different diffusive transport regimes in semiconductor nanostructures. Phys Rev B 1999;60:2101.10.1103/PhysRevB.60.2101Search in Google Scholar
[22] Guenther T, Lienau C, Elsaesser T, Glanemann M, Axt VM, Kuhn T, Eshlaghi S, Wieck AD. Coherent nonlinear optical response of single quantum dots studied by ultrafast near-field spectroscopy. Phys Rev Lett 2002;89:057401.10.1103/PhysRevLett.89.057401Search in Google Scholar PubMed
[23] Feldstein MJ, Vöhringer P, Wang W, Scherer NF. Femtosecond optical spectroscopy and scanning probe microscopy. J Phys Chem 1996;100:4739–48.10.1021/jp9517918Search in Google Scholar
[24] Kubo A, Onda K, Petek H, Sun Z, Jung YS, Kim HK. Femtosecond imaging of surface plasmon dynamics in a nanostructured silver film. Nano Lett 2005;5:1123–7.10.1021/nl0506655Search in Google Scholar PubMed
[25] Yago T, Tamaki Y, Furube A, Katoh R. Self-trapping limited exciton diffusion in a monomeric perylene crystal as revealed by femtosecond transient absorption microscopy. Phys Chem Chem Phys 2008;10:4435–41.10.1039/b801856aSearch in Google Scholar PubMed
[26] Duncan J, Reintjes M, Manuccia TJ. Scanning coherent anti-Stokes Raman microscope. Opt Lett 1982;7:350.10.1364/OL.7.000350Search in Google Scholar PubMed
[27] Zumbusch GR, Holtom A, Xie XS. Three-dimensional vibrational imaging by coherent anti-stokes Raman scattering. Phys Rev Lett 1999;82:4145.10.1103/PhysRevLett.82.4142Search in Google Scholar
[28] Evans CL, Xie XS. Coherent anti-Stokes Raman scattering microscopy: chemical imaging for biology and medicine. Annu Rev Anal Chem 2008;1:883–909.10.1146/annurev.anchem.1.031207.112754Search in Google Scholar PubMed
[29] Puorishaag EO, Cote M, Lin D, Evans CP, Potma CL, Xie XS. Chemical imaging of tissue in vivo with video-rate coherent anti-Stokes Raman scattering microscopy. Proc Natl Acad Sci USA 2005;102:16812.Search in Google Scholar
[30] Volkmer A, Book LD, Xie XS. Time-resolved coherent anti-Stokes Raman scattering microscopy: imaging based on Raman free induction decay. Appl Phys Lett 2002;80:1505.10.1063/1.1456262Search in Google Scholar
[31] Gomez-Rodriguez R, Colchero JM, Gomez-Herrero J, Horcas J, Fernandez I, Baro AM. WSXM: A software for scanning probe microscopy and a tool for nanotechnology. Rev Sci Instrum 2007;78:0137058.Search in Google Scholar
[32] Materny P, Falke A, Eravuchira S, Lienau C. Raman spectroscopic identification of fullerene inclusions in polymer/fullerene blends. J Raman Spectrosc 2011;42:1900.Search in Google Scholar
[33] Feng X, Wang X. Thermophysical properties of free-standing micrometer-thick Poly(3-hexylthiophene) films. Thin Solid Films 2011;519:5700–5.10.1016/j.tsf.2011.03.043Search in Google Scholar
[34] Cook A, Furube S, Katoh R. Analysis of the excited states of regioregular polythiophene P3HT. Energy Environ Sci 2008;1:299.10.1039/b805643aSearch in Google Scholar
[35] Shi H, Fu R, Wang Y, Cheng JX. Characterization of photodamage in coherent anti-Stokes Raman scattering microscopy. Opt. Express 2006;14:3951.Search in Google Scholar
[36] Fake H, Wei L, Dietmar Z, Chen WH, Zhiwei L, Colin S. Near-field effects on coherent anti-Stokes Raman scattering microscopy imaging. Opt Express 2007;15:4131.Search in Google Scholar
[37] Webb RH. Confocal optical microscopy. Rep Prog Phys 1996;59:471.10.1088/0034-4885/59/3/003Search in Google Scholar
[38] Puri SH, Puri V, Yadava RK, Kamat JB, Tamboli SV, Joo OS. Optical and electrical properties of polythiophene thin films: effect of post deposition heating. J Optelectron Adv M 2010;12:2305.Search in Google Scholar
[39] Willets KA, D. Van Duyne RP. Localized surface plasmon resonance spectroscopy and sensing. Ann Rev Phys Chem 2007;58:267–97.10.1146/annurev.physchem.58.032806.104607Search in Google Scholar PubMed
[40] Moskovits M. Surface-enhanced spectroscopy. Rev Mod Phys 1985;57:783.10.1103/RevModPhys.57.783Search in Google Scholar
[41] Achim H. Tip-enhanced near-field optical microscopy. Angew Chem Int Ed 2008;47:8178–91.10.1002/anie.200801605Search in Google Scholar PubMed
[42] Shalaev VM. Nonlinear optics of random media. Berlin: Springer, 2000.10.1007/BFb0109599Search in Google Scholar
[43] Chew H, Wang D-S, Kerker M. Surface enhancement of coherent anti-Stokes Raman scattering by colloidal spheres. J Opt Soc Am B 1984;1:56.10.1364/JOSAB.1.000056Search in Google Scholar
[44] Liang AJ, Weippert A, Funk JM, Materny A, Kiefer W. Experimental observation of surface-enhanced coherent anti-Stokes Raman scattering. Chem Phys Lett 1994;227:115.10.1016/0009-2614(94)00779-9Search in Google Scholar
[45] Voronine DV, Sinyukov AM, Hua X, Wang K, Jha PK, Munusamy E, Wheeler SE, Welch G, Sokolov AV, Scully MO. Time-resolved surface-enhanced coherent sensing of nanoscale molecular complexes. Nat Sci Rep 2012;2:5339.10.1038/srep00891Search in Google Scholar PubMed PubMed Central
[46] Steuwe C, Kaminski CF, Baumberg JJ, Mahajan S. Surface enhanced coherent anti-Stokes Raman scattering on nanostructured gold surfaces. Nano Letters 2011;11:5339–43.10.1021/nl202875wSearch in Google Scholar PubMed
[47] Frontiera RR, Henry A-I, Gruenke NL, Van Duyne RP. Surface-enhanced femtosecond stimulated Raman spectroscopy. J Phys Chem Lett 2011;2:1199–203.10.1021/jz200498zSearch in Google Scholar PubMed
©2014 Science Wise Publishing & De Gruyter Berlin/Boston
Articles in the same Issue
- Frontmatter
- In this issue
- Editorial
- Editorial
- Overview
- The optical near-field: super-resolution imaging with structural and phase correlation
- Review article
- Photoconductive NSOM for mapping optoelectronic phases in nanostructures
- Optical and electrical mappings of surface plasmon cavity modes
- Nanophotonics of protein amyloids
- Nonlinear spectroscopy in the near-field: time resolved spectroscopy and subwavelength resolution non-invasive imaging
- Integrating electron and near-field optics: dual vision for the nanoworld
- Tip enhanced Raman scattering: plasmonic enhancements for nanoscale chemical analysis
- Optically induced forces in scanning probe microscopy
- Multiprobe NSOM fluorescence