Multimodal discourse analysis as a method for revealing narrative strategies in news videos
-
John A. Bateman
 and
Chiao-I Tseng
and
Chiao-I Tseng


Abstract
News reporting has long been seen as involving a form of storytelling but techniques for revealing narrative constructions in audiovisual news remain limited. As the forms of expression mobilised for news become ever more diverse and multimodal, the challenges posed for analysis grow accordingly. The present paper asks to what extent we can pursue more differentiating accounts of the increasingly diverse audiovisual features employed in news video by employing recent advances in multimodal discourse analysis. Specifically, we explore how to recognise storytelling strategies deployed in audiovisual news reporting both more reliably and in ways that complement conventional journalistic labels, such as those discussed in research into news sensationalism. As an illustration, we offer a contrastive analysis of the specific reporting strategies of ‘individualisation’ employed in 166 news reports from two leading German news channels, Tagesschau and Bild TV, produced between 1 January 2022 and 15 March 2022. We show how we scale analysis methods to achieve greater coverage of data and discuss how this meets several recurring challenges for multimodal analysis more generally.
1 Introduction: news and narratives
Television news has long been seen as involving a form of audiovisual narrative (Dunn 2005; Ekström 2000; Glasgow University Media Group 1976; Philo 1995; Sperry 1981; Wahl-Jorgensen and Schmidt 2020). Already by the late 1980s and early 1990s, technological developments in the production of TV news were enabling the use of an increasing variety of techniques well-known from narrative film in order to attract viewers’ attention and increase their comprehension (Baym 2004). In contrast to the traditional news reporting model of the ‘inverted pyramid’ (Ytreberg 2001), which focuses on reporting facts ordered by metrics of newsworthiness, in news narratives the reporter, or news agency, functions quite emphatically as a storyteller. In many contexts, this narrative format has already displaced the long-held goal of objective detachment with what is sometimes characterised as ‘engaged journalism’ (Dunn 2005: 144).
This shift has raised several significant kinds of challenges, however, not only for performing analysis but also for tracking potential consequences of engaging with ‘news’ narratively. Narrative itself is well known as a highly effective form of communication across many media and exhibits several important properties that invite stronger engagement with any materials presented (Green et al. 2002) – primary among these properties are patterns of increasing tension and release involving engaging characters together with seemingly ‘logical’ causal connections among sequences of events (cf., e.g., Berning 2011; Dahlstrom 2014; Fludernik 1996; Hogan 2011; Ryan 2004; Smith 1995). Moreover, texts (and other media) are not simply ‘narratives’ or not. Narratives come about by the performance of a range of expositional strategies that collectively lead recipients to assume that a narrative interpretation is appropriate (cf. Wolf 2007); such strategies typically involve the construction of protagonists and patterns of change and development in response to challenges the protagonists encounter (cf. Vogler 1998).
The ubiquity of narratives means that viewers of TV news are already highly familiar with a host of audiovisual presentational strategies typically deployed for narrative purposes across a variety of media. It is then pertinent to ask to what extent such viewing practices may impact take-up in media and genres that have not themselves been traditionally narratival in purpose. Early research on the effects of audiovisual TV news reporting quickly established that there does indeed appear to be a strong carry-over of narrative interpretative habits, even when viewing non-narrative material. Cohen and Roeh (1990), for example, discuss how narrative presentational forms can invite interpretations with respect to perceived protagonists, causes, effects, and impacts quite independent of, and in addition to, interpretations actually intended by news report makers.
Potential consequences of the use of such presentational strategies have subsequently been explored ranging from the effects of the practice of employing ever shorter ‘sound bites’ in place of more extensive presentation of opinions or positions (Adatto 1990), to variations in the ‘stories’ told that arise from distinct kinds of camera movements, framings, and transitions between shots (Griffin 1992; Schaefer 1997). Indeed, Luginbühl and Schneider (2020) have argued recently that the medial possibilities of the presentational forms employed are always strongly co-determinative of the ‘messages’ such complex audiovisual forms construct and so need to be drawn into analysis quite explicitly. Achieving such analysis is, however, complex. The sheer range and complexity of the audiovisual technical features being employed makes it difficult to provide classifications of the phenomena at hand that are sufficiently differentiating to help explore their potential consequences for news message uptake.
The kind of analysis required here is clearly compatible with the goals and tenets of multimodality research: the audiovisual presentational strategies at work are highly ‘multimodal’ in the sense of combining a rich variety of visual techniques, ranging from recorded visual materials to increasingly complex infographics, live and recorded spoken language contributions, as well as diegetic sound effects and, depending on the news producing culture, music. Consequently, obtaining a tighter theoretical hold on the issues of interpretation involved would clearly be a suitable goal for multimodal analysis. But this constitutes a significant research challenge in its own right, one which still lies beyond the capabilities of most current approaches to multimodality. More robust methods for dealing with the presentational forms at work in this and other similarly highly multimodal media are urgently required.
In this paper we move towards this goal of extending practical multimodal analysis by setting out a theoretically motivated but nevertheless directly applicable methodology for analysing audiovisual news reporting incorporating diverse presentational forms. For the purposes of illustration, we focus on one important thread that has run through attempts to engage with the medial consequences of more narratively organised news reporting for some time, that of considering potential associations between the move to faster paced story-telling in TV news on the one hand, and an increase in news sensationalism, considered as infotainment-oriented, lower-quality news responding to the market-driven need to ‘sell’ the news (Manning 2001) on the other; a thorough overview of the ‘sensationalist’ features of audiovisual news broadcasts is offered by Kleemans and Hendriks Vettehen (2009), who extend the concept of sensationalism beyond mere attention-grabbing toward a broad array of filmic editing and storytelling features. The use and effects of such features is now an ongoing area of investigation with many open issues concerning how best it is to be approached (cf., e.g., Arbaoui et al. 2020; Grabe et al. 2001). Particularly important for such studies is to avoid any over-ready identification of the use of narratival techniques with lower quality news reporting. In fact, within journalistic research and practice, the technical features employed for narrativised news reporting are generally regarded as a double-edged sword; while, on the one hand, they may encourage the expression of potentially inappropriate attitudes and the assignment of hero-villain binary oppositions to news protagonists, they may equally, on the other hand, improve engagement, take-up, and even understanding of complex issues (cf. Dunn 2005: 145–155).
This serves to emphasise why it is necessary to achieve more nuanced views of how narratival audiovisual strategies are being deployed. Only then is it possible to map out the potentially quite diverse ways in which such strategies are deployed in different styles of news reporting. Although often attributed to information channels that may be aiming at the spread of disinformation or even fake news, empirical studies such as those of Vettehen et al. (2008), or more qualitative overviews such as that of Gräf and Hennig (2020), have demonstrated that even public news channels nowadays find it difficult to avoid using a variety of features loosely associated with what has been termed ‘sensationalist’ news reporting practice, such as high numbers of camera shots, eyewitness camera, music, zoom-in, story duration, layperson’s talk, and more extended story trajectories and topic organisation. It is quite unlikely, therefore, that such strategies are always being employed for ‘sensationalist’ purposes and more differentiated accounts of both the phenomena involved and their consequences are necessary.
News videos produced in the digital era by market-driven, online news channels increasingly open up opportunities for highly personalised and dramatised form of potentially sensationalist narratives (Wahl-Joergensen 2016), but the general property of employing audiovisual design features in news reporting is by no means a new phenomenon. Graber (1994), for example, reported on a study clearly documenting the need perceived on the part of US TV news directors to present news in an appealing and engaging fashion, emphasising dramatic elements even when the news item itself was not considered particularly dramatic. Indeed, strengthening the appeal to viewers scored by far the highest among the motivations given for design decisions that Graber collected. The news directors sampled already “felt that the way to report a news event was preordained by audio-visual customs that have become a common television language” (Graber 1994: 491; emphasis added). This is again by no means necessarily a negative feature since the use of such features to increase interest by creating more vivid and less detached information can positively improve viewers’ memories of news contents and their comprehension of news severity and relevance (Aust and Zillmann 1996; Sniderman et al. 1991; Zillmann and Brosius 2000). These are important considerations going beyond any simple charges of sensationalism as such.
Untangling the potential triggers for diverse narratival effects and seeing how they distribute across current audiovisual news reporting practices is then of considerable relevance for understanding the contemporary media landscape. Our aim in the present paper is consequently to illustrate how a more differentiating classification of individualised, emotionalised and evaluative news reporting styles can be derived from data by applying recent developments in multimodal discourse analysis. We demonstrate the proposed method by comparing how a selection of presentational features are combined systematically to perform narrative strategies in the service of contrasting communicative goals in both public and private news broadcasts, drawing additionally on some established quantitative methods capable of pulling out reliable patterns from the highly multimodal data.
By these means we seek to address three recurring challenges faced generally by multimodal analysis, illustrating our proposed approach with respect to the specific task of tracking narrative strategies in audiovisual news reporting. The first recurring challenge is that of achieving sufficient scale in analysis to support reliable conclusions and enable predictions concerning likely patterning. As Jewitt (2017), Bateman (2022), and others observe, many multimodal analyses remain case-based, discussing only small numbers of ‘illustrative’ examples. It is not possible on such a basis to argue that any conclusions drawn may be reliably extended so that predictions can be made for broader data sets. Our approach set out below addresses this issue of scale directly. The second challenge is to deal appropriately with internal variety, where particular multimodal phenomena may occur to a greater or lesser extent within specific types of data: this is particularly likely for more complex data such as the kind we are targeting here. It is not to be expected, for example, that news reports of a particular kind – e.g., from a particular channel or concerning a particular topic – will all employ narrative strategies in the same way or to the same degree. Any appropriate account needs to respond to this flexibility in a principled fashion that is still able to offer predictions concerning what will and will not occur. This corresponds to ‘within-group’ variation in standard statistical analyses of variance. Finally, the third challenge concerns external variation, whereby different kinds of news reports may actually differ in their choices of presentational strategies – in this case, we need to be able to show that observed differences go beyond that observed within categories so as to constitute genuine differences beyond natural internal variation; this corresponds to ‘between-group’ variability in analyses of variance. In order to reveal reliable patterns, we generally want to find where between-group variability exceeds within-group variability. Our discussion will show how the methods of multimodal analysis that we propose allow us to make progress towards resolving the difficulties raised by each of these three challenges, advancing the field accordingly.
The structure of the paper is as follows. We first briefly characterise the method of analysis deployed, motivating this both from current multimodality theory and the state of the art in journalistic news reporting analysis. We then show how a corpus of audiovisual news reports annotated according to the analytic categories developed can be interrogated to draw out particular patterns of narrative strategies across channels and topics. These two developments taken together address the three challenges identified, particularly by providing sufficient scale to identify reliable patterns in strategy use that distinguish internal and external variation. We then systematically relate these patterns of variation back to both news channels and news topics. We argue that this constitutes a valuable exploratory study that not only improves our analytic hold on complex multimodal audiovisual forms of journalistic media, but which also demonstrates more generally the effectiveness of the proposed method for engaging with multimodal analysis at a level ‘beyond the case study’.
2 Operationalising the narrative strategy of individualisation in news reports
As explained above, the audiovisual technical features used in more narratival news reporting are complex and varied. Features observed in the literature to date include showing opinions and responses from laypeople, bystanders, individualised events and actions, closeups of individual faces, as well as reporter or news commentators’ references to themselves as ‘pseudo’-participants in the reported events. A substantial challenge for engaging with the multitude of technical features available in audiovisual media is precisely the lack of well-developed frameworks capable of dealing with such diverse presentational forms in the context of journalistic media. Such practices freely combine information from spoken language, written language, static and dynamic visuals, sounds, and so on. This breadth of expressive forms has not previously been accessible to analysis and, as a consequence, those presentational forms that have received attention have often remained restricted, most commonly focusing on verbal information occasionally extended to consider specific cases of visual support for the verbal messages. We therefore consider the application of analytic techniques developed within multimodal discourse analysis as an essential prerequisite for meeting the challenges of contemporary audiovisual news editing practices more fully.
Previous research has investigated how dramatic elements in TV news co-occur in the process of narrativisation. In Graber’s (1994) earlier study, for example, news segments were explicitly coded for conflicts, emotional appeals, and intensification by close-ups among other categories in order to derive an ‘infotainment’ quotient for comparing reporting styles. Subsequent research has, however, repeatedly raised the problem of identifying cases of narrativisation with sufficient reliability and detail to support firm conclusions (Grabe et al. 2001; Vettehen et al. 2008). We now build on this previous work by applying results from multimodal discourse analysis to achieve a more robust basis for a larger-scale coding of news segments for properties supporting narrativisation. More specifically, our framework investigates how the narrative construction of ‘individualisation’ can be identified and tracked across contrasting new reporting styles. We consider individualisation to be at work whenever there is personalisation by means of expressions of attitudes and emotions from characters appearing in the news, or emotionalisation of people and events either verbally or by any other means, such as displays of emotional responses, facial expressions, visual framing, and so on. In general, individualisation means that news stories are tied more closely to the individuals involved in news events, regardless of whether those individuals are reporters, direct protagonists, or bystanders affected by the events. In each case, those individuals are constructed as emotional and engaged agents (cf. Wahl-Joergensen 2016).
To help track occurrences of individualisation and how its use might vary across different kinds of news channels, we focus attention on a detailed multimodal analysis of the presentational features associated with five core types, or roles, of people in the news. These roles were selected drawing on standard accounts of the overall ‘generic’ structure of news reporting (Griffin 1992). They include: (i) anchor person, (ii) reporter, (iii) news commentator, (iv) protagonist of news events, and (v) layperson. The first three traditionally represent the authoritative voice in news and so it is relevant to track and analyse whether this voice is maintained as objective or if there is personalisation by means of expressions of attitudes and emotions. The fourth type, protagonist, refers to the people who are focused on in a news event: that is, instead of reporting about the event, the news centres on these people’s actions and interactions. The final type, layperson, refers to people interviewed on the street or represented as exemplars of people affected by the news event.
Our primary task is then to show how these core news roles may be used together both with particular types of content and particular audiovisual forms of expression that construct those roles discoursally as individualised. Focusing on the multimodal construction of these roles for a range of distinct kinds of news reports then allows us to investigate the broader constitution and use of individualisation strategies, for example as they occur across varied types of news channels. For current purposes, we contrast quite specifically public and private news channels, exploring how they individualise, personalise, or emotionalise their reported people and events. A straightforward hypothesis concerning these channels is that the public news channels will individualise to a lesser degree than the private news channels because the latter need to position themselves more in a market economy. But precisely how and in what ways the individualisation might vary is unknown.
To show the analysis in action, we now briefly characterise the data selected for analysis and then set out the analytic method employed in detail.
2.1 Data: the news channels analysed
A particularly effective manner for investigating complex cultural artefacts that is widely employed in many disciplines is that of performing focused comparisons of some objects of interest (cf., e.g., Luginbühl 2014). Whereas the distinctiveness of some artefacts might not stand out when considered in isolation, when brought into contact with motivated contrast sets, differences may stand out in relief and so guide further exploration and theory building.
We consequently applied the categories of analysis we introduce below for interrogating individualising news reporting to a corpus explicitly constructed to plausibly reflect contrasting positions on the nature of news reporting. For present purposes, we focus specifically on news reports produced by two contrasting German news channels: Tagesschau, the most viewed public, daily news program in Germany, and Bild TV, the most popular private, online news channel. An initial selection was made of 166 news videos, 70 from Tagesschau and 96 from Bild TV. These videos were all produced between 1 January 2022 and 15 March 2022. The length of complete news programs in both channels is around 15–25 min and so, for the purposes of the current study, we restricted analysis to the first news report of each news video. This represents the top news story of the entire program and usually lasts from 3 to 5 min. The most reported top news themes from January to the middle of March 2022 were Covid-19 and the outbreak of the war in Ukraine, allowing us to focus quite specifically on differences in presentational strategies adopted with respect to overlapping themes.
2.2 Method: multimodal cohesion
As explained above, our main task is to explore how recurring elements of evaluation and emotion, events and places may combine with the core roles of news reports so as to give rise to a range of differently nuanced narrativisation stances in news stories. To identify such elements while still doing full justice to the highly diverse presentational forms they may take when constructing audiovisual news reports, we employ the specific analytic framework of multimodal cohesion originally developed for characterising the construction of narrative in film (Tseng 2013; Tseng et al. 2021). This has the twin benefits of already being multimodal in orientation and design and of having been applied previously to a broad range of narrative contexts in a variety of media.
The basic tenet of multimodal cohesion is that the recurrence of images, sounds, verbal language, written language, camera movements, framings, colours, and any other audiovisual features renders those features significant for the unfolding discourse. In particular, combinations of reoccurring elements create multimodal ‘texture’ by which certain elements are constructed as being relevant for interpretation. Although any items deployed in an audiovisual sequence may potentially be available for inclusion in a cohesive analysis, actual analysis restricts this by focusing attention solely on items that reoccur: that is, items are only taken up in the cohesion analysis when they contribute to chains of re-occurrence. It is a fundamental tenet of the theory, now borne out in several empirical studies involving a variety of media (e.g., Tseng et al. 2021), that such strategically deployed re-occurrences play a central role in guiding viewers in their interpretations of what a sequence is about (and what it is not about).
We now apply this form of description to audiovisual news reporting in order to analyse and track the narrative construction of the core roles active in those news videos. We illustrate the process briefly with respect to the beginning of one of the news videos in our corpus produced by Bild TV. This news video was broadcast online on 25 February 2022, the second day of the Ukraine war. Screenshots and the English translation of the beginning sequence of the news report are shown in Figure 1. The report starts with the male anchor introducing a correspondent named Peter Hell in Kyiv. The anchor first tells viewers that the correspondent had earlier been hiding in a bunker with other civilians. He then interacts with the reporter directly, asking him how the situation is while also humorously reminding him to move the microphone closer to his mouth. This casual reminder makes the anchor himself and the reporter laugh. When Peter Hell takes over, he first talks about his own voice, before starting the report proper. As one can already see in this example sequence, the Bild TV news report often personalises the reporters’ interactions – the casual exchange between the reporters is more similar to characters’ dialogues in film narratives or informal face-to-face interaction than to the traditional depersonalised reports of news readers.

Three initial screenshots of a Bild TV news report from 25 February 2022.
Producing a cohesion analysis of news segments such as this allows us to track such individualisation effects more finely. In particular, we can investigate whether, for example, protagonists and laypersons are narratively ‘tracked’ by employing specific audiovisual presentation strategies, such as visual framing with close-ups or allowing the expression of personalised opinions. Multimodal cohesion analysis supports this task by documenting any re-occurrences of formal elements as these come to be deployed in any segments analysed. Formal elements can be taken from any of the technical features possible within the medium regardless of their presentational form. Re-occurrences then constitute particular cohesive structures, termed multimodal cohesive chains (Tseng 2013), that show how elements appear and re-appear as the audiovisual material unfolds. The fine specification of these chains then records the multimodal realisations of each cohesive element as its appears over a film sequence.
The result of a multimodal cohesion analysis is consequently made up of a set of interlinked cohesive chains that together serve to make the multimodal texture of an audiovisual artefact visible. Figure 2 then depicts the main cohesive structures for the selected Bild TV sequence. The vertical organisation of the graph represents the approximate development of the sequence in time. Items shown on the same level horizontally overlap temporally. Temporal segmentation is imposed whenever perceptually distinguished events are presented, as occurs in cuts between scenes for example, but regardless of whether those cuts occur in the ‘main’ image or in individual images appearing in split screens.

Cohesive chains of the sequence in the Bild TV news report segment from Figure 1.
In the present example, therefore, we can see that the multimodal cohesion analysis reveals seven distinct kinds of people, places, things and events to be construed as narratively ‘dominant’ in the sequence. As is to be expected in this genre, these partially align with the core roles for news reporting as identified above, such as ‘anchors’ and ‘laypersons’. Since these roles regular re-occur, there are naturally cohesive chains corresponding to them. In addition, however, there are also further elements that the cohesive analysis shows as patterning with these roles. For example, several particular aspects appear that are more directly linked to the specific news report, such as ‘Putin’, ‘War’, and so on. Each of these elements becomes visible as a single re-occurrence chain, shown running vertically downwards in the figure. The specific presentational modes used for realising the elements in the cohesion diagram are indicated in square brackets under each element. The first cohesive chain in the figure, anchors, for example, is made up elements first seen in the modes of [talking head] (the talking male anchor) and [filmed event] (the non-talking female anchor) in image 1. The same modes of the male and female anchors continue in the second image and so further [talking head] and [filmed event] elements are introduced. These two sets of elements are linked with an arrow showing the cohesive re-occurrence.
Similarly, the second cohesive chain in the figure specifically tracks the occurrence of the role layperson. In this case the chain cohesively links the realisation of three different modes across the three images. In the first image, a victim in [close-up, static image] can be seen in the background. Furthermore, the bottom part of the split screen in the background also continuously shows a [filmed event] where Ukrainian civilians enter cars to flee Kyiv. The third element is realised in the verbal mode by means of the term Zivilisten (‘civilians’) mentioned by the male anchor in his talk in the second image. The victim in the close-up image, the Ukrainian people in the split screen, and the civilians mentioned by the anchor do not refer to the same individuals but are nevertheless linked cohesively by virtue of the cohesive relation of hyponomy—i.e., belonging to a single overarching class: they belong to the same generic semantic category of laypersons (cf. Royce 2007). As a consequence, they are linked by cohesive arrows in the diagram of the figure as well.
The third cohesive chain tracks the individual, Putin. The particular re-occurrences driving this are the fact that his name is written on the first and the second images in the background as PUTINS BLUTIGER KRIEG (‘Putin’s bloody war’). The same line is also visible in the smaller caption at the bottom of the first and second images. Thus, although not personally visible, Putin is nevertheless one of the most ‘textually’ salient elements in this sequence. The location elements Ukraine and Kyiv are also repeatedly presented and so constitute a cohesive chain. Importantly, this fourth chain is also multimodally realised. Ukraine is first seen as [written text] in the caption in the first image and then the capital Kiew (‘Kyiv’) is mentioned by the anchor as well. Ukraine and Kyiv are combined into one single chain based on the cohesive relation of meronymy, i.e., parthood, because the capital city is part of the whole country (cf. Royce 2007). The third mode in the first image is then Ukraine realised as a [filmed event] because the top segment of the split screen continuously shows the city filmed from a high angle. The same set of modes continue in the second image. In the third image, the term Stadt ‘city’ is written in the caption and mentioned in Peter Hell’s talk, while the same filmed event of Kiew’s city view continues.
The fifth, sixth, and seventh cohesive chains are produced similarly. The fifth chain shows the dominant narrative element of an event, Krieg (‘war’), first described in written text, specifically as Putin’s war. This is tracked twice because, as with Putin, a re-occurring realisation also appears in the caption at the bottom. In the third image, the term Kämpfe (‘fighting’) is linked back to Krieg (‘war’) cohesively because fighting and war are further examples of hyponyms in the broader semantic category of violent conflict. The sixth chain is constituted by the re-occurring evaluative descriptions of the conflict as blutig (‘bloody’), realised in a written caption as BLUTIGER KRIEG (‘bloody war’). As was the case for the previous cohesive chain, the term SCHWERE KÄMPFE (‘heavy fighting’) in the third image also refers back to BLUTIGER KRIEG (‘bloody war’) via a relation of hyponymy. The seventh and final cohesive chain is then constituted by the re-occurring realisation of the reporter. The first link in this chain shows that he is introduced in the talk of the main male anchor in the first image as Peter Hell and ihm “him”. In the second image Peter Hell is seen for the first time in the split screen, and so the cohesive chain includes the filmed event where his identity is revealed visually. As the anchor continues to introduce Peter Hell, the chain also includes er (“he”) and Peter in the anchor’s talk. The chain structure is then extended to include the reporter’s realisation in the [talking head] mode in the third image and in self-reference as he frequently refers to himself as ich (‘I’), mein (‘my’) and mir (‘me’). The last link in this chain is the [written text] of his name in the caption.
Since these seven cohesive chains are derived directly from the analysis of the re-occurrence of the presentational forms occurring in the segment, they offer a reproducible method both for isolating elements that function dominantly for the purposes of interpretation and for documenting how those elements are expressed multimodally within the segment analysed. The final step to considerations of narrativisation strategies and, in particular, issues of individualisation is made by examining just which chains co-occur with those of the core news roles. When these other dominantly tracked narrative elements involve particular emotions, evaluative features, specific framing, and so on, we can take individualisation to be at work. In other words, the starting point of our investigation of individualisation strategies is the varieties of combinations of the core types of people with other elements that serve to narrativise the news stories. All that remains now is to show how this can be made to provide a basis for conducting analysis at scale.
2.3 Scaling up
As identified above in our first recurring challenge for multimodal analysis, we consider it important for multimodality to achieve more reliable results by moving beyond individual case studies of small numbers of examples. This sets methodological demands of its own since multimodal analysis is still often labour-intensive and so difficult to perform at scale. In this subsection we show how it is possible to design a procedure for analysis that stretches between close analysis of the kind seen in the previous subsection and reproducible sets of analysis appropriate for drawing patterns from larger data sets by statistical techniques. By these means we then move the analysis to cover an entire corpus in order that distinctive patterns of usage can be revealed.
The cohesive analysis presented serves well as providing an effective and reliable analytic progression from any news segment analysed to the dominant discourse elements constructed by those news segments. As noted above, these will in general come to include both categories common to news reporting and categories more specifically emerging from the topics reported on – such as, in our data, appearances of the Russian president Putin – as well as particular technical qualities and emotional features as well. We now use these co-occurrences as operationalisations of specific individualisation strategies. For example, if we have a combination of chains where not only a layperson is present but that layperson also co-occurs with a multimodal presentation chain as a closely framed talking head, then the news segment as a whole is individualising that layperson. The combination is crucial since, as we can see in our example Bild TV segment, although there is a prominent cohesive chain for laypersons, this alone does not indicate that those laypersons are being individualised in the report. Defining criteria for coding in this way then complements more traditional media analysis methods such as content analysis by focusing not on the occurrences of individual items, but rather on the occurrence of such items within particular discourse patterns – here, specifically, cohesive chain combinations. This follows the general tenet of the theory of verbal cohesion that it is the patterning in terms of chains that is most revealing about textual organisation, not the bare presence or not of potentially cohesive items individually (cf. Hasan 1984).
For our current task of providing characterisations of news reporting styles that we can then subject to larger-scale analysis, we define several particular combinations of multimodal cohesive chains as constituting target individualisation strategies. The cohesive properties provide sets of recognition criteria for those strategies which can then be annotated for a corpus. The distribution of these strategies across the corpus then establishes a convenient intermediate level of abstraction that, as we shall see below, can be used directly to characterise the varied news reporting perspectives exhibited by the channels examined. For the present study we select just nine cohesive chain combinations to define nine corresponding individualisation strategies. A video segment is coded as exhibiting a strategy only when the identified chain combination holds in the analysis of that segment.
The first five strategies refer directly to the core roles as introduced above:
Cohesive chains of a layperson in [talking head] mode, i.e., whether a news video employ laypersons’ interviews as just mentioned above.
Cohesive chains of a specific protagonist, i.e., whether a particular individual in the news report is identified and tracked as a specific protagonist by means of framing, close-ups, verbal reference, and so on.
Cohesive chains involving Putin, i.e., when the Russian president appears verbally or visually.
Cohesive chains combining laypersons and protagonists in [close-up] mode, i.e., whether close-ups of the faces of the two types of individuals are shown.
Cohesive chains revealing self references of anchors, reporters or commentators: i.e., where the verbal language includes uses of self-references, such as the uses of ‘I’, ‘my’, ‘me’.
In addition to these multimodal configurations, we also classify directly how the individuals involved may be combined with chains corresponding to the following highly evaluative features:
Cohesive chains of events related to arguments, conflict, war, violence, etc.: i.e., similar to the cohesive chain of war illustrated in Figure 2, we analyse whether any chains of conflict-related events appear, again regardless of their mode of presentation.
Chains of negative evaluation: i.e., whether cohesive chains of quality features, particularly negative evaluative features, such as the cohesive chain of “bloody, heavy”, are found across news reports.
Chains of emotions: i.e., whether there are re-occurring multimodal realisations of emotions, for instance, emotional terms mentioned in spoken or written texts or emotional reactions shown in visual images or sounds.
Finally, we also investigate an example of a particular medial strategy documented as arising from the exigencies of audiovisual news reporting, that of:
Wallpapering: where background images unrelated to the contents of the news report are shown as ‘generic’ indications of the topic or objects concerned (Griffin 1992: 137); this category overlaps with the classification of ‘symbols’ suggested in Graber (1994) and so may well also perform a ‘narrativising’ function.
Several such decorative images are visible in Figure 1. For example, the filmed events shown in the side screens, namely, the Ukraine city views and Ukrainian people driving cars, are not specifically related to the contents talked about by the anchor or the reporter at that point.
These nine categories provide a classification scheme that can be applied to each video segment analysed. Consequently, each segment in the 166 videos of the corpus was coded according to each of the nine classification categories. A category was taken to be present when the corresponding combinations of cohesive chains defined here were identified in the cohesion analysis. Consequently, each video receives nine binary codings, one for each category: a category was coded as ‘1’ when the corresponding strategy was successfully identified in a video and as ‘0’ when it was not. The result of the entire corpus analysis was then a 9 × 166 table of binary values. In addition, metadata information was recorded for each video including the channel (Tagesschau or Bild TV), the date of transmission/release, and the main topic of the segment (classified as Covid, Ukraine War, or ‘other’).
Performing a corpus-based study in this way allows us to move in a methodologically principled fashion from a functional multimodal discourse analysis in terms of cohesion of the raw audiovisual reports to a succinct representation of the entire corpus with respect to the individualisation strategies employed. It remains then to examine in detail whether this analysis supports statements concerning the distinctive use of these strategies across the channels and topics covered, which we take up in the section following.
3 Techniques for interpreting the analysis
In the previous section we saw how it is possible to move from, on the one hand, a fine-grained discourse-oriented description of audiovisual news reports open to the full range of multimodal editing patterns that such reports nowadays commonly deploy to, on the other hand, a succinct representation that can be employed to look for larger-scale patterning across a data set. This corresponds to the very common task in corpus-based approaches to language of finding patterns in the quantitative data collected. In our present case, this will primarily involve comparing and contrasting the co-deployment of the strategies described across the channels being analysed in order to explore how overall strategies of individualisation might be being used differently or similarly.
In multimodal analysis the challenge of revealing patterns in the data is also well-known, but there are few established practices. This overlaps considerably with approaches explored in the digital humanities, where scale is more the norm. Techniques proposed there rely heavily on visualisations, ranging from large-scale, but low abstraction, ‘canvases’ presenting the raw data for comparison (Manovich 2008, 2012), to diagrammatic representations as maps or networks pulled from some data (Moretti 2005; O’Halloran et al. 2014). Particularly the latter approach is taken up by notions of ‘distant reading’ (Moretti 2013) and, for visual analysis, ‘distant viewing’ (Arnold and Tilton 2019). Within accounts of multimodality, Baldry (2004), Baldry and Thibault (2006), and others have considered the use of ‘multimodal concordances’, where, similarly to concordances in linguistic corpora, items of interest are placed in their immediate contexts of use to support finding patterns, whereas Caple et al. (2018) propose a software tool for visually scanning the selection of analytic features across a corpus. While many of the visually-based approaches can be beneficial when exploring data, they are less useful for extracting patterns as those patterns may very well not be easily accessible to perception. Indeed, it is often only the selection of effective generalisations for organising data that allows revealing visualisations to be designed (Bertin 1983; Ciula and Eide 2017; Engebretsen and Weber 2017; Tufte 1997).
The techniques for processing the quantitative data gathered that we describe in this section are consequently focused on the process of finding generalisations. This concern is primarily methodological in that we seek to show how there can be a smooth path building on the kinds of analysis performed in the previous section to a variety of productive visualisations and characterisations of the data gathered. To the extent that the differences shown support or refine previous observations concerning the distinct media investigated, we would argue that the form of analysis employed is succeeding in providing a systematic analytic transition from audiovisual data, via functional multimodal discourse analysis, to narrative cues available for guiding the interpretations of viewers. Below we then show several of the ways in which this level of analysis feeds directly into characterisations of similarities and differences in strategy use across news channels, topics, and time periods. We suggest that such categorisations may then be more finely discriminating with respect to the narratives constructed than those that have been employed in earlier accounts that have been more restrictive with respect to the range of multimodal resources included.
One common thread running through the illustrations we present is the technique of dimensionality reduction, already long established in many quantitative fields of study. This covers a family of precisely defined techniques whereby relationships between variation on a range of dimensions are reduced to lower dimensional descriptions by discovering correlations within the variation observed – that is, if two dimensions generally pattern similarly as descriptions of some data, then they can be replaced by a single new composite dimension. Several methods for calculating such composite dimensions have received extensive development in the literature and are also already regularly applied in textual analysis. Of these, principal components analysis (PCA), factor analysis (FA), correspondence analysis (CA), and singular value decomposition (SVD) are probably the most well-known. A growing number of introductory books is now available showing how to perform these kinds of analysis with the free software R (R Core Team 2016), which is also the tool we use throughout this paper. Levshina (2015) and Winter (2020), for example, provide many illustrations with respect to linguistic data and its interpretation. Here we show how such techniques are equally relevant for multimodal analysis as long as one is able to provide corpus-scale descriptions of the kind set out in the previous section. We also introduce some further techniques for exploring regularities in the data by applying generalised linear models and decision trees for formulating predictions (cf., e.g., Levshina 2015). Although the techniques themselves are well established, their use in the analysis of complex multimodal data, such as that found in audiovisual news reports, is nevertheless still very much at its beginning.
When engaging with data, it is usually recommended that one obtains overviews of what has been found in order to set up directions for more detailed exploration – that is, one is often interested in getting an overview of potential differences and similarities more broadly before drilling down into the results to explore more specific sources of contrast. This can be done directly on the basis of how the occurrences of the nine categories of analysis described in the previous section were distributed across our two channels of interest by plotting the obtained scores alongside each other as shown in the ‘radar’ or spiderweb plots in Figure 3. Here we can readily assess the similarities and differences in strategies in terms of overall strategy ‘profiles’. The general impression is that Tagesschau is somewhat more ‘restrained’ in its deployment of the named strategies as, indeed, would be expected for this and similar channels because of the well known sobriety of their reporting style (cf., e.g., Luginbühl 2014: 306).

Contrastive strategy profiles for the two channels. Graphs produced with the fmsb R-package.
These two profiles strongly suggest that there are differences between the deployment of strategies across the two channels and so it becomes relevant to ask more precisely just which of those differences may be statistically significant. To answer this question, Figure 4 again reports the overall counts of occurrences of the nine categories in the two selected TV channels but indicates in addition the results of a Fisher’s exact test concerning the significance of the observed differences in counts within each individualisation category across the two channels. Here it additionally becomes clear that, although both channels might be said to be employing individualisation as a technique for raising the interest-value of their reports, they do so in differing ways. The comparison shows, for example, that Tagesschau uses significantly more protagonists to report news events than does Bild TV (Fisher’s exact test, p = 0.001). This means that Tagesschau actually individualises news stories more than Bild TV does, but in a very specific way; we return to this in more detail below.

The percentage occurrences of the nine categories in Tagesschau (N = 70) and Bild TV (N = 96) and corresponding p-values indicating the significance of difference in counts across the two channels (Fisher’s exact test). Statistics calculated with R (R Core Team 2016); graph produced with the ggplot2 R-package (Wickham 2016).
Somewhat in contrast, the result in the category of Putin indicates that Bild TV specifically individualises Putin significantly more than Tagesschau. Indeed, as we shall also show analytically below, in our data and the time-period examined, Bild TV largely labels the Ukraine war or the violent conflict as Putin’s war, while Tagesschau mostly relates the war to the ‘invasion of Russia’ or Russian soldiers. Figure 4 also shows that the categories of conflict events, emotional reaction, negative evaluation and wallpapering all show differences across the two channels, with the use of these strategies being significantly more prevalent in Bild TV than in Tagesschau. Moreover, the substantial use of self references of reporters in Bild TV is additionally indicative of the common insertion of personalised attitudes and opinions into their news reports on the scale of the entire corpus rather than in the individual reports used for illustration in the previous section. Finally, and again in contrast to these differences, the occurrences of closeup faces and the talk of laypersons show no significant difference across the two channels (Fisher’s exact test, p = 0.101 and p = 0.324 respectively). Both channels, therefore, can be seen to use the individualising feature of closeups and laypeople in their reports.
These results already suggest, therefore, that the two channels differ in the individuation strategies that they use, even though they both deploy at least some combinations of these strategies. This also supports general observations concerning the complex nature of similarities and differences across the channels when employing the distinct fine-grained strategies contributing to individualisation. It is not possible, evidently, to simply label the channels in terms of a common degree, or lack of, individualisation as a strategy as a whole. It is necessary instead to examine the data in more detail in order to see whether we can uncover more fine-grained patterning and dependencies among the strategies used. Naturally it would be advisable here to gather more data for more reliable conclusions, but the data as collected already leads to certain predictions concerning what one might find as well as setting up interesting hypotheses for further more focused investigation.
To take this further, we characterise the data more finely by performing dimensionality reduction using principal component analysis (PCA) to see how the individual news videos cluster with respect to the strategies they employ. PCA is perhaps the most straightforward way of characterising potential relationships among strategy use in the data and will allow us to show in more detail whether there are similarities in how the analysed strategies are used across our channels of interest. That is, whereas the previous overview showed that there are broad differences in how the strategies are employed across the channels, it was not yet showing whether there are any dependencies or relationships among the strategies. We would not yet know, therefore, whether or not certain strategies regularly occur together or regularly contrast in their use. PCA is a useful technique for this question because its calculation of a reduced number of dimensions is based precisely on similarities among the dimensions being reduced. Thus, if we take the dimensions to be reduced to be our nine individualisation strategies, it is those strategies’ co-patterning that determines the reduction. If certain strategies have the same or similar distributions in the data, i.e., they pattern in similar ways, then they can be effectively ‘summarised’ by producing a new single dimension of description, or ‘principal component’. This ‘summarisation’ is not, moreover, an either-or situation. Particular groupings of the original dimensions will contribute to a greater or lesser degree to each newly derived ‘summary’ dimension.
Naturally, as a general technique, PCA can be applied regardless of the particular properties of the media being investigated and their number but we focus here for the purposes of our research question on the relationships between the strategies defined. The first step in performing this analysis is then to calculate the principal components on the basis of the data and show how these relate back to the original nine individualisation strategies. The results of this step in the procedure are typically inspected in graphs of the kind shown in Figure 5. Here, for the purposes of comparison, we have performed the dimension reduction separately for the two subsets of the data formed by the Tagesschau videos (left) and the Bild TV videos (right). Each graph consequently shows how the nine individualisation strategies relate to the first two newly derived summarising dimensions, or principal components, calculated for each subset of the data.

Principal component analysis shows how the nine variables contribute to the components in the two channels (analysis performed using the FactoMineR R-package).
These graphs are read as follows. The horizontal and vertical axes correspond to the first and second principal components respectively. The individual arrows in the graphs then show how the original individualisation strategies are related to the derived dimensions. The closer an arrow is to the horizontal dimension, the more strongly the corresponding strategy contributes to the first principal component; similarly, the closer an arrow is to the vertical dimension, the more strongly it contributes to the second principal component. Thus, for the Tagesschau we can see that the strategy ‘Putin’ contributes strongly to principal component 2 (‘Dim 2’), whereas the strategy ‘layperson’ contributes to principal component 1 (‘Dim 1’). The lengths of the arrows indicate how much of the variation in the data is covered by each respective strategy. More information on both producing and reading these diagrams can be found in, for example, Levshina (2015: 356–359).
Since the PCA dimensions are derived purely by maximising the coverage of the data and have no intrinsic meaning in their own right, most relevant to our goals here are the relative angles of the narrative strategies to each other within and across channels. The smaller these angles, the more the identified strategies pattern similarly in the data. Thus, whereas the specific directions of the arrows in the graphs are not in themselves significant, the relative directions, or angles between the arrows, are. A comparison of the two graphs then clearly suggests that quite different relations are adopted among the strategies in the two channels. For instance, the left graph shows that emotion and layperson’s talk show a similar pattern of use in Tagesschau by virtue of their respective arrows pointing in similar directions (horizontally to the right). In contrast, examining these strategies for Bild TV in the right-hand graph shows the use of emotion does not pattern similarly to laypersons’ talk at all as the directions of the respective arrows (layperson pointing vertically upwards and slightly to the left, and emotion pointing diagonally downwards to the left) are quite different.
It is important to understand just what results of this kind are showing and what they are not showing. No claims are being made concerning any specific news report and its deployment of individualisation strategies. As with textual ‘distant reading’ as explored in the digital humanities (cf. Moretti 2013) and more recent proposals of ‘distant viewing’ (Arnold and Tilton 2019), the co-patterning of specific collections of strategies is a statistically reliable property of the data set as a whole. The strategies that co-pattern are demonstrably different across the news channels examined. This is indicative of a difference in news reporting styles in a manner quite analogous to the nature of probabilistic registerial differences observed for verbal language (e.g., Biber 1988), but now extended to the multimodal case.
It is also interesting to place individual decisions made in the reports against the background of the general reporting styles revealed. For example, in the data set analysed, Tagesschau often showed emotional reactions when individualising laypersons’ talk. In contrast, Bild TV often expressed emotional reactions during the talk of reporters or commentators, which was not at all the case with Tagesschau. Similarly, in the Bild TV reports in our corpus, Putin and conflict events were closely bundled together, whereas in Tagesschau the two variables are slightly more separated. We also see a certain alignment between laypersons and closeups in Bild TV, whereas in Tageschau these strategies tend again to be quite distinct. By these means, we can begin to pull out a range of further fine-grained distinctions between the two channels directly indicative of the kinds of news presentation strategies being employed.
An effective way of showing further aspects revealed by the PCA is to produce graphs that position each of the original data points – in our case the annotated videos – according to their contributions to the newly calculated reduced dimensions. This produces a topological characterisation of the analysed videos: i.e., news reports that pattern similarly according to the contributions of their individualisation strategies appear relatively closer to one another, while news reports whose use of strategies is dissimilar appear further apart. An example of such a graph is shown in Figure 6. In this case, we performed the underlying PCA calculation pooling both the Tagesschau and Bild TV videos so that we can directly compare how the two channels position their videos. To support this, the calculation of the principal components is done solely with respect to the values of the individualisation strategies; no other meta-data information, such as the channel, topic, or time of release, is considered so that that meta-data has no influence on the summarising dimensions derived. This is necessary because we now want to investigate how the videos pattern with respect to their use of the strategies without pre-judging the issue of whether individual channels or topics differ. Each point on the graph then denotes a news report in our data, positioned according to the newly calculated summarising dimensions (again labelled ‘Dim1’ and ‘Dim2’ in the graph).

Graph showing how the videos of the complete data set are placed according to the first two summarising dimensions given by the principal components of the PCA analysis. Graph produced with the factoextra R-package.
Although the calculation of the position of each video in the PCA is made without consideration of any meta-data, that meta-data is still available for each data point. This means that it is possible to fold the meta-data into the graph to produce further useful visualisations. In Figure 6, for example, we show the information identifying the channel of the originating news reports being used in two ways. First, the data points are coloured and shaped according to their channel of origin, so that one can see how they distribute across the space: Bild TV are shown as (red) circles and Tagesschau appear as small (orange) triangles. This reveals quite clearly that the two channels are indeed quite different with respect to their overall usage of the individualisation strategies: the Bild TV videos are mostly on the right-hand side of the graph, while the Tagesschau videos are mostly on the left-hand side. This means that Bild TV videos score more highly on the first principal component dimension, while the Tagesschau videos score less. Second, to refine our view of this distribution still further, correspondingly colored ellipses are added depicting 95 % confidence intervals around the ‘most likely’ central locations of the two channels in the space: i.e., the ranges within each of the two dimensions where the means of their respective values lie with 95 % probability given the data. This establishes that the two channels are significantly different along the first dimension but not with respect to the second dimension, since there they are both positioned around the zero mark. We thus have another clear demonstration that the channels differ in their deployment of the annotated individualisation strategies.
We can produce such graphs similarly incorporating any of the meta-information gathered for the data in the corpus. For example, we can ask whether the three topics recorded in the data, ‘Covid’, ‘Ukraine War’, and ‘other’ are associated with different individualisation strategies or not. The corresponding plot is shown in Figure 7. Here we see again that there is a significant difference in the combined use of individualisation strategies along the first dimension for the different topics addressed in the videos, but not along the second dimension. Among these the treatment of the topic ‘war’ is markedly different from the other two categories. Whereas background knowledge concerning the styles of the two news channels would probably lead one to expect that the two news channels should differ broadly in the manner now shown to be the case empirically in Figure 6, presuppositions concerning the channels’ treatment of particular topics are probably considerably less clear cut. Nevertheless, the results shown in Figure 7 demonstrate that here too reliable differences, and differences of particular kinds, are present.

Graph showing how the videos of the complete data set are placed according to the first two summarising dimensions given by the principal components of the PCA analysis with the distinct topics addressed highlighted. Graph produced with the factoextra R-package.
Since for our current purposes we are primarily interested in contrasting the two channels on a variety of dimensions, our last PCA example now combines several kinds of information in the single somewhat more complex overview plot shown in Figure 8. The background data is as before, but now we combine both topics and channels. In addition, in order to assist interpretation of the differences, the relative contributions of the original individualisation strategies are also superimposed on the graph by means of the labelled arrows leading away from the centre. This is similar to the representations shown in Figure 5 above but, in this case, records the dimensions created when the data from the two channels is pooled together. The graph then shows how the horizontal axis, which separates the various videos most effectively, is contributed to primarily by the strategies of ‘wallpapering’, ‘self reference’, ‘negative evaluation’ and ‘emotion’. Both ‘closeup’ and ‘layperson’, in contrast, pull videos towards the left along that dimension, although their effects are not as strong as those towards the right because they lie more diagonally than horizontally, thus adding a vertical component. The confidence ellipses with dashed edges delimit the respective means for the Tagesschau videos, while the confidence ellipses with bold continuous edges delimit the respective means for the Bild TV videos. The Bild TV data in fact only included videos on either Covid or the war in the Ukraine and so only two topic-related ellipses appear, whereas Tagesschau has three.

PCA analysis results annotating the individual videos in the data set according to their channel and topic. Graph produced with ggplot2 package.
This composite graph offers a concise summary of several of the points made above. Since the confidence ellipses are mostly distributed along the horizontal axis (i.e., PCA dimension 1) and do not differ significantly along PCA dimension 2 (as shown by their vertical extent overlaps), we can conclude that presentational strategies that are more vertical than horizontal will not serve to distinguish between videos significantly. The presentational strategies playing the strongest role in distinguishing the videos both by channels and by topics are consequently those that lie most parallel to the horizontal axis. In contrast, the strategies ‘closeup’ and ‘layperson’ are the most vertically aligned, which corresponds directly to the tests of significance reported in Figure 4 above, where the counts of just these strategies were shown not to significantly differ between channels. On the basis of the present graph we can see that this also likely holds for differentiating between topics as well – indeed, grouping topics together across channels suggests even less sensitivity to the vertical dimension, which might then spread to include ‘emotion’ as a non-differentiating strategy across topics as well. This would mean that the distinct topics all apply the emotion narrative strategy to a similar degree. Emotion might then be a reliable predictor of channel for our data but not a reliable predictor for topic.
The uses of the other presentational strategies all reveal significantly different patterns of usage for both channels and topics, but position these categories differently. Within their respective channels the videos with the topic ‘war’ all lie significantly more in the direction of increased ‘emotion’, ‘negative evaluations’, ‘self reference’, and ‘wallpapering’ than do the corresponding videos concerning Covid. Moreover, the channels differ from one another as groups as well. This demonstrates how the last two of the recurring challenges for multimodal analyses identified above are being met: we can see quite directly both internal and external diversity in the patterns of strategies used as well as groupings among these strategies precisely as targeted.
The results shown so far present diverse overviews of the data as collected and already bring out several reliable differences in how the strategies pattern across the two channels and the topics raised. But we can now also go further and produce models of the data that can be used for prediction as targeted by our first recurring challenge introduced above. For this, we can employ techniques such as generalised linear modelling to derive relationships between the occurrence or not of the nine individualisation strategies and an assignment to categories such as the channel involved or the topic discussed. Relationships of this kind constitute models that support prediction – for example, we can construct a model that allows us to predict for any combination of the nine individualisation strategies the channel that would be most likely to employ that combination; an informal description of this process for multimodal data is given by Bateman and Hiippala (2021); technical details of the approach are given by, for example, Baayen (2008).
Generalised linear models consist of a formula that takes a linear addition of coefficients derived for each of the variables serving as input to the model. In our case, these variables are the nine individualisation strategies. Producing a model means calculating the coefficients that result in the best prediction of an outcome variable, which in our current case will be taken to be the choice of one of the two channels. Each coefficient is also given an indication of the statistical significance of the value obtained: that is, the probability of the coefficient being equal to zero, i.e., having no effect. During modelling of this kind, therefore, some individualisation strategies might be found to make a statistically significant contribution to the prediction of channels and others not. Note that while the results for statistical significance reported above might already suggest to us just which of those strategies will be predictive, the statistical tests themselves do not directly provide such predictions. It is for this reason that it is often useful to explore more explicit modelling techniques.
The raw results of such a modelling process are summarised in the inset shown upper right in Figure 9. This inset reports raw coefficients produced by the linear modelling as well as the respective p-values assessing their statistical significance. As can be seen, several, but not all, of the strategies provide a statistically significant contribution to the prediction of channel. To make this more visible, the respective p-values were converted to an inverted scale and graphed in the bar-chart also shown in the figure. Each individualisation strategy consequently receives a direct indication of the significance of its contribution.[1] Individualisation strategies to the left of the dashed line on the bar-chart made a significant contribution; those to the right did not. In short, the model showed that the ‘wallpapering’ individualisation strategy was a very reliable indicator for the channel decision, followed by self-reference, negative evaluation, and so on. These results are similar in tenor to the direct significance tests shown in Figure 4 above but, in contrast to the simple occurrence data, are derived from a predictive model. This then goes beyond counting what we have found to making predictions concerning the role of various strategies for the different channels and, moreover, can be made to provide indications of the size of the individual strategies’ effects as well. The somewhat borderline position of the ‘emotion’ strategy mentioned above with respect to topics is also evident here, for example.

Summary of modelling results for predicting the channel according to the individualisation strategies selected. Generalized linear modelling performed with the lme4 R-package, cross-validation with the caret R-package, and the graph with the ggplot2 R-package.
A range of further well-known statistical techniques can be employed for making predictions of this kind. Some of the most widespread are ‘random forest’ classifications (Breiman 2001) and ‘conditional inference trees’ (Hothorn et al. 2015); both produce forms of decision trees which set out a hierarchically structured set of decisions that move from features of the data, in our case individualisation strategies, to decisions, i.e., selections of channel, topic, etc. With the random forest technique, we can also readily find just which individualisation strategies play the strongest role in the classification task. Since it is generally good practice to apply several such techniques to data to ensure that results are not being compromised by difficult to foresee mismatches between distributions in the data and the methods employed, to conclude this section we show briefly the results of both a random forest analysis of the data and a generated conditional inference tree – all again performed solely with respect to the original data collected as described in the previous section and using standard R libraries for processing and visualisation. Since, as we shall see, these techniques generally corroborate the observations made above, we can take this as further evidence for the accuracy of the results obtained overall.
The random forest procedure returns several forms of information. First, we can examine a confusion matrix that shows for the data analysed the number of cases that are correctly predicted and the number of cases which are incorrect. The confusion matrix for our data with the task of predicting which channel was involved is shown in Table 1. The cells of the matrix show correct predictions where the prediction matches the actual channel (lying on the diagonal of the matrix) and those cases where a mismatch indicates a wrong prediction (those cells lying off the diagonal). Here we can see that Bild TV was picked correctly in 87 cases and incorrectly in 9 cases, whereas Tagesschau was picked correctly in 66 cases and incorrectly in just 4 cases. This is therefore already quite accurate.
Confusion matrix for the prediction of channel on the basis of the nine individualisation strategies. Random forest calculations produced with the partykit R-package.
| Bild TV | Tagesschau | |
|---|---|---|
| Bild TV | 87 | 9 |
| Tagesschau | 4 | 66 |
The indication of relative importance of individualisation strategies delivered by the random forest calculation is measured in terms of the mean decrease in accuracy that accrues if a feature is omitted. This gives a similar but more refined view of the relative importance of the individualisation strategies suggested by our modelling above. The first three strategies are ordered as revealed before, but are then followed by ‘emotion’, ‘Putin’, and ‘protagonist’. This is in fact probably a more accurate ordering than relying on the relative statistical significance values as was done above.
Finally, we derive some conditional inference trees for our data for the same task of predicting, or deciding, which channel would be most likely given some selection of individualisation strategies. A resulting decision tree is shown in Figure 10. Here we see again the same primary individualisation strategies leading to particular likelihood for selection of channel; the probabilities given at each decision point are the Bonferroni-adjusted p-values appropriate at those nodes. The decision path shows that if we have wallpapering (>0), then there are no cases of Tagesschau to be expected; if there is no wallpapering, then the next decision point concerns self-reference, which also leads overwhelmingly to a Bild TV decision. Only with the next decision, negative evaluation, do we arrive at likely selections for Tagesschau and only if we do not have a negative evaluation (<=0).
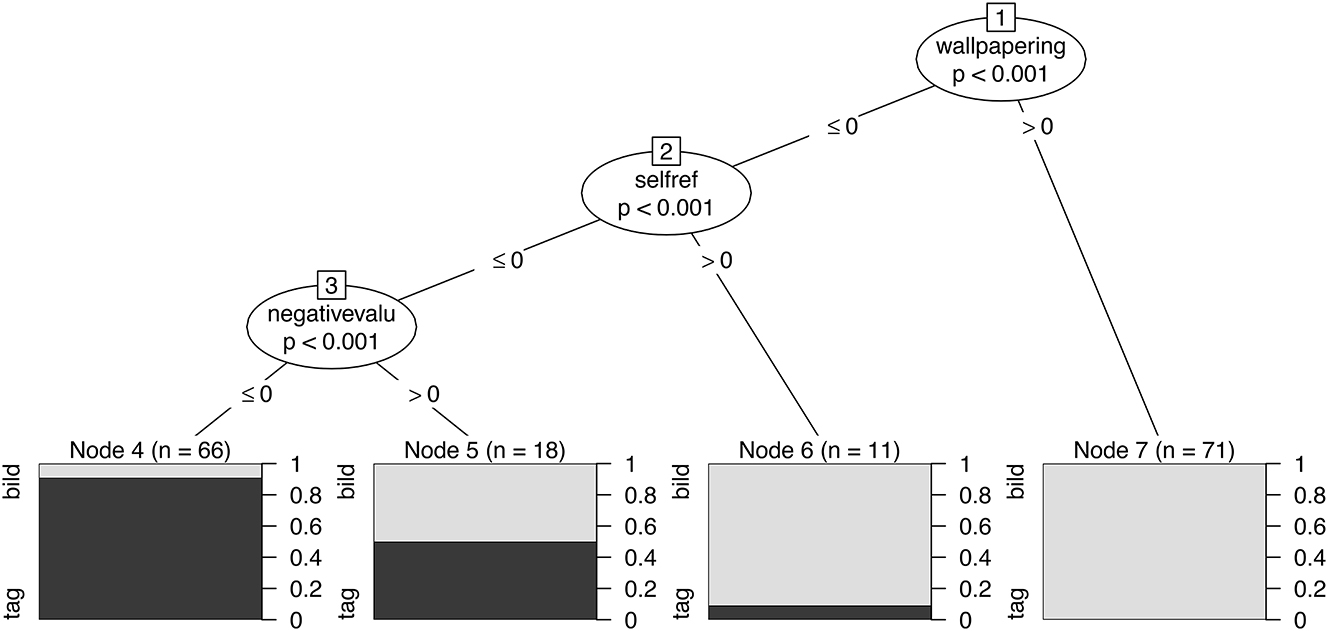
Decision tree for determining the channel given individualisation strategies. Tree calculated and plotted with the partykit R-package.
We can also examine the primary decision points related to the different topics by deriving decision trees in the same manner. In Figure 11, however, we do this for each of the two channels separately to see which of the individualisation strategies is most strongly indicative of the topic in each channel. The result is very clear: whereas the choice for Tagesschau is related to the individualisation strategy of ‘conflict’, with a positive selection of conflict leading unsurprisingly to the ‘war’ topic, for Bild TV the same choice between topics appears to be predicated solely on the use of the ‘Putin’ individualisation strategy, documenting a very different view on how these news events are being construed.

Decision trees for determining the topic for each channel (left: Tagesschau; right: Bild TV) given the individualisation strategies. Trees calculated and plotted with the partykit R-package.
4 Back to the data
As noted for the general challenges facing multimodality analyses set out in our introduction, the issue of scale demands that one is able to move beyond individual cases that might be used for illustrative discussion. Our analyses of the previous section show how it is possible to consider entire sets of data in order to reveal systematic patterns among that data along selected dimensions of comparison. It is then also possible to return to individual cases for discussion, but in a manner that is motivated by the similarities and contrasts revealed for the data set as a whole. This is useful because it means that, on the one hand, the consequences of analyses can be shown with concrete examples while, on the other hand, it can be guaranteed that those examples are, indeed, cases illustrating more general trends with some reliability.
As one very brief example of this, we can take the concrete news items that are maximally separated along one of the dimensions revealed by PCA as shown in Figures 6 and 7 above. This illustrates how we can ‘zoom in’ on particular facets of the data at will in order to understand more deeply the patterns being revealed. More specifically, Figure 12 shows how the generated PCA-dimensions serve to group individual videos scoring similarly with respect to their overall use of the presentational strategies analysed that lie at the extreme values of the derived dimensions. On the left of the figure, we see that there are in fact several groups of videos that have very low scores on the first PCA dimension while, on the right of the figure, we see a single group positioned as scoring the highest values on that dimension.

Zooming in on the maximum and minimum scoring videos in the data set according to the PCA analysis shown above.
Individual videos in the data set are named with a prefix showing the channel, a four digit identifier giving the date of transmission, plus an optional further disambiguating label if there were more than one transmission on the same date. Comparing then the original video ‘tag0123’ on the left-hand side with the original video ‘bild0127ukraine’ on the right-hand side allows us to illustrate the generalisations suggested above concretely in the data. The data entries for these two videos concerning their use of narrative strategies are given in Table 2; this shows the respective rows from the original table of binary values derived from the cohesion analysis used for the statistical evaluation of the data set as a whole. As explained above, the columns ‘Video’, ‘Channel’ and ‘topics’ took no part in the PCA and so the positioning of videos within the topological map formed by the PCA dimensions is derived solely on the basis of the narrative strategies employed.
Two rows extracted from the data analysis table corresponding to two videos positioned as maximally distinct from one another according to the PCA together with, for additional comparison, the results for the video used as our first cohesion example in Section 2 above.
| Video | Channel | Self | layp | CU | wallpap | emotion | negeval | confl | prot | putin | topics |
|---|---|---|---|---|---|---|---|---|---|---|---|
| tag0123 | tag | 0 | 0 | 1 | 0 | 0 | 0 | 0 | 1 | 0 | covid |
| bild0127ukraine | bild | 1 | 0 | 0 | 1 | 1 | 1 | 1 | 0 | 1 | war |
| ⋮ | |||||||||||
| bild0225kampf | bild | 1 | 0 | 1 | 1 | 1 | 1 | 1 | 0 | 1 | war |
Given these two videos’ positions at opposite ends of one of the derived PCA dimensions, it is unsurprising that the values for the strategies seen in the table are almost direct ‘opposites’ of one another in the sense that all but one of the adopted narrative strategies stand in complementary distribution; the only exception to this is the ‘layperson’ strategy, which neither video employs. The remaining strategies paint a picture of the Tagesschau not constructing cohesive chains indicative of emotion, negative evaluations, conflict, and self-representations, but reliance on protagonists. Wallpapering is not used. In contrast, the Bild TV video does exhibit cohesive chains constructing emotion, negative evaluations, and conflict, but does not use protagonists. Wallpapering and self-representations are also present. Figure 12 shows in addition the position of our first example video ‘bild0225kampf’ within the overall space (indicated by an arrow). This then also lies very close to the maximal value for PCA dimension 1 and so exhibits similar properties as evident from the table.
Finally, we can describe the two extreme videos in terms of their contents and organisation. The Tagesschau video reports on the results of one of the regularly occurring meetings between the German federal government and the individual states concerning decisions made concerning continuation of anti-Covid measures restricting contact at a variety of different kinds of events. Following a standard introduction sequence and welcome, the news anchor introduces the first topic verbally in a single shot lasting 27s. The topic is then developed in seven scenes spread over 18 shots, consisting of a general voice-over introduction, interviews with two politicians and an immunology expert, a close-up view of a planned decision document, presentation of a problem of too few getting vaccinated and too many tests being required, and a reporter’s summary of the situation. None of the scenes exhibit particular emotional engagement, the reports and reporters do not refer to themselves or the channel, there are no explicitly negative evaluations beyond setting out existing circumstances, and no events are presented as conflictual. Visually information is presented either with single protagonists being interviewed or with general background views with voice-overs. Taken together, this is quite prototypical of what is usually expected in Tagesschau reporting.
The report from Bild TV is very different. The main theme is how the ‘internet’ is responding to the war in Ukraine and consists of a very brief (6s) introduction of the topic, followed by a lengthy video critiquing Vladimir Putin produced by the cyberhacking group Anonymous (2:30s), and a walk-through of around a dozen postings on Twitter concerning suggestions and proposals either for exerting pressure on Russia or for supporting the Ukraine. All reports are rich in negative evaluations and the news presenter is placed explicitly as an active mediator between the Twitter posts and the viewers, reading selected posts and showing their selections visually. No actual protagonists appear, although there are sporadic references to Volodymyr Zelenskiy and other politicians within the Twitter segment. The visual design of the report employs split screens with wallpapering images and evaluative titles.
Although clearly distinguishable from the Tagesschau report, the individual details of this video are for our present purposes less important than the fact that this video contributes to an entire pattern of similarly narratively structured videos – i.e., those shown in the same vicinity within the PCA graph. By these means we abstract away from specific instances, which may, as in this case, offer quite idiosyncratic specific details of design, and show how an entire set of presentational strategies may serve to define clusters of news reporting styles that differentiate them effectively from other styles of news. Providing detailed descriptions of individual cases would not then be an effective approach for revealing broader multimodal patterns but, given the broader patterns, we are in a far better position to identify what precisely in any given video is contributing to a more generally applicable ‘style’ of reporting for some channel or topic.
5 Discussion, conclusion, and outlook
In this paper we have shown how we can enlarge the range of multimodal phenomena that can be considered in a detailed corpus-based analysis by defining a scheme of analysis that moves from raw data via discourse functional multimodal analysis through to bodies of data that can be subjected to a variety of statistical techniques for the identification of patterns in the data. This was applied to a particularly challenging area of investigation involving the kinds of narrative strategies employed in audiovisual newsreporting. This allowed us to differentiate among audiovisual news reporting channels according to the kinds of narrative strategies those channels employ in a rather more finely discriminating fashion than approaches employed previously.
In particular, we have pursued a complex, multi-category comparison of the opening segments from a corpus of Tagesschau and Bild TV news programmes, focusing on selected narrative strategies of individualisation. The analytical results complement previous research employing content analysis of sensationalist news properties (e.g., Vettehen et al. 2005, 2008) both by building an explicit link with a broader range of audiovisual features and by drawing on the occurrence of discourse patterns rather than counts of individual occurrences of items. The discourse cohesion structures produced consequently establish an analytic framework promising a robust basis for the empirical investigation of news reporting, comprehension, and interpretation more generally by focusing quite specifically on the construction of news as discourse as called for, for example, by Bednarek et al. (2021). However, in contrast to much previous discourse-oriented work where the focus has been primarily verbal, we can now enlarge the scope of discourse to be fully ‘multimodal’ as required.
Several authors have now argued that mathematical techniques of data summarisation and visualisation should find wider application in searching for patterns in complex communication data and, in linguistic corpus work, this has already become increasingly common. There have also been proposals made recently, particularly in the digital humanities, that this needs to be done for multimodal data as well so as to overcome previous over-fixations on ‘text’ in the more traditional sense of written language (cf. Arnold and Tilton 2019; Champion 2017; Melvin and Thomas 2020). Nevertheless, the kinds of features being extracted so far from multimodal data in the digital humanities have remained either low-level – e.g., brightness, movement, sound intensity, and so on – or restricted to classifications in terms of text labels or textual descriptions. We suggest here that moving the starting point of analysis directly to multimodally-construed discourse descriptions can make more incisive characterisations of complex audiovisual data available, which then in turn may be more revealing of fine-grained distinctions between styles of news reporting.
Setting out more of these discourse-oriented characterisations of news programming also offers a more solid foundation for discussion and critique when relating that programming to broader contextual considerations. The multimodal approach to news narrative strategies is highly relevant, for example, for the research area of news framing (Meier 2013; Pentzold et al. 2016; Scheufele 1999). The multimodal elements and their co-patternings in news videos in fact correspond well to many of the fundamental building blocks assumed for framing strategies and effects. For instance, the combinations of personalised, emotionalised, negatively evaluative narrative strategies uncovered in Bild TV correspond to the core components of ‘episodic news framing’ as described by Iyengar (1991). In future studies, therefore, it will be productive to examine how configurations of narrative strategies contribute to the construction of different types of news frames more explicitly (Tewksbury and Scheufele 2019). Our analysis of the Tagesschau and Bild TV data also revealed changes in narrative strategies over time, although the time periods examined were quite short and the data still too sparse for firmer discussion. Taking this further is nevertheless important because it is by no means the case that the reporting strategies employed verbally and those employed visually remain in an unchanging relationship to one another over time. As Jungblut and Zakareviciute (2019) show in their study of news reporting concerning the 2014 Israel-Gaza conflict, for example, it appeared that over time the verbally presented messages came more to focus on negotiation while the visually presented messages became more graphic and violent. Such ‘mixed messaging’ needs to be documented, which can again be approached in the terms of multimodal cohesive analysis by showing distinct sets of ‘non-interacting’ cohesive chains within the presentational modes deployed.
Finally, we see the move to a more discourse-oriented treatment of the audiovisual event of news reporting as critical for tracking narrative strategies that exhibit potentials for creating disinformation and unintended uncertainty. For example, our analytical results indicate that compared to Bild TV the individualisation strategies in Tagesschau are less interpretive and rarely evaluative. It may not always be advantageous, however, to avoid guiding viewers among possible interpretations or not to explicitly point out areas where interpretations are not yet available. This is particularly the case when dealing with news contents with high degrees of uncertainty, such as news about Covid-19. Leaving interpretation gaps for audiences who are not familiar with scientific uncertainty may well leave the door open to misuse. Such gaps can also evoke false equivalences in viewers’ perceptions of controversial issues. For example, it is well established that presenting topics in a discoursally-balanced fashion increases the likelihood that viewers will see those topics as equally valid even when they are not. Balance in reporting then actually becomes narratively biased. This is commonly described in terms of ‘false balance’ (Dearing 1995) and can be dangerously misleading (Imundo and Rapp 2022; Koehler 2016). A multimodal cohesion analysis would offer one way of characterising the narrative positions taken in such reporting in a sufficiently reliable fashion that comparisons, particularly of unintended or unwarranted ‘balance’, can be strengthened and explicitly shown.
To further all of these aims, our analyses of individualisation strategies need in the future to be combined with an increased range of narrative strategies, including strategies such as dramatisation or neutralisation. This will improve our ability to document how discourse-created uncertainty concerning controversial issues is handled across both public and private news channels. We also see this as a means to explore whether there are particular narrative strategies that are employed for the spread of disinformation. The analysis of narrative strategies may in particular reveal to what extent politically more extreme channels may rely more on emotionalised reports or whether they produce seemingly authoritative contents that are, nevertheless, replete with false information or deliberate discourse gaps that encourage inappropriate interpretations among their audiences. To make progress on these fronts, we see the incorporation of larger scale, but still discourse-oriented, explorations of the kind we have illustrated here as essential.
Funding source: Bundesministerium für Bildung und Forschung
Award Identifier / Grant number: 16KIS1515K
-
Research funding: This study was funded by Bundesministerium für Bildung und Forschung (16KIS1515K).
References
Adatto, Kiku. 1990. The incredible shrinking sound bite. New Republic 202. 20–23.Search in Google Scholar
Arbaoui, Bouchra, Knut De Swert & Wouter van der Berg. 2020. Sensationalism in news coverage: A comparative study in 14 television systems. Communication Research 47(2). 299–320. https://doi.org/10.1177/0093650216663364.Search in Google Scholar
Arnold, Taylor & Lauren Tilton. 2019. Distant viewing: Analyzing large visual corpora. Digital Scholarship in the Humanities 34(Suppl. 1). i3–i16. https://doi.org/10.1093/llc/fqz013.Search in Google Scholar
Aust, Charles & Dolf Zillmann. 1996. Effects of victim exemplification in television news on viewer perception of social issues. Journal of Mass Media and Communication Quarterly 73(4). 787–803. https://doi.org/10.1177/107769909607300403.Search in Google Scholar
Baayen, R. Harald. 2008. Analyzing linguistic data. A practical introduction to statistics using R. Cambridge: Cambridge University Press.10.1017/CBO9780511801686Search in Google Scholar
Baldry, Anthony & Paul J. Thibault. 2006. Multimodal Transcription and text analysis: A multimedia toolkit and coursebook with associated on-line course. Textbooks and surveys in linguistics. London and New York: Equinox.Search in Google Scholar
Baldry, Anthony P. 2004. Phase and transition, type and instance: Patterns in media texts as seen through a multimodal concordancer. In Kay L. O’Halloran (ed.), Multimodal discourse analysis: Systemic functional perspectives, open linguistics series, 83–108. London: Continuum.Search in Google Scholar
Bateman, John A. 2022. Growing theory for practice: Empirical multimodality beyond the case study. Multimodal Communication 11(1). 63–74. https://doi.org/10.1515/mc-2021-0006.Search in Google Scholar
Bateman, John A. & Tuomo Hiippala. 2021. From data to patterns: On the role of models in empirical multimodality research. In Jana Pflaeging, Janina Wildfeuer & John A. Bateman (eds.), Empirical multimodality research: Methods, evaluations, implications, 65–90. Berlin: de Gruyter.10.1515/9783110725001-003Search in Google Scholar
Baym, Geoffrey. 2004. Packaging reality: Structures of form in US network news coverage of Watergate and the Clinton impeachment. Journalism: Theory, Practice and Criticism 5(3). 279–299. https://doi.org/10.1177/1464884904044937.Search in Google Scholar
Bednarek, Monika, Helen Caple & Changpeng Huan. 2021. Computer-based analysis of news values: A case study on national day reporting. Journalism Studies 22(6). 702–722. https://doi.org/10.1080/1461670x.2020.1807393.Search in Google Scholar
Berning, Nora. 2011. Narrative means to journalistic ends: A narratological analysis of selected journalistic reportages. Wiesbaden: VS Verlag.10.1007/978-3-531-92699-5Search in Google Scholar
Bertin, Jacques. 1983. Semiology of graphics. Diagrams, networks, maps. Madison, WI: University of Wisconsin Press. Translated Sémiologie graphique (1967) by William J. Berg.Search in Google Scholar
Biber, Douglas. 1988. Variation across speech and writing. Cambridge: Cambridge University Press.10.1017/CBO9780511621024Search in Google Scholar
Breiman, Leo. 2001. Random forests. Machine Learning 45(1). 5–32. https://doi.org/10.1023/a:1010933404324.10.1023/A:1010933404324Search in Google Scholar
Caple, Helen, Monika Bednarek & Laurence Anthony. 2018. Using Kaleidographic to visualize multimodal relations within and across texts. Visual Communication 17(4). 461–474. https://doi.org/10.1177/1470357218789287.Search in Google Scholar
Champion, Eric Malcolm. 2017. Digital humanities is text heavy, visualization light, and simulation poor. Digital Scholarship in the Humanities 32(Suppl. 1). i25–i32.10.1093/llc/fqw053Search in Google Scholar
Ciula, Arianna & Øyvind Eide. 2017. Modelling in digital humanities: Signs in context. Journal of Digital Scholarship in the Humanities 32 (Suppl. 1). i33–i46. https://doi.org/10.1093/llc/fqx042.Search in Google Scholar
Cohen, Akiba A. & Itzhak Roeh. 1990. A five-version tale of one jeep, one Palestinian and two Israelis: Some secrets of TV news editing that only comparative viewing reveals. Feedback 31(3). 6–12.Search in Google Scholar
Dahlstrom, Michael F. 2014. Using narratives and storytelling to communicate science with nonexpert audiences. Proceedings of the National Academy of Sciences 111(Suppl. 4). 13614–13620. https://doi.org/10.1073/pnas.1320645111.Search in Google Scholar
Dearing, James W. 1995. Newspaper coverage of maverick science: Creating controversy through balancing. Public Understanding of Science 4(4). 341–361. https://doi.org/10.1088/0963-6625/4/4/002.Search in Google Scholar
Dunn, Anne. 2005. Television news as narrative. In Helen Fulton, Rosemary Huisman, Julian Murphet & Anne Dunn (eds.), Narrative and media, 140–152. Cambridge, UK: Cambridge University Press.Search in Google Scholar
Ekström, Mats. 2000. Information, storytelling and attractions: TV journalism in three modes of communication. Media, Culture & Society 22(4). 465–492. https://doi.org/10.1177/016344300022004006.Search in Google Scholar
Engebretsen, Martin & Wibke Weber. 2017. Graphic modes: The visual representation of data. In Colleen Cotter & Daniel Perrin (eds.), The Routledge handbook of language and media, 277–295. London & New York: Routledge.10.4324/9781315673134-21Search in Google Scholar
Fludernik, Monika. 1996. Towards a ‘natural’ narratology. London: Routledge.10.1515/jlse.1996.25.2.97Search in Google Scholar
Glasgow University Media Group. 1976. Bad news. London: Routledge and Kegan Paul.Search in Google Scholar
Grabe, Maria Elizabeth, Shushua Zhou & Brooke Barnett. 2001. Explicating sensationalism in television news: Content and the bells and whistles of form. Journal of Broadcasting & Electronic Media 45(4). 635–655. https://doi.org/10.1207/s15506878jobem4504_6.Search in Google Scholar
Graber, Doris A. 1994. The infotainment quotient in routine television news: A director’s perspective. Discourse & Society 5(4). 483–508. https://doi.org/10.1177/0957926594005004004.Search in Google Scholar
Gräf, Denis & Martin Hennig. 2020. Die Verengung der Welt Zur medialen Konstruktion Deutschlands unter Covid-19 anhand der Formate ARD Extra – Die Coronalage und ZDF Spezial, Researchgate, Universität Passau.Search in Google Scholar
Green, Melanie C., Jeffrey J. Strange & Timothy C. Brock (eds.). 2002. Narrative impact: Social and cognitive foundations. New York: Taylor & Francis.10.4324/9781410606648Search in Google Scholar
Griffin, Michael. 1992. Looking at TV news: Strategies for research. Communication 13. 121–141.Search in Google Scholar
Hasan, Ruqaiya. 1984. Coherence and cohesive harmony. In James Flood (ed.), Understanding reading comprehension: Cognition, language, and the structure of prose, 181–219. Newark, Delaware: International Reading Association.Search in Google Scholar
Hogan, Patrick Colm. 2011. Affective narratology: The emotional structure of stories. Lincoln: University of Nebraska Press.10.2307/j.ctt1df4gnkSearch in Google Scholar
Hothorn, Torsten, Hornik, Kurt & Zeileis, Achim. 2015. ctree: Conditional inference trees. The Comprehensive R Archive Network. https://cran.r-project.org/web/packages/partykit/vignettes/ctree.pdf.Search in Google Scholar
Imundo, Megan N. & David N. Rapp. 2022. When fairness is flawed: Effects of false balance reporting and weight-of-evidence statements on beliefs and perceptions of climate change. Journal of Applied Research in Memory and Cognition 11(2). 258–271. https://doi.org/10.1016/j.jarmac.2021.10.002.Search in Google Scholar
Iyengar, Shanto. 1991. Is anyone responsible? How television frames political issues. Chicago: University of Chicago Press.10.7208/chicago/9780226388533.001.0001Search in Google Scholar
Jewitt, Carey. 2017. Multimodal discourses across the curriculum. In Steven L. Thorne & Stephan May (eds.), Language, education and technology, volume 9 of Encyclopedia of language and education, 31–43, 3rd edn. Cham: Springer International Publishing.10.1007/978-3-319-02237-6_4Search in Google Scholar
Jungblut, Marc & Ieva Zakareviciute. 2019. Do pictures tell a different story? A multimodal frame analysis of the 2014 Israel-Gaza conflict. Journalism Practice 13(2). 206–208. https://doi.org/10.1080/17512786.2017.1412804.Search in Google Scholar
Kleemans, Mariska & Paul Hendriks Vettehen. 2009. Sensationalism in television news: A review. In Ruben Peter Konig, Paul Nelissen & Frank Huysmans (eds.), Meaningful media: Communication research on the social construction of reality, 226–243. Ubbergen, The Netherlands: Tandem Felix.Search in Google Scholar
Koehler, Derek J. 2016. Can journalistic ‘false balance’ distort public perception of consensus in expert opinion? Journal of Experimental Psychology: Applied 22. 24–38. https://doi.org/10.1037/xap0000073.Search in Google Scholar
Levshina, Natalia. 2015. How to do linguistics with R. Data exploration and statistical analysis. Amsterdam & Philadelphia: John Benjamins.10.1075/z.195Search in Google Scholar
Luginbühl, Martin. 2014. Genre profiles and genre change. The case of TV news. In Jannis Androutsopoulos (ed.), Mediatization and sociolinguistic change, 305–330. Berlin & New York: de Gruyter.10.1515/9783110346831.305Search in Google Scholar
Luginbühl, Martin & Jan Georg Schneider. 2020. Medial shaping from the outset: On the mediality of the second presidential debate, 2016. jfml: Journal für Medienlinguistik/Journal for Media Linguistics 3(1). 57–93. https://doi.org/10.21248/jfml.2020.34.Search in Google Scholar
Manning, Paul. 2001. News and news sources: The critical introduction. London: Sage.10.4135/9781446218082Search in Google Scholar
Manovich, Lev. 2008. Cultural analytics: analysis and visualization of large cultural datasets. Whitepaper from the Software Studies Initiative. Available at: http://softwarestudies.com/culturalanalytics/culturalanalytics2008.doc (accessed 11 October 2023).Search in Google Scholar
Manovich, Lev. 2012. How to compare one million images. In David M. Berry (ed.), Understanding digital humanities, 249–278. Basingstoke: Palgrave Macmillan.10.1057/9780230371934_14Search in Google Scholar
Meier, Stefan. 2013. Visual Framing als Stilpraxis multimodaler Bedeutungskonstruktion. In Stephanie Geise & Katharina Lobinger (eds.), Visual Framing: Perspektiven und Herausforderungen der Visuellen Kommunikationsforschung, 117–142. Köln: Herbert von Halem Verlag.Search in Google Scholar
Melvin Wevers & Thomas Smits. 2020. The visual digital turn: Using neural networks to study historical images. Digital Scholarship in the Humanities 35. 194–207. https://doi.org/10.1093/llc/fqy085.Search in Google Scholar
Moretti, Franco. 2005. Graphs, maps, trees: Abstract models for literary history. London & New York: Verso.Search in Google Scholar
Moretti, Franco. 2013. Distant reading. London & New York: Verso.Search in Google Scholar
O’Halloran, Kay L., Marissa, E & Sabine Tan. 2014. Multimodal analytics: Software and visualization techniques for analyzing and interpreting multimodal data. In Carey Jewitt (ed.), The Routledge handbook of multimodal analysis, 386–396, 2nd edn. London: Routledge.Search in Google Scholar
Pentzold, C., Vivien Sommer, Stefan Meier & Claudia Fraas. 2016. Reconstructing media frames in multimodal discourse: The John/Ivan Demjanjuk trial. Discourse, Context and Media 12. 32–39. https://doi.org/10.1016/j.dcm.2016.03.001.Search in Google Scholar
Philo, Greg (ed.). 1995. Glasgow media group reader, volume 2: Industry, economy, war and politics. London: Routledge.Search in Google Scholar
R Core Team. 2016. R: A language and environment for statistical computing. Vienna, Austria: R Foundation for Statistical Computing.Search in Google Scholar
Royce, Terry D. 2007. Intersemiotic complementarity: A framework for multimodal discourse analysis. In Terry D. Royce & Wendy L. Bowcher (eds.), New directions in the analysis of multimodal discourse, 63–110. Mahwah, NJ: Lawrence Erlbaum Associates.Search in Google Scholar
Ryan, Marie-Laure (ed.). 2004. Narrative across media: The languages of storytelling. Lincoln: University of Nebraska Press.Search in Google Scholar
Schaefer, Richard J. 1997. Editing strategies in television news documentaries. Journal of Communication 47(4). 69–88. https://doi.org/10.1111/j.1460-2466.1997.tb02726.x.Search in Google Scholar
Scheufele, Dietram A. 1999. Framing as a theory of media effects. Journal of Communication 49(1). 103–122. https://doi.org/10.1111/j.1460-2466.1999.tb02784.x.Search in Google Scholar
Smith, Murray. 1995. Engaging characters: Fiction, emotion, and the cinema. Oxford: Oxford University Press.Search in Google Scholar
Sniderman, Paul M., Michael G. Hagen, Philip E. Tetlock & Henry E. Brady. 1991. Reasoning chains. In Paul M. Sniderman, Richard A. Brody & Philip E. Tetlock (eds.), Reasoning and choice: Explorations in political psychology, 70–92. Cambridge, MA: Cambridge University Press.Search in Google Scholar
Sperry, Sharon Lynn. 1981. Television news as narrative. In Richard P. Adler (ed.), Understanding television: Essays on television as a social and cultural force, 295–312. New York: Praeger.Search in Google Scholar
Tewksbury, David & Dietram A. Scheufele. 2019. News framing theory and research. In Jenning Bryant & Mary Beth Oliver (eds.), Media effects: Advances in theory and research, chapter 2, 17–33. Taylor & Francis.10.4324/9780429491146-4Search in Google Scholar
Tseng, Chiao-I. 2013. Cohesion in film: Tracking film elements. Basingstoke: Palgrave Macmillan.10.1057/9781137290342Search in Google Scholar
Tseng, Chiao-I, Jochen Laubrock & John A. Bateman. 2021. The impact of multimodal cohesion on attention and interpretation in film. Discourse, Context & Media 44. aop. https://doi.org/10.1016/j.dcm.2021.100544.Search in Google Scholar
Tufte, Edward R. 1997. Visual explanations: Images and quantities, evidence and narrative. Cheshire, Connecticut: Graphics Press.Search in Google Scholar
Vettehen, Paul Hendriks, Koos Nuijten & Johannes Beentjes. 2005. News in an age of competition: The case of sensationalism in Dutch television news, 1995–2001. Journal of Broadcasting & Electronic Media 49. 282–295. https://doi.org/10.1207/s15506878jobem4903_2.Search in Google Scholar
Vettehen, Paul Hendriks, Koos Nuijten & Allerd Peeters. 2008. Explaining effects of sensationalism on liking of television news stories: The role of emotional arousal. Communication Research 35. 319–338. https://doi.org/10.1177/0093650208315960.Search in Google Scholar
Vogler, Christopher. 1998. The writer’s journey: Mythic structure for writers. Studio City, CA: Michael Wiese Productions.Search in Google Scholar
Wahl-Joergensen, Karin. 2016. Emotion and journalism. In Witschge, Tamara, Anderson, C. W., Domingo, David & Hermida, Alfred (eds.), The SAGE handbook of digital journalism, 128–144. Thousand Oaks, CA: SAGE Publications.10.4135/9781473957909.n9Search in Google Scholar
Wahl-Jorgensen, Karin & Schmidt, T. 2020. News and storytelling. In Wahl-Jorgensen, Karin & Hanitzsch, T. (eds.), Handbook of journalism studies, 2nd edn. 261–276. London: Routledge.10.4324/9781315167497-17Search in Google Scholar
Wickham, Hadley. 2016. ggplot2: Elegant graphics for data analysis. New York: Springer-Verlag.10.1007/978-3-319-24277-4_9Search in Google Scholar
Winter, Bodo. 2020. Statistics for linguists. An introduction using R. New York & London: Routledge.10.4324/9781315165547Search in Google Scholar
Wolf, Werner. 2007. Description as a transmedial mode of representation: General features and possibilities of realization in painting, fiction and music. In Werner Wolf & Walter Bernhart (eds.), Description in literature and other media, number 2 in studies in intermediality, 1–90. Amsterdam: Rodopi.10.1163/9789401205214_002Search in Google Scholar
Ytreberg, Espen. 2001. Moving out of the inverted pyramid: Narratives and descriptions in television news. Journalism Studies 2(3). 357–371. https://doi.org/10.1080/14616700118194.Search in Google Scholar
Zillmann, Dolf & Hans-Bernd Brosius. 2000. Exemplification in communication the influence of case reports on the perception of issues. London: Taylor & Francis.Search in Google Scholar
© 2023 the author(s), published by De Gruyter, Berlin/Boston
This work is licensed under the Creative Commons Attribution 4.0 International License.
Articles in the same Issue
- Frontmatter
- Research Articles
- Background check: cross-cultural differences in the spatial context of comic scenes
- Multimodal meaning-making in student presentations: the impact of explicit feedback in a German as a foreign language classroom
- (De-)Monstering COVID-19: a diachronic study of COVID-19 virus multimodal metaphors in Philippine editorial cartoons, 2019–2022
- Memes as multimodal ensemble
- Multimodal arguments: language, script, and politics
- Multimodal discourse analysis as a method for revealing narrative strategies in news videos