
Using ATLAS.ti for constructing and analysing multimodal social media corpora
-
Yuze Sha
 and
Beth Malory
and
Beth Malory


Abstract
Methods to enable comprehensive corpus analyses of multimodal data are imperative to furthering our understanding of social media and digital communication. In this study, we demonstrate how ATLAS.ti (version 24.2.0) can be used to construct such corpora and conduct corpus-assisted multimodal discourse analysis (CAMDA). The focus for such studies may be the exploration of complex patterns of co-occurrence, both intra- and inter-mode, or iterative corpus queries, especially when unexpected patterns move the research focus beyond initial research questions. In such cases, ATLAS.ti’s functionalities facilitate a triangulation of automatic pattern recognition and in-depth manual analysis. It supports a flexible, user-defined approach to the multimodal analysis of short-form social media datasets, overcoming traditional limitations such as analyses being restricted to emojis or preset thematic dimensions in current AI software. In this way, the proposed methodology enables in-depth CAMDA, as illustrated in the case study presented in this paper, which analyses the co-occurrences of evaluations and visual representations of social actors.
1 Introduction
This paper introduces a novel methodology for constructing, annotating, and analysing multimodal corpora in social media discourse using ATLAS.ti (version 24.2.0; ATLAS.ti 2024c). Originally designed for qualitative data analysis, we repurpose ATLAS.ti to demonstrate its effectiveness in the corpus-based analysis of multimodal short-form social media discourses. Its ability to map and visualize co-occurrences within and across modes, as well as its flexible query tools for multimodal datasets, distinguish it from traditional corpus analysis tools.
The following sections begin with a review of previous studies in multimodal corpus construction and analysis. We then provide a detailed overview of ATLAS.ti, outlining its application in building a multimodal corpus of social media data. Our methodology centres on four analytical functions: frequency analysis, co-occurrence analysis within and across modes (and its visualization with the force-directed graph capability), query tools, and multimodal concordance analysis. This helps us first identify quantitative patterns of features and variants in the corpus, then interpret them qualitatively, accounting for contextual factors (Baker and Egbert 2016).
We use a case study on the multimodal representation of #freerange on Twitter (Malory and Sha 2025) to showcase this approach. In presenting this case study, we aim to address common challenges in the multimodal corpus analysis of social media discourses, showcasing how ATLAS.ti can be a powerful tool for researchers in this field.
2 Corpus linguistics and multimodal social media discourse
Traditionally, corpus studies have focused primarily on monomodal linguistic datasets (e.g., Baker and McEnery 2005, 2015; Baker et al. 2008; Gillings et al. 2023). However, given that communication is inherently multimodal, restricting research to language-only corpora overlooks the distinctive contribution of each semiotic mode involved, as well as the interactions between modes. This oversight is highlighted by Caple (2018: 85) as a significant “blind spot” in corpus approaches to discourse studies.
In recent times, there has been a discernible trend towards attempting to integrate quantitative methods into multimodal discourse studies. Allwood (2008: 208) defines a multimodal corpus as a collection of language and communication materials accessible through computer-aided tools, encompassing various modes. Methodological experimentation in this field has expanded, ranging from manual to fully automated computerized analyses. The present study will focus on the multimodal construction and analysis of short-form social media corpora, which has previously been the focus of only a few studies (e.g., Christiansen et al. 2020; Collins 2020).
2.1 Multimodal corpus studies of social media discourse
Social media posts are inherently multimodal, combining semiotic resources such as emojis, memes, videos, and external links. Their diverse modes, shaped by platform-specific properties, have increasingly become the focus of many multimodal discourse studies in recent years (Bouvier and Machin 2020; Djonov and Zhao 2013). For example, Han and Zappavigna (2024) examined TikTok videos, conducting a qualitative analysis of rhythm across speech, bodily action, gesture, and music. Andersson (2024) employed a qualitative, social semiotic discourse analysis of YouTube reaction videos on transgender activism, demonstrating how the integration of different modes can express impoliteness towards non-targeted viewers. Both studies focus on video-based platforms; however, for social networking platforms such as Twitter and Instagram, most social media discourse studies emphasize images and written language in posts (Jovanovic and van Leeuwen 2018).
While research on social media discourse has grown, it remains largely divided into two methodological camps: qualitative (e.g., Chałupnik and Brookes 2022; Hansson and Page 2023; Jovanovic and van Leeuwen 2018; Ng 2018) and quantitative (e.g., Christiansen et al. 2020; Collins 2020) approaches, each with inherent limitations.
Quantitative or statistical methods, particularly those using computational tools like Google Cloud Vision (e.g., Christiansen et al. 2020), enhance efficiency when handling large datasets. However, these automated tools sometimes struggle to capture the nuance and granularity of visual expressions (Baker and Collins 2023). Also, though valuable for identifying large-scale patterns, purely quantitative approaches often overlook the intricate semantic and functional relationships across modes.
In contrast, qualitative discourse studies with human interpretation (e.g., Chałupnik and Brookes 2022; Ng 2018), as Christiansen et al. (2020) assert, remain crucial for understanding the complexities of multimodal social media content, especially for uncovering discourses not explicitly represented in language. However, purely qualitative multimodal discourse studies also present challenges. For instance, Widdowson (2000) highlights the potential for cherry-picking, where qualitative analysts selectively focus on atypical data to support preconceived arguments. Additionally, the manual analysis process often struggles to reveal cross-modal relationships across posts, limiting researchers’ ability to objectively identify prominent patterns.
Consequently, there is a clear need for research which combines the benefits of quantitative and qualitative methods for multimodal discourse analysis on social media. Quantitative methods can enhance pattern recognition and mitigate the risks of selective interpretation (Baker and Levon 2015). Such methods can reveal patterns in language use, especially co-occurrences, that may not be immediately evident to human intuition (Widdowson 2000). Meanwhile, qualitative methods allow exploration of the nuanced relationships across modes and facilitate interpretation of patterns within broader social, political, and cultural contexts in a way that is not possible using quantitative methods (Baker et al. 2008). Together, these approaches can offer a more comprehensive framework for understanding multimodal communication on social media platforms.
Efforts within corpus linguistics to study multimodal social media discourse are relatively new, and, to our knowledge, no corpus software has the capability yet to fully interpret multimodal data in the same way it handles linguistic monomodal data, for example by identifying co-occurring patterns and demonstrating associated concordances across different modes. Researchers have attempted to bridge this gap by adapting existing corpus tools, though these adaptations are mostly applicable to specific target semiotic resources, such as emojis, which are readable in some already existing linguistic corpus software (e.g., Sketch Engine). Some studies have encoded emojis with Unicode values to make them more machine-readable (e.g., Collins 2020; Zappavigna and Logi 2021); for instance, Collins (2020) focuses on emojis and images by converting emojis in Facebook posts to their Unicode values and categorizing images into predefined groups, enabling searches comparable to linguistic queries. Other approaches attempting to take account of multimodality, such as Bednarek and Caple’s (2017) research, combine results from separate corpus analysis of linguistic data and qualitative analysis of sampled visual data. The brevity of much social media data presents an additional challenge for traditional corpus software, since fragmented meaning-making units and contextual interpretations (Clarke 2022) necessitate a different approach than would be taken with traditional media discourses. This highlights the ongoing need for more advanced, integrated analysis tools and approaches capable of addressing the intricacies of multimodal social media data.
2.2 Introducing ATLAS.ti for multimodal corpus studies of social media discourse
To address the existing gaps in multimodal corpus studies of social media discourse, this paper introduces the application of ATLAS.ti (version 24.2.0), an interpretive piece of software originally developed for computer-assisted qualitative data analysis (CAQDAS) in 1993. Aligned with grounded theory principles, CAQDAS tools, such as ATLAS.ti, allow the iterative development of data categories (Page 2022), enabling more transparent, systematic, and replicable analytical processes (Woods et al. 2016).
ATLAS.ti (version 24.2.0) is available in both desktop (offline) and web (online) versions, with a feature comparison provided on the official website (ATLAS.ti 2024b). Researchers can access a free trial of the software, though continued use typically requires a paid licence. The software includes an inter-coder agreement mode to support collaboration among multiple users. Additionally, a technical document detailing ATLAS.ti’s concepts and functionalities is available to assist researchers with limited prior knowledge (ATLAS.ti 2024a).
ATLAS.ti has a strong track record of application in linguistic monomodal discourse and conversation studies (e.g., Friese et al. 2018; Karera et al. 2024; O’Halloran 2011; Potgieter 2014). Its reach also extends beyond linguistics to fields such as business strategy analysis; for example, Karera et al. (2024) used the software to conduct content analysis of semi-structured interviews with medical officers, and Potgieter (2014) applied it to summarize customer interaction strategies on social media in classroom settings. One of ATLAS.ti’s key advantages is its ability to incorporate multimodal datasets (Antoniadou 2017), which has led to its use in a limited number of qualitative multimodal discourse studies. For instance, Rossolatos (2014) employed ATLAS.ti (version 7) to analyse the multimodal rhetorical structure of TV advertisements. The researcher identified their minimal units of analysis (i.e., “ad filmic segments”) by focusing on five groups of pro-filmic elements, such as actors, setting changes, and slogans, which were then coded for rhetorical figures. However, given the comparatively limited capacity of ATLAS.ti at that time, the summary replied primarily on descriptive statistics (e.g., frequency), and the segmentation process presented some challenges, particularly regarding the overlap of some coded elements – for example, setting changes and slogans – within the timeline.
In contrast, ATLAS.ti (version 24.2.0) is particularly well suited for analysis of data from text-and-image-based social media platforms. The short-form nature of posts, often limited by character constraints, allows researchers to treat each post as a discrete analytical unit. This enables ATLAS.ti’s functionalities to be applied in constructing and analysing multimodal social media texts, much like in monomodal corpus studies. Researchers can use these functionalities to identify both intra- and inter-mode co-occurrences, which can then be systematically traced, visualized, and analysed both quantitatively and qualitatively (as detailed in Sections 3 and 4).
Despite its potential, the use of ATLAS.ti for short-form multimodal social media discourse studies is still in its infancy. Most studies have focused on monomodal data, such as the linguistic analysis of blogs (Paulus and Lester 2014), or traditional content analysis methods like theme identification in tweets about parks during COVID-19 (Choe et al. 2022). This highlights the need for a more comprehensive, multimodal analytical framework for social media discourse analysis with ATLAS.ti.
ATLAS.ti (version 24.2.0) has introduced new features such as concept cloud generation, opinion mining, sentiment analysis, and AI-based summaries. While these tools offer valuable insights, especially for large-scale pattern recognition, our pilot study revealed that they may not yet be robust enough to fully replace human interpretation or advanced natural language processing methods. For this reason, the present study does not rely on these automatic features but instead emphasizes the interpretive potential of ATLAS.ti in combination with manual analysis.
This paper aims to demonstrate how ATLAS.ti can be applied to construct and analyse multimodal corpora of social media discourse. The case study focuses on the multimodal representation of #freerange on Twitter over a six-month period (Malory and Sha 2025). The topic has gained prominence amid growing public concern in the UK about animal welfare and ethical consumption (RSPCA 2022), particularly in debates surrounding the ethics and transparency of free-range farming practices (Lekakis 2022).
The case study addresses three research questions.
How is #freerange usually represented – as food products or as animals?
How are associated social actors and free-range methods appraised?
How does appraisal differ across tweeter identities?
We will outline the data collection process and provide a detailed description of the corpus construction in the methodology section. Following this, we will introduce four functionalities for conducting corpus-assisted multimodal discourse analysis (CAMDA) using ATLAS.ti. This paper focuses on demonstrating the application of ATLAS.ti’s functionalities for constructing and analysing multimodal corpora, highlighting their methodological value. For practical details of the software, such as operational steps and interface navigation, readers are encouraged to refer to the comprehensive manual available on the official ATLAS.ti website (ATLAS.ti 2024b).
3 Methodology
3.1 Data collection
The multimodal tweet dataset for (Malory and Sha 2025) was collected using Twitter’s Advanced Search function. The focus was on English-language tweets containing the hashtag #freerange within the period from 1 January 2022 to 1 June 2022. Data collection took place in July 2022, with January–June 2022 chosen as the period of focus due to an uptick in public debate about the ethics of free-range farming during the ongoing outbreak of avian flu affecting the UK (Race 2022). Increased discussion of free-range agriculture during this period, including on Twitter, provided valuable multimodal data for trialling the methodological protocol with ATLAS.ti outlined in this paper. Using a Google Chrome extension called Twitter Media Downloader, we extracted both the tweet text and associated multimodal elements. During this process, the text, along with metadata such as usernames and the number of likes, was automatically saved in an Excel file. Other semiotic resources, including images and videos, were automatically downloaded in bulk and saved to a local folder. Following a manual review to filter out tweets irrelevant to the research focus, 1,003 tweets were retained.
As we were interested in comparisons across different tweeter identities, we further refined the dataset by retaining only tweets that could be categorized as commercial (primarily promoting products for financial gain), institutional (focused on animal rights advocacy), or personal accounts (lacking any discernible commercial or ethical affiliations). These classifications were inferred from the users’ profile details and the content of their posts. However, it is important to acknowledge the limitations of this categorization method, especially in the case of personal accounts where profiles may be fictitious or misleading. As a result, additional exclusions of ambiguous cases were made, ultimately resulting in a final corpus of 899 tweets.
3.2 Constructing a multimodal corpus on ATLAS.ti
The initial step in constructing the corpus was uploading and setting up the target multimodal tweets. Importing the Twitter data as “surveys” allows researchers to select and retain metadata for analysis, such as Username, Tweet Content, and URLs. Once uploaded, each tweet is treated as an individual document within the ATLAS.ti project.
In the examined dataset, 94.22 % of the tweets are multimodal, incorporating semiotic resources such as text, emojis, emoticons, memes, videos, external links, and retweets. This high proportion highlights the importance of retaining multimodal features for social media studies.
Of these semiotic resources, text and emojis are directly displayed in the tweet cases. For other semiotic resources like memes, photos, and external links, the network function in ATLAS.ti allows for the linking of these resources within the same tweet. This enables the cohesive presentation of all semiotic resources on a single page, as demonstrated in Figure 1. To facilitate this, these external semiotic resources need to be uploaded into the corpus using the Add Documents function and then linked to the corresponding tweet content (see Figure 1 for the multimodal page view for a tweet case).
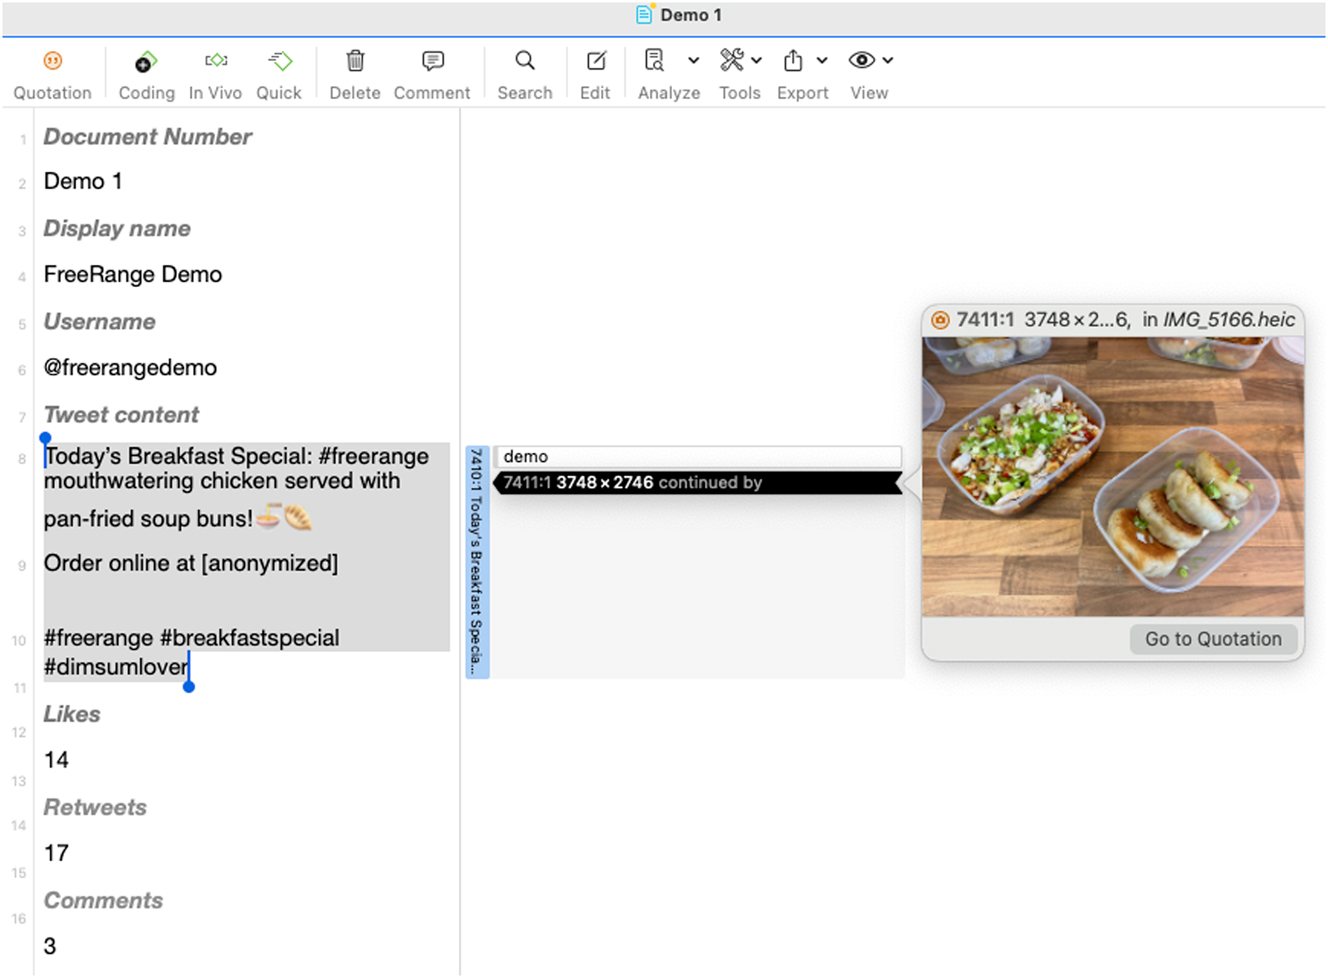
Page view for a tweet case.
Videos present a unique challenge compared to other semiotic resources, primarily due to the labour-intensity associated with their analysis. For this study, we adopted a strategy of capturing screenshots from the initial meaning-making unit of each video. This is the frame most platform users see before interacting with the video, allowing us to analyse the videos as static images. Additionally, we carefully watched each video in full to ensure that no potential meaning conflicts, such as instances of irony, were missed.
3.3 Annotating multimodal corpora on ATLAS.ti
Since analysis and interpretation in ATLAS.ti rely on the “codes” (i.e., annotations) assigned to the data, the second step involves annotating the target corpus. Researchers have two options for this process. The first is the semi-automated “intentional AI coding”, which allows users to assign coding tasks based on their research questions. However, for CAMDA, this method is currently only suitable for simple tasks such as detecting specific words or summarizing general themes.
The second option is manual coding, which we employed in the present study. Manual coding provides researchers with greater flexibility to develop a coding scheme that aligns more with their specific research questions, rather than being restricted by the limitations of the software’s analytical capabilities. The annotation process was conducted by the first author, with the second author reviewing the codes to ensure plausibility.
To address the research question “How does appraisal differ across tweeter identities?”, we categorized user identities based on the criteria outlined in Section 3.1, classifying them into commercial, institutional, and personal accounts.
For the research question “How are associated social actors and free-range methods appraised?”, we coded the tweets according to the appraisal strategies employed, with a particular focus on the Attitude dimension of Martin and White’s (2005) Appraisal Framework (see Figure 2).
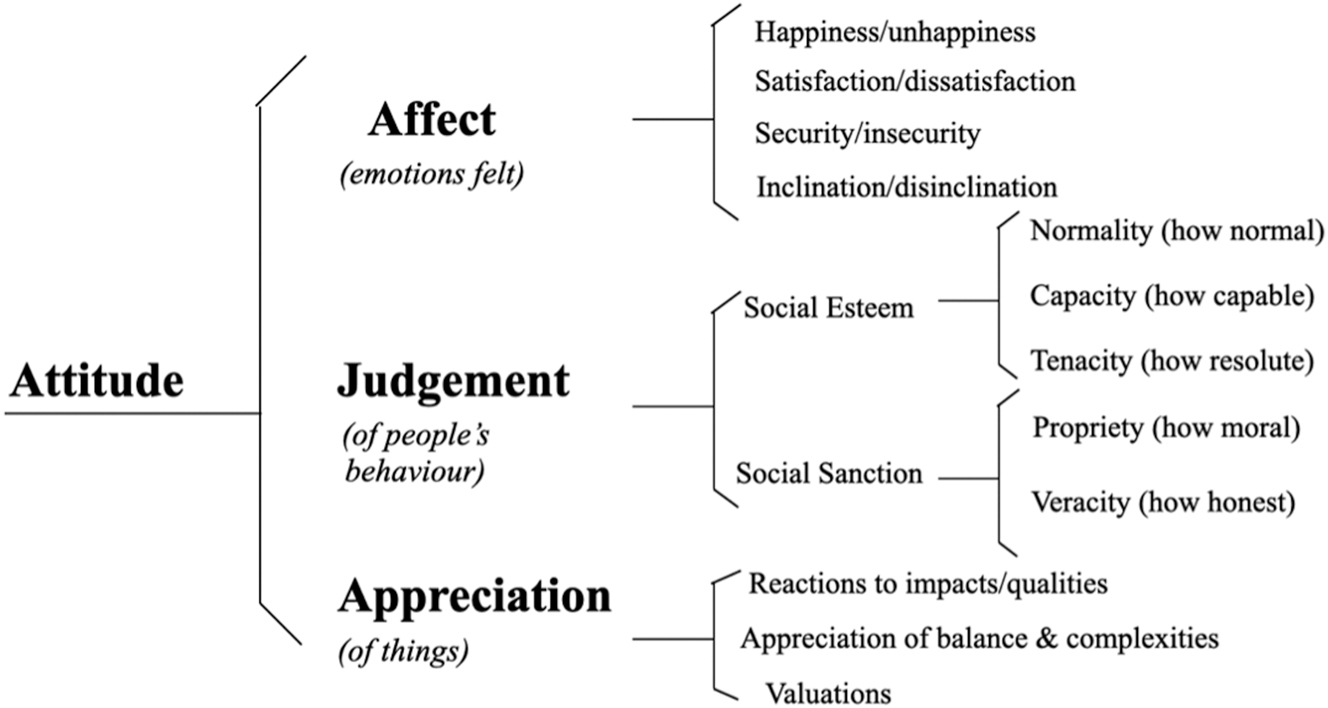
An overview of the attitude dimension in appraisal framework (Martin and White 2005).
The Attitude coding involves not only the appraisal categories following a threefold structure, such as [Appreciation-quality-positive] for example (1), but also identifying the ideation (Inwood and Zappavigna 2024) or subjects of these attitudes (e.g [free-range food] for (1)). This allowed us to also address the first research question, which is to determine whether #freerange is usually represented as food products or as animals in the tweets.
Today’s Breakfast Special: #freerange mouthwatering chicken served with pan-fried soup buns |
| Order online at [anonymized] |
| #freerange #breakfastspecial #dimsumlover |
 |
Additionally, we focused on the cross-modal synergy between appraisal strategies and social actor representations. Using a data-driven approach, we coded the visual representations of social actors into five categories [free-range-few], [free-range-flock], [human commercial], [human consumer], and [human raiser]. This addresses the visual mode’s prominent influence on audience perception, as evidenced by eye-tracking experiments (Garcia and Stark 1991; Holmberg 2004). Specifically, such studies demonstrate that visual elements not only capture initial attention but also sustain the viewer’s gaze for longer periods.
4 Analytical methods for CAMDA on ATLAS.ti
Gillings et al. (2023) classify (monomodal linguistic) corpus-assisted discourse studies into two prototypical approaches, depending on whether corpus linguistics or discourse studies takes the lead. In the first approach, corpus linguistics drives the analysis by producing results that discourse studies then interprets through detailed textual analysis, contextualizing them within historical, sociocultural, and political frameworks. In the second approach, corpus linguistics assesses the typicality across larger corpora of what discourse studies first identifies in a small set of texts.
Our analysis of multimodal social media discourse follows the first approach, utilizing ATLAS.ti’s functionalities, such as (1) frequency analysis, (2) code co-occurrence analysis, and (3) the query tool, to initially identify statistically (non-)salient patterns. Researchers then analyse the associated (4) multimodal concordances and relate them to broader contexts for interpretation.
While the detailed discourse analysis is not as prominent here, this brevity is intentional, as the primary focus of this paper is methodological, that is, demonstrating the application of CAMDA using ATLAS.ti through a case study. The discursive aspect is explored more thoroughly in Malory and Sha (2025). Here, however, our aim is to demonstrate the methodology itself.
4.1 Frequency analysis
In terms of frequency analysis, ATLAS.ti generates automatic statistics following the coding process, which can be accessed via the Quotation Manager.
To illustrate its utility, we summarize the results on the visual representations of #freerange social actors in Figure 3, including free-range food (PA-Food), a few free-range animals (PA-FR few), and flocks of free-range animals (PA-FR flock). A comparison of tweeter identities reveals that #freerange is predominantly depicted as food across all three user groups. Furthermore, Figure 3 shows that commercial accounts are more inclined to use visual representations of free-range food in their posts, compared to institutional and individual accounts.
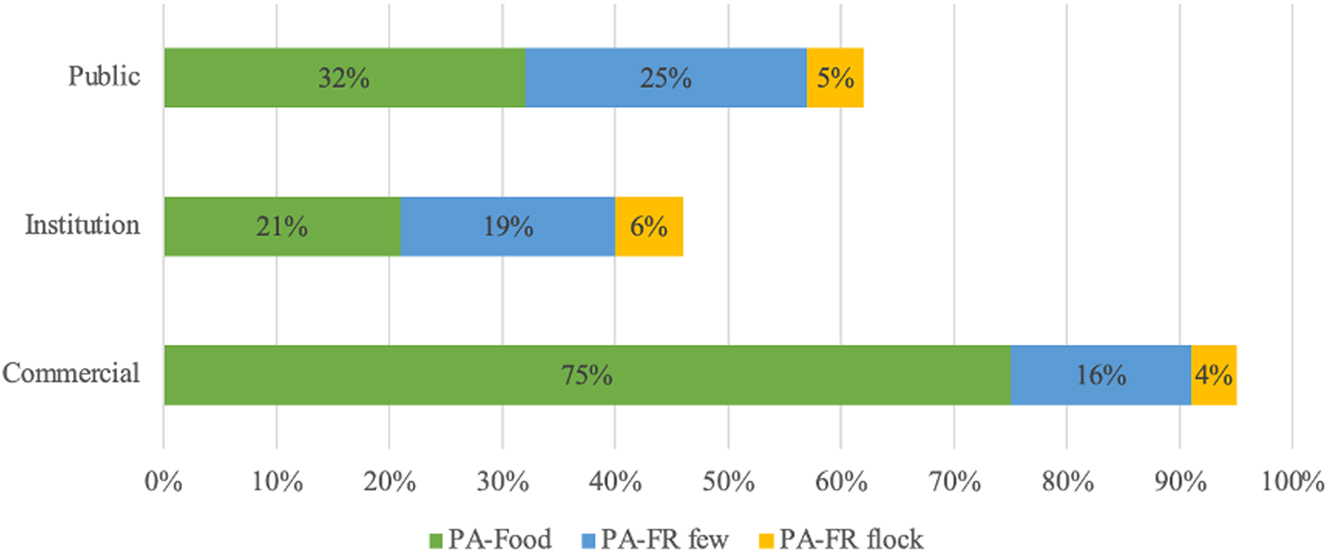
Frequency of visual representations of #freerange (by user identity).
4.2 Code co-occurrence analysis and associated multimodal concordances
4.2.1 Code co-occurrences and extended concordances
Code co-occurrence analysis enables the examination of co-occurring patterns of researcher-designed codes, such as themes, social actor representation strategies, and appraisal strategies in the present study, both within and across modes.
In addition to raw numbers of co-occurrences, ATLAS.ti also provides the co-occurrence coefficient, which is represented by the formula c = n12 ÷ (n1 + n2 − n12), where n12 is the number of times two codes co-occur, and n1 and n2 are the occurrences of each individual code. The coefficient c indicates varying degrees of co-occurrence between the two codes. A value closer to 1 suggests a stronger association, with the codes frequently appearing together, while a value closer to 0 indicates a weaker relationship.
One illustration of code co-occurrence analysis can be found in Figure 4, which shows the strengths of co-occurring patterns between visual representations of #freerange social actors and the attitudes expressed in the corresponding tweets.
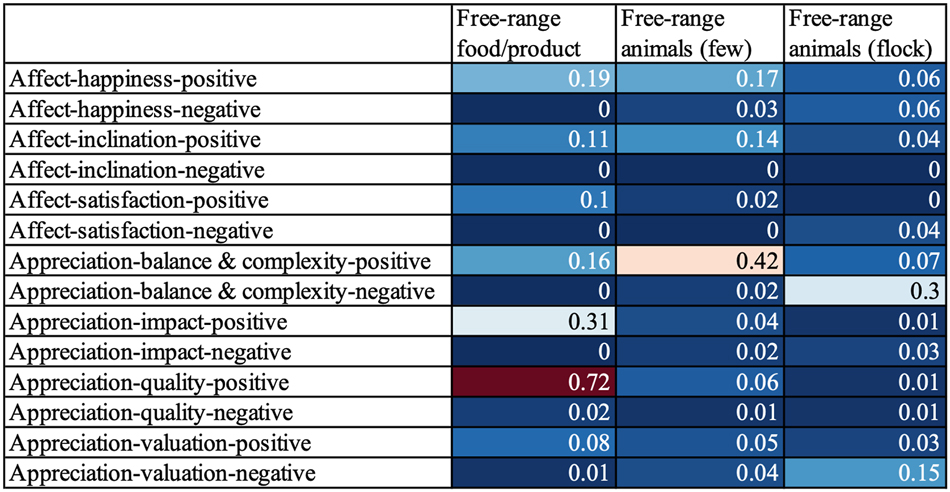
Coefficients between visual representations of #freerange social actors and appraised attitudes.
The disparities among the appraisal of the three #freerange social actor categories are evident in the results shown in Figure 4. Firstly, tweets featuring visual representations of free-range food or products predominantly align with positive attitudes. The strongest association is observed in the co-occurrence coefficient of 0.72 between visual representations of free-range food or products and the appraisal of positive quality ([Appreciation-quality-positive]).
The differences become more intricate when considering the visual representations of free-range animals. Here, a critical distinction emerges between tweets depicting a few individual animals ([Free-range animals (few)] in Figure 4) versus those showcasing a flock ([Free-range animals (flock)]). Tweets representing a small number of animals generally convey positive sentiments, as indicated by a co-occurrence coefficient of 0.42 with the positive appraisal of balance and complexity (i.e [Appreciation-balance & complexity-positive]). In contrast, tweets portraying a flock of animals tend to express more negative appraisal, demonstrated by a notable co-occurrence coefficient of 0.30 with the [Appreciation-balance & complexity-negative] code.
Nevertheless, an inherent limitation of the coefficient and similar metrics is their susceptibility to distortion from disparate code frequencies. To guide researchers in identifying significant relationships that might otherwise be overlooked due to imbalanced application frequencies of codes, ATLAS.ti incorporates a visual cue: a yellow dot in the top right corner of the table cell. This marker appears when one code in a pair has been applied more than five times as frequently as its counterpart. This indicator prompts a closer examination of the co-occurrences within that cell (for details, see ATLAS.ti 2024a).
Once (non-)salient co-occurrence patterns have been identified, researchers can click on the corresponding co-occurrence columns, where ATLAS.ti displays the relevant “quotations” (i.e., concordances) of these co-occurrences on the right-hand side (see Figure 5). This structured page view largely resembles the concordance functionality in monomodal linguistic corpus software. It also enables researchers to closely examine the multimodal contexts of target patterns, as well as the associated contextual factors of each concordance, such as engagement metrics and user account details (see Figure 1). The short-form nature of tweets, due to the character limit, makes them suited for multimodal concordance analysis, with each tweet functioning as its own concordance.
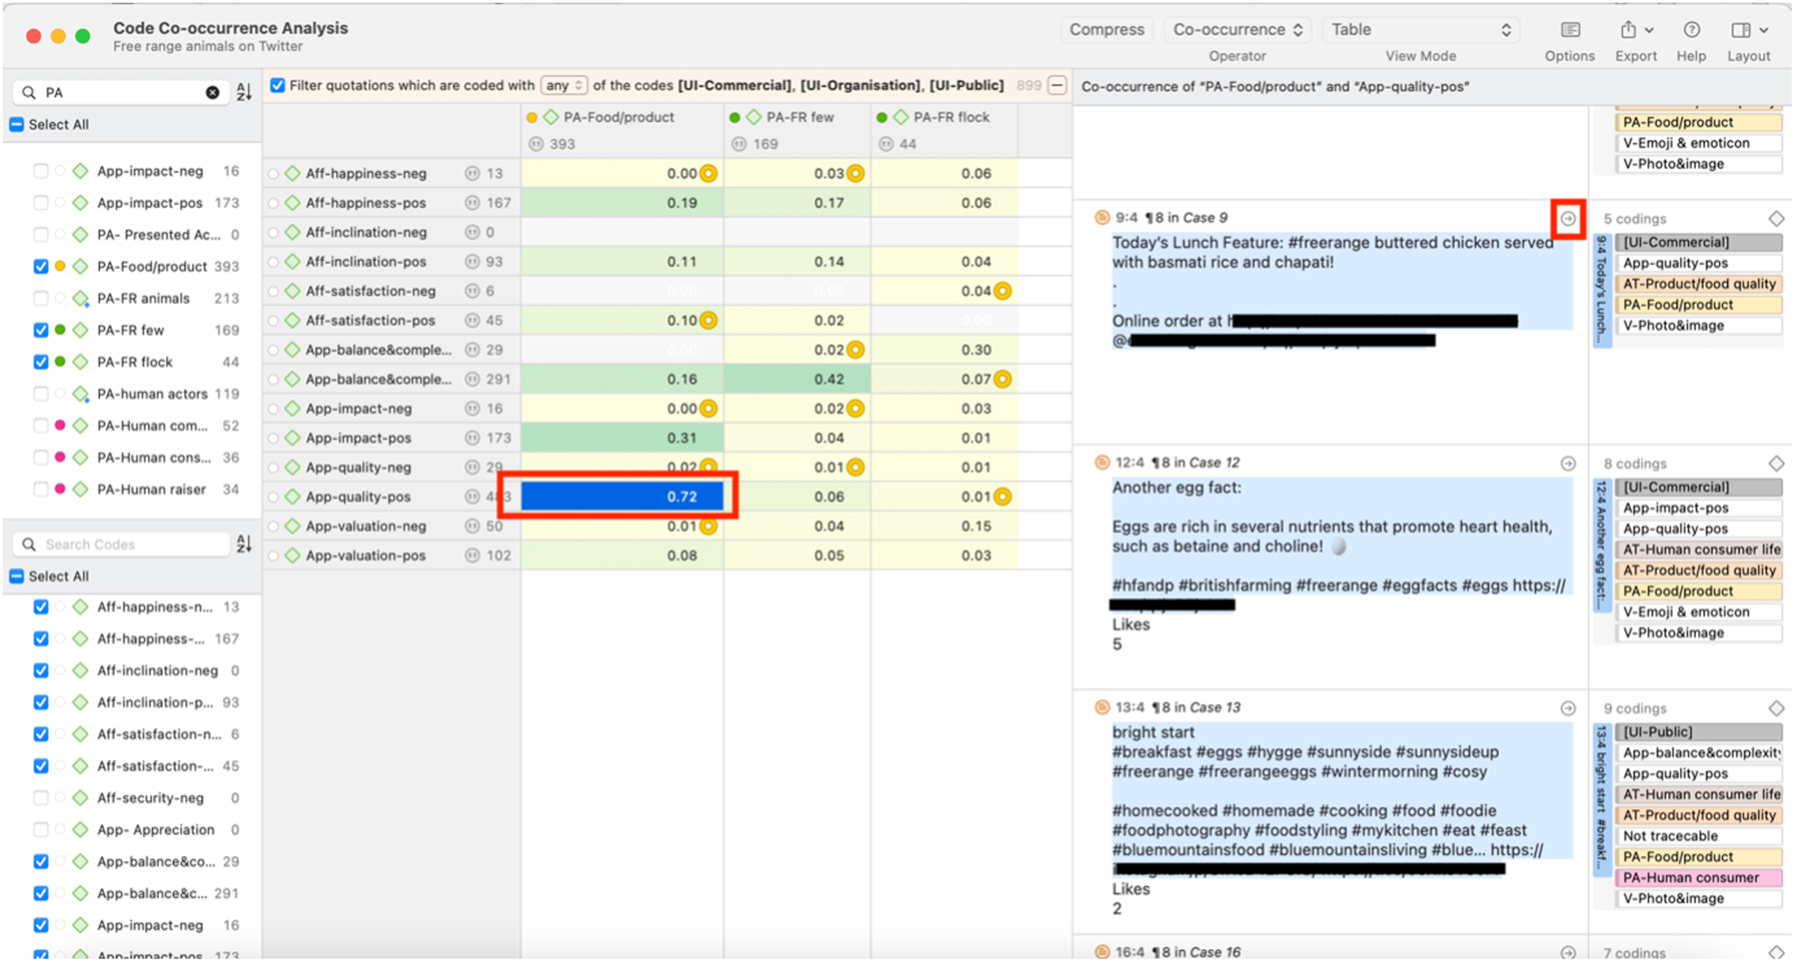
Code co-occurrence analysis and corresponding concordances.
4.2.2 Visualization
One of the strengths of ATLAS.ti in CAMDA is its visualization capabilities. One such visualization tool is the force-directed graph, which enables graphic representation of inter-code relationships. This method employs three elements to convey information: size of node, indicating the frequency of a code within the corpus, and length and thickness of the connecting lines, where shorter, thicker lines indicate a higher coefficient and therefore stronger co-occurrence between codes. The corresponding multimodal concordances for these co-occurrences are also traceable, with a page view similar to that shown in Figure 5.
This visualization reveals the web of co-occurring relationships, uncovering patterns that might otherwise remain hidden. We now employ Figure 6, which shows the co-occurrence patterns across the appraised subjects in the corpus, to demonstrate the utility of force-directed graphs. The prominence of the “Food/product quality” node in Figure 6 highlights the evaluations of free-range food and products being the most frequent within the corpus. In contrast, the smallest “Human commercial lifestyle” node suggests its infrequent appearance in the evaluations. As previously outlined, the length and thickness of the lines in the figure illustrates the strength of co-occurrences between nodes. The shortest and thickest line, linking “Food/product quality” and “Human consumer lifestyle”, indicates that these subjects are frequently evaluated together in the tweets. There are also notable connections between “Animal lifestyle” and “Food/product quality”, as well as between “Animal lifestyle” and “Human consumer lifestyle” in Figure 6. However, some nodes remain disconnected, indicating a lack of co-occurrence among them within the dataset. For instance, the absence of a line between “Policy & implementation” and “Human raiser lifestyle” indicates that the associated evaluations never co-occur in the analysed corpus.
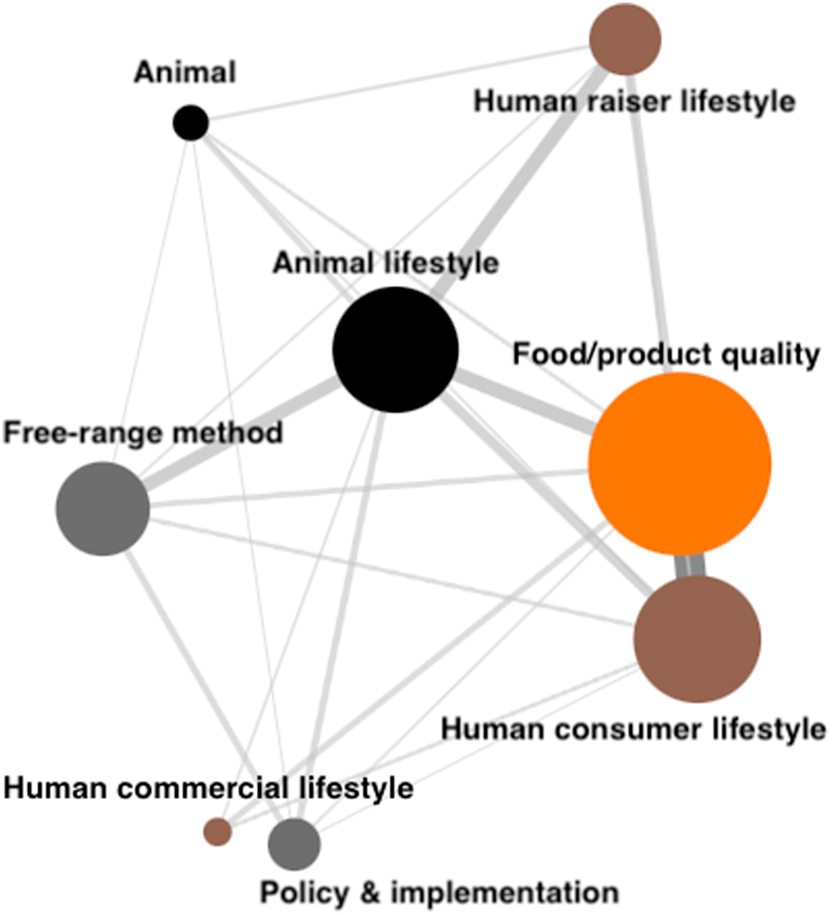
Co-occurring patterns across appraised subjects.
4.3 The query tool
The third functionality is the query tool, which can be used to filter concordances based on specific code (non-)co-occurrences. This tool is especially useful for further investigating particular (multimodal) discursive patterns within the corpus, or when unexpected patterns emerge that extend beyond the initial research questions, as is common in corpus studies (Gillings et al. 2023). Similar to the code co-occurrence analysis page view (see Figure 5), it also directs researchers to the corresponding concordances in detail and enables in-depth analyses of the patterns.
For instance, the code co-occurrence analysis summarized in Figure 6 reveals frequent pairwise co-occurring patterns across three subjects: animal lifestyle, food/product quality, and human consumer lifestyle. This prompted us to further investigate cases where these appraised subjects co-occur, especially in tweets from commercial accounts, and to explore whether causative links or sequential occurrences are represented.
We set the query tool and qualitatively analysed the 15 cases that met the criteria, and found that 66.67 % suggested a causal relationship; wherein a balanced and harmonious animal lifestyle is portrayed as directly contributing to high-quality food, which, in turn, is implied to support an environment- and health-conscious consumer lifestyle. Example 2 is a self-created instance to demonstrate this pattern (while ensuring compliance with copyright considerations). The example opens by emphasizing the well-being of the sheep, personifying them as “fluffy friends” and ascribing human emotions, “Happy sheep”, in the text. The portrayal of the animals’ lifestyle, via descriptions like “wandering through their snowy paradise”, is positive, whilst the accompanying non-linguistic semiotic resource, a photo which shows sheep walking in a snow-covered landscape, further implies ease and leisure. The focus then shifts to food quality, with the emojis  and the hashtag #farmfresh implying a direct link between the sheep’s welfare and production of meat and cheese that is superior. Finally, the hashtags #sustainablefood and #lowfoodmiles tie this narrative to sustainable practices, highlighting reduced environmental impact and connecting animal welfare to the environmentally conscious and health-oriented lives of consumers.
 Happy sheep wandering through their snowy paradise Happy sheep wandering through their snowy paradise  #farmfresh #happysheep #freerange #sustainablefood #lowfoodmiles #farmfresh #happysheep #freerange #sustainablefood #lowfoodmiles |
5 Conclusions
In this paper, we have outlined a novel approach to constructing and analysing multimodal corpora of short-form social media discourses using ATLAS.ti. For multimodal corpus construction, ATLAS.ti facilitates the integration of multimodal elements from social media platforms, enabling the demonstration of multimodal concordances within single page views, along with broader contextual information, such as engagement metrics and user details.
For CAMDA, we have demonstrated how ATLAS.ti’s functionalities – that is, frequency analysis, code co-occurrence analysis (including visualization), and the query tool – can be utilized to identify (non-)salient patterns of mono- and multi-modal code (non-)co-occurrences. These tools provide a macroscopic view of the corpus while addressing the critical challenge of understanding the strength and the underlying reasons for patterns of cross-modal co-occurrences. As illustrated, force-directed graphs and other visualization tools enhance this analytical process by providing intuitive representations of complex patterns.
The potential of ATLAS.ti for CAMDA is further demonstrated by its ability to provide easy access to multimodal concordances through the page views associated with each analysis function. This enables a detailed examination of the co-occurrence patterns within each concordance. Additionally, the contextual information available on the page view is valuable for conducting in-depth analyses of the concordances.
Working with ATLAS.ti for CAMDA does present certain challenges, primarily related to the investment of time required for corpus construction and annotation. Factors such as the coder’s familiarity with the software and the coding scheme for their research can influence the pace of work considerably. In our pilot study of 50 tweets, the initial stage of corpus construction and coding averaged approximately 5 min per tweet, as we were still familiarizing ourselves with the process. However, this pace accelerated significantly during the main study due to increased familiarity with the tools, and a structured scheme can lead to greater efficiency in subsequent phases.
To address these challenges, researchers may find it beneficial to start with a pilot study using a smaller but representative data sample, to become acquainted with the software and refine the details of the coding scheme. Further streamlining of the process can be facilitated by pre-organizing media files to align with their corresponding text files (e.g., through consistent naming conventions) and by utilizing ATLAS.ti’s bulk document upload feature. Additionally, the Quotation Manager page provides a structured overview and simplifies linking and tracking processes. For corpus annotation, implementing a tiered coding scheme, such as the threefold structure used in this study (see Section 3.3), can greatly enhance both organization and efficiency.
As illustrated in the case study presented in this article, the triangulation approach of integrating ATLAS.ti’s functionalities, such as the automatic quantification of mono- and multi-modal (non-)co-occurrences, with detailed, qualitative manual analysis of the associated concordances, enables the identification of patterns that might otherwise have gone unnoticed. In this case study, examples include tweeters’ preference for visually representing #freerange with food rather than animals, as well as the causal relationships underlying commercial accounts’ positive evaluations of #freerange, specifically progressing from animal lifestyle to food quality and, ultimately, to human consumer lifestyle. In this way, by utilizing ATLAS.ti for CAMDA, this methodology provides a meaningful contribution to advancing research in the field.
References
Allwood, Jens. 2008. Multimodal corpora. In Anke Lüdeling & Merja Kytö (eds.), Corpus linguistics: An international handbook, 207–225. Berlin: Mouton de Gruyter.Search in Google Scholar
Andersson, Marta. 2024. Multimodal expression of impoliteness in YouTube reaction videos to transgender activism. Discourse, Context & Media 58. https://doi.org/10.1016/j.dcm.2024.100760.Search in Google Scholar
Antoniadou, Victoria. 2017. Collecting, organizing and analyzing multimodal data sets: The contributions of CAQDAS. In Emilee Moore & Melinda Dooly (eds.), Qualitative approaches to research on plurilingual education, 435–450. Dublin, Ireland: Research-publishing.net.10.14705/rpnet.2017.emmd2016.640Search in Google Scholar
ATLAS.ti. 2024a. ATLAS.ti 24 User manual. Berlin: ATLAS.ti Scientific Software Development GmbH. https://manuals.atlasti.com/Mac/en/manual/Intro/IntroductionPreface.html (accessed 3 February 2025).Search in Google Scholar
ATLAS.ti. 2024b. ATLAS.ti feature comparison. Berlin: ATLAS.ti Scientific Software Development GmbH. https://atlasti.com/feature-comparison (accessed 3 February 2025).Search in Google Scholar
ATLAS.ti. 2024c. ATLAS.ti Mac (version 24.2.0) [Qualitative data analysis software]. Berlin: ATLAS.ti Scientific Software Development GmbH. https://atlasti.com.Search in Google Scholar
Baker, Paul & Luke Collins. 2023. Creating and analysing a multimodal corpus of news texts with Google Cloud Vision’s automatic image tagger. Applied Corpus Linguistics 3(1). https://doi.org/10.1016/j.acorp.2023.100043.Search in Google Scholar
Baker, Paul & Jesse Egbert. 2016. Triangulating methodological approaches in corpus linguistic research. London: Routledge.10.4324/9781315724812Search in Google Scholar
Baker, Paul & Erez Levon. 2015. Picking the right cherries? A comparison of corpus-based and qualitative analyses of news articles about masculinity. Discourse & Communication 9(2). 221–236. https://doi.org/10.1177/1750481314568542.Search in Google Scholar
Baker, Paul & Tony McEnery. 2005. A corpus-based approach to discourses of refugees and asylum seekers in UN and newspaper texts. Journal of Language and Politics 4(2). 197–226. https://doi.org/10.1075/jlp.4.2.04bak.Search in Google Scholar
Baker, Paul & Tony McEnery. 2015. Who benefits when discourse gets democratised? Analysing a twitter corpus around the British benefits street debate. In Paul Baker (ed.), Corpora and discourse studies: Integrating discourse and corpora, 244–265. London: Palgrave Macmillan.10.1057/9781137431738_12Search in Google Scholar
Baker, Paul, Costas Gabrielatos, Majid Khosravinik, Michał Krzyżanowski, Tony McEnery & Ruth Wodak. 2008. A useful methodological synergy? Combining critical discourse analysis and corpus linguistics to examine discourses of refugees and asylum seekers in the UK press. Discourse & Society 19(3). 273–306. https://doi.org/10.1177/0957926508088962.Search in Google Scholar
Bednarek, Monika & Helen Caple. 2017. Introducing a new topology for (multimodal) discourse analysis. In Phil Chappell & John S. Knox (eds.), Transforming contexts: Papers from the 44th international systemic functional congress, 19–25. Wollongong: 44th ISFC Organising Committee.Search in Google Scholar
Bouvier, Gwen & David Machin. 2020. Critical discourse analysis and the challenges and opportunities of social media. In Susana Guillem & Christopher Toula (eds.), Critical discourse studies and/in communication, 39–53. New York: Routledge.10.4324/9781003050353-3Search in Google Scholar
Caple, Helen. 2018. Analysing the multimodal text. In Charlotte Taylor & Anna Marchi (eds.), Corpus approaches to discourse: A critical review, 85–109. Abingdon: Routledge.10.4324/9781315179346-5Search in Google Scholar
Chałupnik, Małgorzata & Gavin Brookes. 2022. Discursive acts of resistance: A multimodal critical discourse analysis of all-Poland women’s strike’s social media. Gender and Language 16(3). 308–333.10.1558/genl.20148Search in Google Scholar
Choe, Yunseon, Jiyoon Lee & Gyehee Lee. 2022. Exploring values via the innovative application of social media with parks amid COVID-19: A qualitative content analysis of text and images using ATLAS.ti. Sustainability 14(20). https://doi.org/10.3390/su142013026.Search in Google Scholar
Christiansen, Alex, William Dance & Alexander Wild. 2020. Constructing corpora from images and text. In Sofia Rüdiger & Daria Dayter (eds.), Corpus approaches to social media, 149–174. Amsterdam: John Benjamins.10.1075/scl.98.07chrSearch in Google Scholar
Clarke, Isobelle. 2022. A multi-dimensional analysis of English tweets. Language and Literature 31(2). 124–149. https://doi.org/10.1177/09639470221090369.Search in Google Scholar
Collins, Luke. 2020. Working with images and emoji in the dukki Facebook corpus. In Sofia Rüdiger & Daria Dayter (eds.), Corpus approaches to social media, 175–196. Amsterdam: John Benjamins.10.1075/scl.98.08colSearch in Google Scholar
Djonov, Emilia & Sumin Zhao. 2013. From multimodal to critical multimodal studies through popular discourse. In Emilia Djonov & Sumin Zhao (eds.), Critical multimodal studies of popular discourse, 13–26. London: Routledge.10.4324/9780203104286-7Search in Google Scholar
Friese, Susanne, Jacks Soratto & Denise Pires. 2018. Carrying out a computer-aided thematic content analysis with ATLAS.ti. Göttingen: Max Planck Institute for the Study of Religious and Ethnic Diversity (MMG Working Paper 18-02).Search in Google Scholar
Garcia, Mario & Pegie Stark. 1991. Eyes on the news. St. Petersburg, FL: Poynter Institute.Search in Google Scholar
Gillings, Mathew, Gerlinde Mautner & Baker Paul. 2023. Corpus-assisted discourse studies. Cambridge: Cambridge University Press.10.1017/9781009168144Search in Google Scholar
Han, Joshua & Michele Zappavigna. 2024. Multimodal rhythm in TikTok videos: Exploring a recontextualization of the Gillard “misogyny speech”. Multimodality & Society 4(1). 58–79. https://doi.org/10.1177/26349795231207228.Search in Google Scholar
Hansson, Sten & Ruth Page. 2023. Legitimation in government social media communication: The case of the Brexit department. Critical Discourse Studies 20(4). 361–378. https://doi.org/10.1080/17405904.2022.2058971.Search in Google Scholar
Holmberg, Nils. 2004. Eye movement patterns and newspaper design factors: An experimental approach. Lund: Lund University Master’s thesis. https://lup.lub.lu.se/luur/download?func=downloadFile&recordOId=1328870&fileOId=1328871 (accessed 3 February 2025).Search in Google Scholar
Inwood, Olivia & Michele Zappavigna. 2024. The legitimation of screenshots as visual evidence in social media: YouTube videos spreading misinformation and disinformation. Visual Communication. Advance online publication https://doi.org/10.1177/14703572241255664.Search in Google Scholar
Jovanovic, Danica & Theo Van Leeuwen. 2018. Multimodal dialogue on social media. Social Semiotics 28(5). 683–699. https://doi.org/10.1080/10350330.2018.1504732.Search in Google Scholar
Karera, Abel, Penelope Engel-Hills & Davidson Florence. 2024. Radiology image interpretation services in a low-resource setting: Medical doctors’ experiences and the potential role of radiographers. Radiography 30(2). 560–566. https://doi.org/10.1016/j.radi.2024.01.009.Search in Google Scholar
Lekakis, Eleftheria. 2022. Consumer activism: Promotional culture and resistance. London: Sage.10.4135/9781529782929Search in Google Scholar
Malory, Beth & Yuze, Sha. 2025. Ethical consumerism or symbolic capitalism? Public multimodal evaluations of #freerange on twitter. Unpublished manuscript.Search in Google Scholar
Martin, James R. & Peter R. White. 2005. The language of evaluation, vol. 2. New York: Palgrave Macmillan.Search in Google Scholar
Ng, Chi Wei. 2018. Critical multimodal discourse analyses of news discourse on Facebook and YouTube. Journal of Asia TEFL 15(4). 1174–1185. https://doi.org/10.18823/asiatefl.2018.15.4.22.1174.Search in Google Scholar
O’Halloran, Kieran. 2011. Investigating argumentation in reading groups: Combining manual qualitative coding and automated corpus analysis tools. Applied Linguistics 32(2). 172–196. https://doi.org/10.1093/applin/amq041.Search in Google Scholar
Page, Ruth. 2022. Analyzing multimodal interactions in social media contexts. Research methods for digital discourse analysis, 159–176. London: Bloomsbury Academic.Search in Google Scholar
Paulus, Trena & Jessica Lester. 2014. Using ATLAS.ti for a discourse analysis study of blogging in an educational context. In Susanne Friese & Thomas Ringmayr (eds.), ATLAS.ti user conference 2013: Fostering dialog on qualitative methods. Berlin: Universitätsverlag der TU Berlin.Search in Google Scholar
Potgieter, Andrea. 2014. Learning through teaching: ATLAS.ti and social media. In Susanne Friese & Thomas Ringmayr (eds.), ATLAS.ti user conference 2013: Fostering dialog on qualitative methods. Berlin: Universitätsverlag der TU Berlin.Search in Google Scholar
Race, Michael. 2022. Free-range eggs no longer available in UK due to bird flu. BBC News 21 March. https://www.bbc.co.uk/news/business-60820595.Search in Google Scholar
Rossolatos, George. 2014. Conducting multimodal rhetorical analysis of TV ads with Atlas.ti 7. Multimodal Communication 3(1). 51–84. https://doi.org/10.1515/mc-2014-0004.Search in Google Scholar
RSPCA. 2022. Animal kindness as part of our values. https://www.rspca.org.uk/whatwedo/latest/kindnessindex/report (accessed 3 Febraury 2025).Search in Google Scholar
Widdowson, Henry. 2000. On the limitations of linguistics applied. Applied Linguistics 21(1). 3–25. https://doi.org/10.1093/applin/21.1.3.Search in Google Scholar
Woods, Megan, Trena Paulus, David Atkins & Rob Macklin. 2016. Advancing qualitative research using qualitative data analysis software (QDAS)? Reviewing potential versus practice in published studies using ATLAS.ti and NVivo, 1994–2013. Social Science Computer Review 34(5). 597–617. https://doi.org/10.1177/0894439315596311.Search in Google Scholar
Zappavigna, Michele & Lorenzo Logi. 2021. Emoji in social media discourse about working from home. Discourse, Context & Media 44. https://doi.org/10.1016/j.dcm.2021.100543.Search in Google Scholar
© 2025 the author(s), published by De Gruyter, Berlin/Boston
This work is licensed under the Creative Commons Attribution 4.0 International License.