Comparison of electrical conductivity and freezing point methods for urine osmolality measurement and the influence of urinary biochemical parameters
-
Kübranur Ünal

 ,
Murat Alışık
,
Mehmet Alp Sert
and
Mehmet Emre Erol
,
Murat Alışık
,
Mehmet Alp Sert
and
Mehmet Emre Erol

Abstract
Objectives
To evaluate the analytical performance of the Sysmex UF-5000 (electrical conductivity) and OSMOMAT 3000 basic (freezing point) devices for urine osmolality measurement and to investigate the influence of urinary biochemical parameters on the trueness of conductivity-based measurements.
Methods
A total of 210 urine samples were collected from outpatients and analyzed for osmolality using both devices. Urinary concentrations of creatinine, urea, glucose, calcium, potassium, sodium, chloride, total protein, and microalbumin were measured. Precision, trueness, method comparison, and the impact of biochemical parameters were assessed according to CLSI EP05-A3 and EP09-A3 guidelines. Statistical analyses included Spearman’s correlation, Passing–Bablok regression, Bland–Altman plots, and multiple regression analyses to identify predictors of osmolality.
Results
Both methods demonstrated high repeatability, with total %CV values below 14.2 %. Trueness (%bias) was 7.5 % for Sysmex UF-5000 and 7.1 % for OSMOMAT 3000. No significant difference was observed between median osmolality values (563.5 vs. 541 mOsm/kg, p=0.348). Correlation between devices was strong (Spearman’s rho (ρ)=0.93, p<0.01) and regression analyses indicated that sodium, potassium, calcium, and creatinine significantly influenced osmolality results for both devices. Glucose, urea, and microalbumin had negligible effects on electrical conductivity-based measurements.
Conclusions
Electrical conductivity may serve as a practical approach for estimating urine osmolality in comparison with the freezing point method, while ionic composition and pH-dependent charged species can still influence particular samples.
Introduction
Urinalysis has become a frequently requested test today due to its accessibility and the valuable information it provides. Its demand continues to rise, as it is used not only for evaluating urinary tract pathologies but also for monitoring systemic diseases affecting the urinary system. To address this growing demand, manufacturers of fully automated urine analysers have started to incorporate novel parameters into urinalysis, alongside the traditional ones (pH, specific gravity, erythrocytes, leukocytes, nitrite, protein, glucose, ketone, urobilinogen, and urine sediment analysis), to enhance the detection and monitoring of pathologies [1]. In this context, some fully automated urine analysers can also measure urine osmolality in the tested samples.
Osmolality is the total number of solute particles dissolved in 1 kg of solvent [2]. Urine osmolality plays an important role not only in the diagnosis of disorders associated with impaired renal concentrating ability due to kidney damage but also in conditions related to hormonal dysregulation that alter urine concentration [3], 4]. In addition to its use in diagnosis and differential diagnosis, urine osmolality is also used to assess adequate fluid intake. It serves as a risk factor in the prognosis of chronic kidney disease [5], 6]. However, inaccurate urine osmolality measurements may result in misdiagnosis, inappropriate treatment, or delays in the diagnostic and therapeutic processes. Therefore, measurement techniques employed for urine osmolality and the factors that may affect these methods are essential for ensuring reliable results.
Several methods based on the colligative properties of fluids, such as vapour pressure, boiling point, freezing point, and osmotic pressure, are employed for osmolality measurement [7]. Osmometers utilizing these methods are less commonly available in clinical laboratories than routine urinalysis and biochemistry analysers [8]. Moreover, the need for consumable materials in osmolality measurement poses an additional limitation [2]. Consequently, osmolality calculation formulas have been developed for situations where direct measurement is not feasible [7], 9]. However, significant discrepancies between calculated and measured osmolality values limit the applicability of these formulas [10], 11]. Thus, there remains a need for methods that can provide accurate osmolality results in clinical laboratories without requiring additional consumables or equipment.
Osmolality can also be assessed by the electrical conductivity method, which is predicated on the principle that ions dissolved in a solution contribute to its electrical conductivity. A significant advantage of this technique is its compatibility with integration into fully automated urinalysis platforms. Given its broad accessibility and the absence of additional consumable requirements, this method has recently attracted attention as a potential alternative to classical colligative property-based osmometry [12], 13]. Nevertheless, the factors that may influence urine osmolality results obtained by this method have not yet been fully elucidated.
In the present study, we sought to evaluate the analytical performance of two distinct systems: The Sysmex UF-5000 (Sysmex Corporation, Kobe, Japan), a fully automated urine sediment analyser equipped with an electrical conductivity module, and the OSMOMAT 3000 basic (Gonotec, Berlin, Germany), which operates on the freezing point depression principle. Additionally, we aimed to investigate the extent to which various urinary molecules (total protein, creatinine, microalbumin, urea, glucose, calcium, potassium, sodium, and chloride) may affect the trueness of electrical conductivity-based osmolality measurements.
Materials and methods
Study design and ethics
This study was conducted in accordance with the Declaration of Helsinki and was approved by the Non-Interventional Clinical Research Ethics Committee of Abant İzzet Baysal University (Decision No. 2025/271, dated June 17, 2025). All participants were fully informed about the study procedures, and written informed consent was obtained from each participant prior to inclusion in the study.
A total of 210 urine samples were collected from patients referred to the outpatient clinics of Gazi University Faculty of Medicine Hospital and transferred to our laboratory for routine urinalysis. Urine sediment analysis was performed using the Sysmex UF-5000 device, and the urine osmolality results generated by the instrument were recorded. On the same day, the urine osmolality of the same samples was also assessed using the Gonotec Osmomat 3000 basic device. Total protein, creatinine, urea, glucose, calcium, potassium, sodium, and chloride were also measured using the Siemens ADVIA Chemistry XPT System (Siemens Healthcare, Berlin, Germany). Microalbumin was measured using the Siemens Atellica Neph 630 analyzer.
Measurement of urine osmolality
The Sysmex UF-5000 device assesses urine osmolality based on the electrical conductivity method. This method operates on the principle that ionized solutes contribute to electrical conductivity. Therefore, correction factors are applied when non-ionic solutes are present, as they also affect osmolality [14]. The Gonotec Osmomat 3000 basic device measures urine osmolality using the freezing point depression method. In this method, the sample is cooled, and the freezing temperature is measured. As the concentration of dissolved solutes increases, the freezing point decreases. Thus, osmolality is determined by exploiting one of the solution’s colligative properties. The freezing point method remains the most widely used technique for osmolality measurement in clinical laboratories [15]. The assigned values (290.0 for osmometer and 500.0 for Sysmex) were those provided by the manufacturer for the respective reference solutions at the concentration levels tested. Therefore, different assigned values were used since the reference targets were not the same across the measurement systems.
Measurement of urinary biochemical parameters
Urine glucose (measured using the glucose oxidase method), protein (pyrogallol red-molybdate colorimetric method), creatinine (Jaffe method), urea (urease and glutamate dehydrogenase method), calcium (Arsenazo III colorimetric method), potassium (indirect ion-selective electrode, ISE), sodium (indirect ISE), and chloride (indirect ISE) were measured using the Siemens ADVIA Chemistry XPT System autoanalyzer. Microalbumin was measured by nephelometry using the Siemens Atellica Neph 630 analyzer. All measurements were performed with the original reagents provided by the manufacturer.
Statistical analysis and method comparison
Precision evaluation and method comparison were performed according to CLSI EP05-A3 and EP09-A3 guidelines. Statistical analyses were conducted using SPSS version 18.0 (IBM Corporation, NY, USA). Standard deviation (SD) and coefficient of variation (%CV) were calculated for precision assessment. For trueness evaluation, the %bias was used. The comparison of osmolality results obtained by the Sysmex UF-5000 and the Gonotec Osmomat 3000 basic was performed using the Wilcoxon signed-rank test. The relationship between the two devices was analysed using Spearman’s correlation coefficient and the Passing–Bablok linear regression equation. Bland–Altman plots were used to visualize the differences between the two devices. Multiple regression analysis was applied to evaluate the effects of biochemical parameters on the measurement methods. A p-value <0.05 was considered statistically significant.
Results
The precision of the Sysmex and Osmometer methods was evaluated across four control levels by assessing within-run, between-run, within-day, and between-day variability, as well as total within-laboratory variability. The results are summarized in Table 1. Within-run precision for the Sysmex device exhibited %CV values ranging from 0.3 to 7.8 %, whereas the osmometer demonstrated %CV values between 0.7 and 9.4 %. Between-run precision for Sysmex showed %CV values up to 0.2 %, while the osmometer displayed %CV values up to 7.8 %. Within-laboratory precision ranged from 0.3 to 7.8 % (%CV) for Sysmex and 0.7–12.4 % for the osmometer.
Precision analysis of Sysmex and Osmo methods across control levels.
| Precision | Sysmex | Osmometer | |||||||
|---|---|---|---|---|---|---|---|---|---|
| 1. Level | 2. Level | 3. Level | 4. Level | 1. Level | 2. Level | 3. Level | 4. Level | ||
| Mean | 170.8 | 919.9 | 1,527 | 3,205.3 | 121.3 | 513.4 | 871.3 | 2048.4 | |
| Repeatability (within run) | SD | 13.3 | 4.2 | 4.4 | 35.7 | 11.3 | 11.9 | 28.1 | 14 |
| %CV | 7.8 | 0.5 | 0.3 | 1.1 | 9.4 | 2.3 | 3.2 | 0.7 | |
| Between-run | SD | 0.0 | 2 | 0 | 0 | 9.5 | 0 | 0 | 0 |
| %CV | 0.0 | 0.2 | 0 | 0 | 7.8 | 0 | 0 | 0 | |
| Within-day | SD | 13.3 | 4.6 | 4.4 | 35.7 | 14.8 | 11.9 | 28.1 | 14 |
| % CV | 7.8 | 0.5 | 0.3 | 1.1 | 12.2 | 2.3 | 3.2 | 0.7 | |
| Between-day | SD | 0.0 | 1.7 | 2.4 | 15.7 | 2.9 | 6.9 | 21.4 | 6.2 |
| %CV | 0.0 | 0.2 | 0.2 | 0.5 | 2.4 | 1.3 | 2.5 | 0.3 | |
| Total (within-laboratory) | SD | 13.3 | 4.9 | 5 | 39 | 15.1 | 13.8 | 35.3 | 15.3 |
| %CV | 7.8 | 0.5 | 0.3 | 1.2 | 12.4 | 2.7 | 4.1 | 0.7 | |
Trueness analysis indicated that, for the osmometer, the assigned value was 290.0, the mean was 310.6±9.3, the bias was 20.6, the 95 % confidence interval (CI) ranged from 11.5 to 29.6, and the relative bias was 7.1 %. For Sysmex, the assigned value was 500.0, the mean was 537.6±10.7, the bias was 37.6, the 95 % CI ranged from 30.4 to 44.7, and the relative bias was 7.5 % (Table 2).
Accuracy analysis of Osmo and Osmo Sysmex methods.
| Assigned value | Mean | Bias | 95 % CI | Relative bias | |
|---|---|---|---|---|---|
| Osmometer | 290.0 | 310.6±9.3 | 20.6 | 11.5–29.6 | 7.1 % |
| Sysmex | 500.0 | 537.6±10.7 | 37.6 | 30.4–44.7 | 7.5 % |
Comparison of measurements between the Osmometer and Sysmex devices included 210 samples for each method. The median values (1st–3rd quartile) were 541 (380–771) for the osmometer and 563.5 (360–802) for the Sysmex. The minimum and maximum values ranged from 82 to 1,250 for the osmometer and 60 to 1,238 for Sysmex, with a p-value of 0.348 from the Wilcoxon signed-rank test (Table 3).
Comparison of Osmo and Osmo Sysmex measurements using the Wilcoxon test.
| Osmometer | Sysmex | p-Value (Wilcoxon test) | |
|---|---|---|---|
| n | 210 | 210 | |
| Mean±SD | 569.3±256.4 | 573.4±276.4 | |
| Median (1st–3rd quartile) | 541 (380–771) | 563.5 (360–802) | 0.348 |
| Min-max | 82–1,250 | 60–1,238 |
Correlation analysis revealed a strong positive correlation between the two methods (Spearman’s ρ=0.857, p<0.01). Passing–Bablok regression analysis indicated no significant deviation from linearity (p=0.49), with the regression equation: Sysmex=−46.74 (−77.5 to −7.96) + 1.111 (1.038 to 1.187) × Osmometer.
Bland–Altman analysis demonstrated an absolute mean difference of 2.507 with an SD of 151.766 and a SE of 10.029. The 95 % CI for the absolute mean difference ranged from −294.955 to 299.969. For the relative mean difference, the mean was 2.462, with an SD of 32.369, SE of 2.139, and a 95 % CI ranging from −60.981 to 65.905 (Figure 1).
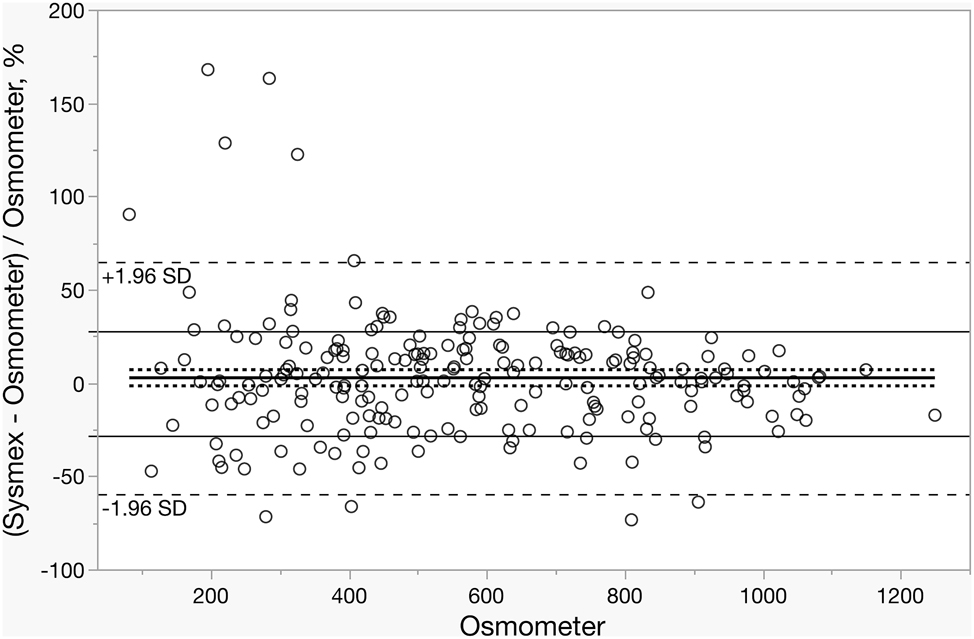
Bland–Altman plot illustrating the percentage difference of Sysmex and Osmometer measurements as a function of the osmolality of the osmometer. The solid black lines denote the mean difference and allowable bias, while the dashed lines represent the 95 % confidence intervals (CIs).
Regression analyses were conducted separately for the OSMOMAT 3000 basic and Sysmex UF-5000 to identify predictors of urine osmolality. Both models exhibited high explanatory power (OSMOMAT: R=0.9623, Adjusted R2=0.9234; Sysmex: R=0.9458, Adjusted R2=0.8908). For the OSMOMAT 3000 basic, urea nitrogen, creatinine, calcium, potassium, and sodium were significant predictors (all p<0.001), whereas glucose and microalbumin did not contribute meaningfully (p>0.05). Similarly, for the Sysmex UF-5000, sodium, potassium, calcium, and creatinine were significant predictors (all p<0.001), while glucose, urea nitrogen, and microalbumin were not (p>0.05). Overall, both models indicated that sodium, potassium, calcium, and creatinine consistently accounted for a substantial portion of the variance in osmolality results. In contrast, glucose, urea nitrogen, and microalbumin had negligible contributions (Table 4).
Regression analyses of OSMOMAT 3000 basic and Sysmex UF-5000 to identify predictors of urine osmolality.
| Model | Parameters | β | SE (%95 CI) | p-Value |
|---|---|---|---|---|
| Osmomat 3000 basic | Creatinine | 0.463±0.127 | 0.121 (0.211 to 0.715) | <0.001 |
| Microalbumin | −0.036±0.051 | −0.013 (−0.138 to 0.065) | 0.482 | |
| Calcium | 3.882±0.975 | 0.092 (1.959 to 5.805) | <0.001 | |
| Urea nitrogen | 0.428±0.031 | 0.444 (0.365 to 0.491) | <0.001 | |
| Glucose | 0.050±0.048 | 0.020 (−0.044 to 0.145) | 0.297 | |
| Potassium | 1.347±0.192 | 0.200(0.968 to 1.726) | <0.001 | |
| Sodium | 1.518±0.102 | 0.344 (1.316 to 1.720) | <0.001 | |
| Sysmex UF 5000 | Creatinine | 0.636±0.164 | 0.154(0.312 to 0.960) | <0.001 |
| Microalbumin | −0.11±0.066 | −0.04(−0.245 to 0.017) | 0.089 | |
| Calcium | 2.743±1.256 | 0.060 (0.266 to 5.219) | 0,03 | |
| Urea nitrogen | 0.006±0.041 | 0.005 (−0.075 to 0.087) | 0.883 | |
| Glucose | 0.048±0.062 | 0.018 (−0.073 to 0.171) | 0.433 | |
| Potassium | 2.501±0.247 | 0.345 (2.013 to 2.989) | <0.001 | |
| Sodium | 2.885±0.131 | 0.606 (2.625 to 3.145) | <0.001 |
-
Model OSMOMAT 3000 basic: R=0.9623, Adjusted R2=0.9234 Model Sysmex UF-5000: R=0.9458, Adjusted R2=0.8908. SE, standard estimate; CI, confidence interval; β, unstandardized regression coefficients.
Discussion
In our study, we evaluated and compared the analytical performance of the Sysmex UF-5000, which measures osmolality using the electrical conductivity method, and the OSMOMAT 3000 basic, which employs the freezing point depression method. In addition, we investigated the effects of urinary biochemical parameters (total protein, creatinine, microalbumin, urea, glucose, calcium, potassium, sodium, and chloride) on the osmolality results obtained from both devices.
In the precision evaluation of both devices, the within-run, between-run, within-day, between-day, and total %CV values across four concentration levels were found to be lower than the maximum acceptable value of 14.2 % [16]. The total %CV values obtained from the Sysmex UF-5000 were lower at all four levels compared to those from the OSMOMAT 3000 basic. The %CV values of Sysmex UF-5000 and OSMOMAT 3000 basic were similar to those reported in other studies (2–5). However, the OSMOMAT 3000 basic values were higher than the manufacturer’s stated limits of <2 mOsmol/kg SD and <0.5 % CV at concentrations of 400 mOsmol/kg and 1,500 mOsmol/kg, respectively [17].
When the trueness of the methods was evaluated, the %bias values for the Sysmex UF-5000 and OSMOMAT 3000 basic were calculated as 7.5 and 7.1 % respectively. In our study, the %bias values for the Sysmex UF-5000 were consistent with those reported by Yoo et al. [12], but higher compared to the study by Yis et al. [2], Revell et al. [18] reported %bias values for the OSMOMAT 3000 basics that were similar to those obtained in our study. Importantly, in our results, the %bias values of both devices were comparable and well below the predefined acceptable threshold of 16.1 %, supporting the analytical trueness of both methods [16].
In the comparison performed with patient samples, no significant difference was observed between the results obtained from the two devices, and a strong correlation was found. However, Bland–Altman analysis revealed that 26.6 % of the results from the Sysmex UF-5000 differed from those of the OSMOMAT 3000 basic by more than the allowable total error (TEa) of 28.1 %. In our study, the proportion of samples exceeding the allowable total error was higher than that reported by Yis et al. [2], but lower than that of Yoo et al. [12]. Collectively, our findings suggest that while both methods demonstrate acceptable analytical performance, the Sysmex UF-5000 may be more vulnerable to matrix effects in specific patient groups compared with freezing-point osmometry.
These discrepancies observed in the Bland–Altman analysis led us to further investigate the underlying factors. Our multiple regression analysis was performed to investigate the possible effects of urinary biochemical parameters on osmolality. Due to multicollinearity, total protein was excluded in the presence of microalbumin, and chloride in the presence of sodium. The osmolality results obtained from the OSMOMAT 3000 basic (freezing point method) were associated with sodium, potassium, calcium, urea, and creatinine, but not with glucose or microalbumin. Sodium, potassium, and calcium are water-soluble ions that lower the freezing point, a colligative property of solutions [19]. Similarly, water-soluble molecules such as creatinine and urea also affect the freezing point. The influence of creatinine on osmolality measured by the freezing point method has also been demonstrated [20], 21]. While urea is typically included in serum osmolality calculations, creatinine is generally excluded. The effect of creatinine on urine osmolality, despite its negligible role in serum, may be explained by the higher concentrations of creatinine in urine compared to serum. Likewise, glucose is a water-soluble molecule that affects the freezing point and is included in osmolality calculation formulas [10]. However, in our regression analysis, glucose did not affect the results obtained from the OSMOMAT 3000 basic. Under normal conditions, renal tubules reabsorb almost all glucose, leaving very low levels in urine [22]. Therefore, the urine concentrations of glucose in our sample group were low, which may have prevented the expected effect on the freezing point method from being observed.
Microalbumin, as a water-soluble molecule, can lower the freezing point. However, due to its much larger molecular weight compared to smaller molecules such as creatinine and urea, it produces a lower molar concentration in solution at similar mass/volume concentrations [23]. Since freezing point depression depends on molar concentration rather than mass, the effect of microalbumin on the freezing point method is negligible [24]. This finding agrees with prior reports, reinforcing that macromolecules contribute minimally to osmolality when assessed by colligative property-based methods.
To understand the distinct effects of these compounds on the electrical conductivity method, we also conducted multiple regression analysis for the Sysmex UF-5000. Sodium, potassium, calcium, and creatinine were found to be associated, while microalbumin, urea, and glucose were not. Sodium, potassium, and calcium are present in urine as ionized solutes, which increase electrical conductivity and thus influence this method. Creatinine is a zwitterion molecule and would not be expected to affect electrical conductivity [25]. Creatinine can bind protons under acidic conditions, acquiring a positive charge. Although only a small fraction is protonated at physiological pH (∼7.4), the proportion of protonated creatinine increases as the pH decreases, consistent with its chemical behaviour in acidic environments [26]. In our sample set, 72.9 % of pH results obtained by dipstick were <6. Therefore, the relatively high urinary creatinine concentrations combined with low pH may have led to the observed effect of creatinine on electrical conductivity.
A particularly important finding of our study is the differential impact of non-ionic molecules. Both urea and glucose are nonpolar molecules that do not increase electrical conductivity [25], 27]. Although urea affects osmolality, as measured by the freezing point method, it cannot be measured by electrical conductivity. In one study, urea’s effect on osmolality was indirectly demonstrated through urease, which generates ammonia that increases conductivity [25]. Thus, while urea influences the freezing point method, it does not affect electrical conductivity, which may partly explain discrepancies between the two methods. Similarly, glucose affects the freezing point but not conductivity, and significant differences between the two methods have been reported in urine samples with high glucose levels [2]. However, another study demonstrated that glucose decreases conductivity, suggesting a potential negative interference in osmolality measured by this method [27]. We did not observe this negative interference in our study, likely due to the low glucose concentrations in our sample set, as observed in the freezing point method. Studies using samples with higher urinary glucose levels may better demonstrate this effect.
Depending on pH, albumin (microalbumin) is a polar molecule that carries different charges and, therefore, could affect electrical conductivity [28]. However, similar to its lack of effect on the freezing point method in our study, no effect was observed in the electrical conductivity method. This may be attributed to the low molar concentrations of microalbumin in urine. Taken together, our findings suggest that the impact of macromolecules and non-ionic solutes on conductivity-based osmolality is minimal compared to that of small electrolytes and pH-dependent charged species. These results highlight that conductivity-based osmolality primarily reflects the ionic milieu of urine, whereas the contribution of larger or non-ionic molecules is negligible under routine clinical conditions. Future studies including samples with higher concentrations of non-ionic solutes are warranted to clarify their potential impact in specific patient populations.
Conclusions
In this study, we compared the electrical conductivity and freezing point methods for urine osmolality measurement. Both methods demonstrated high reproducibility and had acceptable bias values. Our findings indicated that the electrical conductivity-based method is more sensitive to matrix effects, such as urine ionic composition and pH, than the freezing point method, while the contribution of large or non-ionic molecules to this method is negligible.
From a clinical perspective, conductivity-based osmolality measurements are a suitable and practical alternative for routine use in most outpatient populations. However, in cases where urinary solute composition deviates significantly from the norm, such as in uncontrolled diabetes mellitus, nephrotic syndrome, or intensive care unit (ICU) settings, conductivity results should be interpreted with caution. In these scenarios, freezing point osmometry remains the reference method. Potential differences in paediatric and geriatric populations should also be considered; while conductivity may be a practical screening tool in paediatrics, confirmatory measurements may be needed in elderly patients.
Overall, our results emphasize that electrical conductivity is a reagent-free, efficient alternative for estimating urine osmolality. Future multicentre studies are needed to better define the trueness in patients with various pathophysiological conditions and to fully delineate the clinical applicability of conductivity-based measurements.
Acknowledgments
We sincerely thank all study participants for their valuable contributions, and the Department of Medical Biochemistry at Gazi University for their support.
-
Research ethics: This study was approved by the Non-Interventional Clinical Research Ethics Committee of Abant İzzet Baysal University with the decision numbered 2025/271, dated June 17, 2025.
-
Informed consent: All participants were informed about the study procedures. Informed consent was obtained from all individuals included in this study, or their legal guardians or wards.
-
Author contributions: Conceptualization: K.Ü., M.A. Methodology/Planning and Organization: K.Ü., M.A. Funding Acquisition: M.A. Investigation/Laboratory Studies: K.Ü. Resources/Provision of Materials: K.Ü. Data Curation/Collection: K.Ü. Formal Analysis/Data Analysis, Statistics, and Interpretation: M.A., K.Ü., M.A.S. Writing – Original Draft: M.A., K.Ü., M.A.S. Writing – Review & Editing: M.E.E. All authors have accepted responsibility for the entire content of this manuscript and approved its submission.
-
Use of Large Language Models, AI and Machine Learning Tools: We acknowledge the assistance of artificial intelligence tool Grammarly (Grammarly, Inc., San Francisco, USA) for improving the language of this manuscript.
-
Conflict of interest: The authors state no conflict of interest.
-
Research funding: None declared.
-
Data availability: The datasets analysed during the current study are available from the corresponding author upon a reasonable request.
References
1. Ahmad, S, Maqbool, A, Srivastava, A, Gogoi, S, Siddiqui, FA, Panwar, S. Urine analysis revisited: a review. Ann Int Med Dent Res 2018;5:22–32. https://www.aimdrjournal.com/wp-content/uploads/2021/06/PT5_RA_Sharique-edit.pdf [Accessed 16 Sep 2025].Search in Google Scholar
2. Yis, OM, Alisik, M, Bugdayci, G, Sert, MA, Erdogan, UG, Ates, M. Performance evaluation of urine osmolality measurement on Sysmex UF-5000 and the effect of molecules and particles in urine. Clin Lab 2023;69. https://doi.org/10.7754/Clin.Lab.2022.220536.Search in Google Scholar PubMed
3. van der Hoek, J, Hoorn, EJ, de Jong, GM, Janssens, EN, de Herder, WW. Severe hyponatremia with high urine sodium and osmolality. Clin Chem 2009;55:1905–8. https://doi.org/10.1373/clinchem.2009.125575.Search in Google Scholar PubMed
4. Palmer, BF, Clegg, DJ. The use of selected urine chemistries in the diagnosis of kidney disorders. Clin J Am Soc Nephrol 2019;14:306–16. https://doi.org/10.2215/cjn.10330818.Search in Google Scholar PubMed PubMed Central
5. Perrier, ET, Buendia-Jimenez, I, Vecchio, M, Armstrong, LE, Tack, I, Klein, A. Twenty-four-hour urine osmolality as a physiological index of adequate water intake. Dis Markers 2015;2015:231063. https://doi.org/10.1155/2015/231063.Search in Google Scholar PubMed PubMed Central
6. Lee, MJ, Chang, TI, Lee, J, Kim, YH, Oh, KH, Lee, SW, et al.. Urine osmolality and renal outcome in patients with chronic kidney disease: results from the KNOW-CKD. Kidney Blood Press Res 2019;44:1089–100. https://doi.org/10.1159/000502291.Search in Google Scholar PubMed
7. Faria, DK, Mendes, ME, Sumita, NM. The measurement of serum osmolality and its application to clinical practice and laboratory: literature review. J Bras Patol Med Lab 2017;53:38–45.10.5935/1676-2444.20170008Search in Google Scholar
8. Vidal-Mayo, JJ, Olivas-Martínez, A, Pérez-Díaz, I, López-Navarro, JM, Sánchez-Landa, E, Carrillo-Maravilla, E, et al.. Calculated versus measured urine osmolarity: accuracy of estimated urine density. Rev Invest Clin 2018;70:310–8. https://doi.org/10.24875/ric.18002598.Search in Google Scholar PubMed
9. Martín-Calderón, JL, Bustos, F, Tuesta-Reina, LR, Varona, JM, Caballero, L, Solano, F. Choice of the best equation for plasma osmolality calculation: comparison of fourteen formulae. Clin Biochem 2015;48:529–33. https://doi.org/10.1016/j.clinbiochem.2015.03.005.Search in Google Scholar PubMed
10. Kar, E, Kocatürk, E, Küskü Kiraz, Z, Demiryürek, B, Alataş, I. Comparison of measured and calculated osmolality levels. Clin Exp Nephrol 2020;24:444–9. https://doi.org/10.1007/s10157-020-01848-1.Search in Google Scholar PubMed
11. Vialet, R, Léone, M, Albanèse, J, Martin, C. Calculated serum osmolality can lead to a systematic bias compared to direct measurement. J Neurosurg Anesthesiol 2005;17:106–9. https://doi.org/10.1097/01.ana.0000163200.48483.56.Search in Google Scholar PubMed
12. Yoo, DW, Lee, SM, Moon, SY, Kim, IS, Chang, CL. Evaluation of conductivity-based osmolality measurement in urine using the Sysmex UF5000. J Clin Lab Anal 2021;35:e23586. https://doi.org/10.1002/jcla.23586.Search in Google Scholar PubMed PubMed Central
13. Oyaert, M, Speeckaert, MM, Delanghe, JR. Estimated urinary osmolality based on combined urinalysis parameters: a critical evaluation. Clin Chem Lab Med 2019;57:1169–76. https://doi.org/10.1515/cclm-2018-1307.Search in Google Scholar PubMed
14. Tomlinson, A, McCann, LC, Pearce, EI. Comparison of human tear film osmolarity measured by electrical impedance and freezing point depression techniques. Cornea 2010;29:1036–41. https://doi.org/10.1097/ICO.0b013e3181cd9a1d.Search in Google Scholar PubMed
15. Pena-Verdeal, H, García-Resúa, C, Miñones, M, Giraldez, MJ, Yebra-Pimentel, E. Accuracy of a freezing point depression technique osmometer. Optom Vis Sci 2015;92:e273–83. https://doi.org/10.1097/opx.0000000000000669.Search in Google Scholar
16. Ricos, C, Alvarez, V, Cava, F, Garcia-Lario, J, Hernandez, A, Jimenez, C, et al.. Desirable biological variation database specifications; 2014. https://www.westgard.com/biodatabase1.htm [Accessed 15 Sep 2025].Search in Google Scholar
17. OSMOMAT® 3000 series freezing point osmometer biomedical systems [Internet]. 2023. https://www.osmometers.com/files/Brochure_OSMOMETER_3000-Serie-E_2023-10-V01_web.pdf [Accessed 15 Sep 2025].Search in Google Scholar
18. Revell, I, Ploeg, H, Barnes, E, Leaver, C, Mariadhas, B, Castle, J. An evaluation of the accuracy and precision of the Gonotec Osmomat 3000. N Z J Med Lab Sci 2020;74.Search in Google Scholar
19. Electrolytes and acid-base balance – UCSD lab medicine [Internet]. http://ucsdlabmed.wikidot.com/chapter-9 [Accessed 15 Sep 2025].Search in Google Scholar
20. Jäger, R, Purpura, M, Shao, A, Inoue, T, Kreider, RB. Analysis of the efficacy, safety, and regulatory status of novel forms of creatine. Amino Acids 2011;40:1369–83. https://doi.org/10.1007/s00726-011-0874-6.Search in Google Scholar PubMed PubMed Central
21. Ozdemir, S, Sears, CG, Harrington, JM, Poulsen, AH, Buckley, J, Howe, CJ, et al.. Relationship between urine creatinine and urine osmolality in spot samples among men and women in the Danish Diet Cancer and Health Cohort. Toxics 2021;9. https://doi.org/10.3390/toxics9110282.Search in Google Scholar PubMed PubMed Central
22. Physiology, glycosuria [Internet]. Treasure Island (FL): StatPearls Publishing; 2020. https://www.ncbi.nlm.nih.gov/books/NBK557441/ [Accessed 15 Sep 2025].Search in Google Scholar
23. Moman, R, Gupta, N, Varacallo, M. Physiology, albumin [Internet]. Treasure Island (FL): StatPearls Publishing; 2022. https://www.ncbi.nlm.nih.gov/books/NBK459198/ [Accessed 15 Oct 2025].Search in Google Scholar
24. Warhol, RM, Eichenholz, A, Mulhausen, RO. Osmolality. Arch Intern Med 1965;116:743–9. https://doi.org/10.1001/archinte.1965.03870050097014.Search in Google Scholar PubMed
25. Kong, TF, Shen, X, Sim, MY, Yong, J, Ng, TK, Chong, TW, et al.. Marcos. Urine osmolality assessment through the integration of urea hydrolysis and impedance measurement. Lab Chip 2024;24:3728–37. https://doi.org/10.1039/d4lc00114a.Search in Google Scholar PubMed
26. Diamond, BJ. Temperature and pH dependence of the cyclization of creatine: a study via mass spectrometry [master’s thesis]. Huntington (WV): Marshall University; 2005.Search in Google Scholar
27. Tura, A, Sbrignadello, S, Cianciavicchia, D, Pacini, G, Ravazzani, P. A low frequency electromagnetic sensor for indirect measurement of glucose concentration: in vitro experiments in different conductive solutions. Sensors (Basel) 2010;10:5346–58. https://doi.org/10.3390/s100605346.Search in Google Scholar PubMed PubMed Central
28. Baler, K, Martin, OA, Carignano, MA, Ameer, GA, Vila, JA, Szleifer, I. Electrostatic unfolding and interactions of albumin driven by pH changes: a molecular dynamics study. J Phys Chem B 2014;118:921–30. https://doi.org/10.1021/jp409936v.Search in Google Scholar PubMed PubMed Central
© 2025 the author(s), published by De Gruyter, Berlin/Boston
This work is licensed under the Creative Commons Attribution 4.0 International License.