Using zlog in spider charts for fast diagnosis recognition
-
Johannes Böhm
 ,
Johannes Daubitzer
,
Johannes Daubitzer

Abstract
Objectives
The standardization and normalization of laboratory parameters to a fixed scale, such as the zlog value, may offer significant advantages for interpretation. This method not only allows for the direct comparison of different parameters but also facilitates a way for advanced visualizations beyond the classic table.
Methods
We employ spider charts in conjunction with zlog transformation to enable laboratory parameters that are jointly evaluated for diagnostic purposes to be summarized in a unified visualization.
Results
With anemia and blood gas parameters we present two examples where specific constellations of laboratory parameters create distinguishable diagnostic patterns in the spider charts.
Conclusions
The zlog spider combines zlog-transformation standardization with spider diagram visualization to facilitate laboratory parameter comparison and create recognizable diagnostic patterns, potentially improving clinician comprehension and efficiency, though further case studies are needed to confirm its efficacy.
Introduction
The traditional tabular presentation of laboratory values has long been the cornerstone of clinical data visualization in healthcare. Although these conventional tables are a repository for all information essential to clinical decision-making–including patient identifiers, test parameters, reference ranges, and measured values–their static format inherently limits the efficiency of data interpretation and accessibility, thereby posing challenges to their utility in high-risk and workload-intensive settings [1].
The harmonization of laboratory report presentation was advocated for by Bold et al. as early as 1976, with a specific call for an organized and simplified form of representation [2]. The ongoing advancements in medicine have concurrently led to an expansion in the scope and complexity of laboratory results and test information [3]. This persistent challenge may contribute to a state commonly described as information overload and data dispersal.
The diagnostic decision-making process typically follows a systematic approach that begins with the identification of parameters demonstrating deviation from established reference ranges. This initial step serves as the foundation for clinical reasoning, prompting healthcare professionals to investigate further by analyzing interdependent parameters and their correlations [4]. Finally, the recognition of specific constellations of abnormal values enables clinicians to formulate preliminary diagnostic hypotheses. This analytical process, while methodical and thorough, could be optimized by ergonomic visualization [5].
The zlog value was introduced in 2017 to address the lack of standardization in medical laboratory results. Different measurement techniques and units, as well as patient characteristics and conditions, create very different reference ranges used in different labs, making it impossible to interpret a result value meaningfully in isolation. The zlog transformation creates an abstraction to a simple standardized scale by calculating the distance between a measurement and its corresponding reference range based on standard deviations [6]. With the basic scale’s design ranging from −10 to 10 and a reference range between −2 and 2, an absolute value greater than two consequently represents a slight reference range violation and a value greater than five is referred to as pathological. When combining this scale with a color scheme, highly pathological values stand out in the table through color intensity [6].
The zlog value may facilitate the diagnostic decision-making process by enabling the identification of reference range violations through a standardized scale.
However, restrictions of static, information-rich and complex information in a tabular format remain unsolved. The subsequent presentation of the method will demonstrate its utility by integrating laboratory values into a spider diagram for specific inquiries and diagnoses. This integration facilitates the utilization of zlog to assign absolute results to values on a scale.
Related work
Hoffmann et al. introduce and explain the utilization of zlog values for laboratory results and its advantages, thereby calling for implementation in laboratory reports [6]. The zlog value constitutes an integral component of the laboratory report concept, which is to be incorporated into the German electronic patient record as supplementary information within medical information objects [7]. Specific research in the usage of zlog for laboratories has been conducted investigating the usage of zlog values for pre-processing data as an element of exploratory data analysis and machine learning techniques [8] as well as for plausibility checks of reference intervals [9]. Another field of research is utilization of zlog values for the specific parameter NT-proBNP in the paediatric sector [10], [11], [12], [13], [14], [15], [16].
Methods
The proposed method uses zlog-transformation as a standardization method in order to make the parameters comparable. The visualization is designed to present a manageable amount of information by displaying between four and nine numerical parameters, which ensures that users are not overwhelmed with excessive data. [17].
The creation of a consistent chart requires careful initial selection and positioning of parameters to establish a reliable, standardized foundation for each report. This process involves several critical considerations that guarantee both clinical relevance and visual effectiveness.
The chosen parameters must form a clinically relevant set that directly supports diagnostic decision-making processes. Each parameter requires a numerical reference interval to enable zlog value calculation, making this a fundamental prerequisite for inclusion. The selection process incorporates established diagnostic pathways while following the conventional ordering patterns used by experienced diagnosticians, ensuring familiarity and intuitive navigation for clinical users. The ordering of parameters significantly impacts the final report format and interpretation.
For each numerical analyte, the zlog value is calculated using the upper and lower bounds of the respective reference range, then plotted on the spider chart using a standardized scale from −10 to 10. This scaling approach ensures that normal values cluster around zero in the center, while extreme values appear as outliers extending towards the chart’s periphery.
To enhance visual interpretation, colored lines or a gradient color scheme aligned with zlog values are recommended for the background. This emphasizes deviations from the zero baseline (zlog=0) rather than the geometric center of the chart: zlog values near zero fall within a neutral band along each spoke, while values with larger absolute magnitude are highlighted with greater color intensity.
We selected anemia and blood gas analysis as exemplary clinical scenarios. These parameter sets represent widely utilized diagnostic panels that are routinely encountered in clinical practice across various healthcare settings. The chosen diagnoses are of significant clinical importance, as anemia affects a substantial portion of the global population [18] and requires prompt identification and management, while blood gas analysis provides critical information for respiratory and metabolic assessment in acute care situations [19]. The widespread familiarity of healthcare professionals with these parameter combinations ensures that the evaluation results will be relevant and applicable to everyday clinical decision-making processes.
Readers are encouraged to critically evaluate the effectiveness of this zlog-based visualization method by examining the presented results and comparing them with traditional tabular formats. Consider whether the spider chart representation facilitates faster pattern recognition, reduces cognitive load during diagnostic processes, and enhances the identification of clinically relevant parameter constellations.
Results
The effectiveness of the spider diagram approach for laboratory value interpretation stems from fundamental principles of clinical diagnostics and pattern recognition. Laboratory parameters are naturally grouped and utilized in specific combinations for particular diagnoses, creating inherent relationships that can be leveraged for visual representation.
We provided two examples:
Figure 1, anemia panel: This example illustrates an exemplary patient presenting with stage three iron deficiency anemia (manifest iron deficiency anemia) on the left side versus a regular healthy person on the right. Correspondingly, ferritin, MCV, and MCH values are substantially decreased, with hemoglobin levels being significantly compromised. In response to this advanced iron-deficient state, platelet counts are elevated, as demonstrated in the visualization.

Anemia panel with example results for stage three iron deficiency anemia (left) and healthy reference (right).
Figure 2, acid-base status panel: The panel is designed for the visual assessment of an acid-base status. The figure compares measurements of blood gas analysis in states of respiratory acidosis and metabolic acidosis to a normal clinical reference. The zlog methodology provides a quantitative and visual representation of the deviation from this normal state.
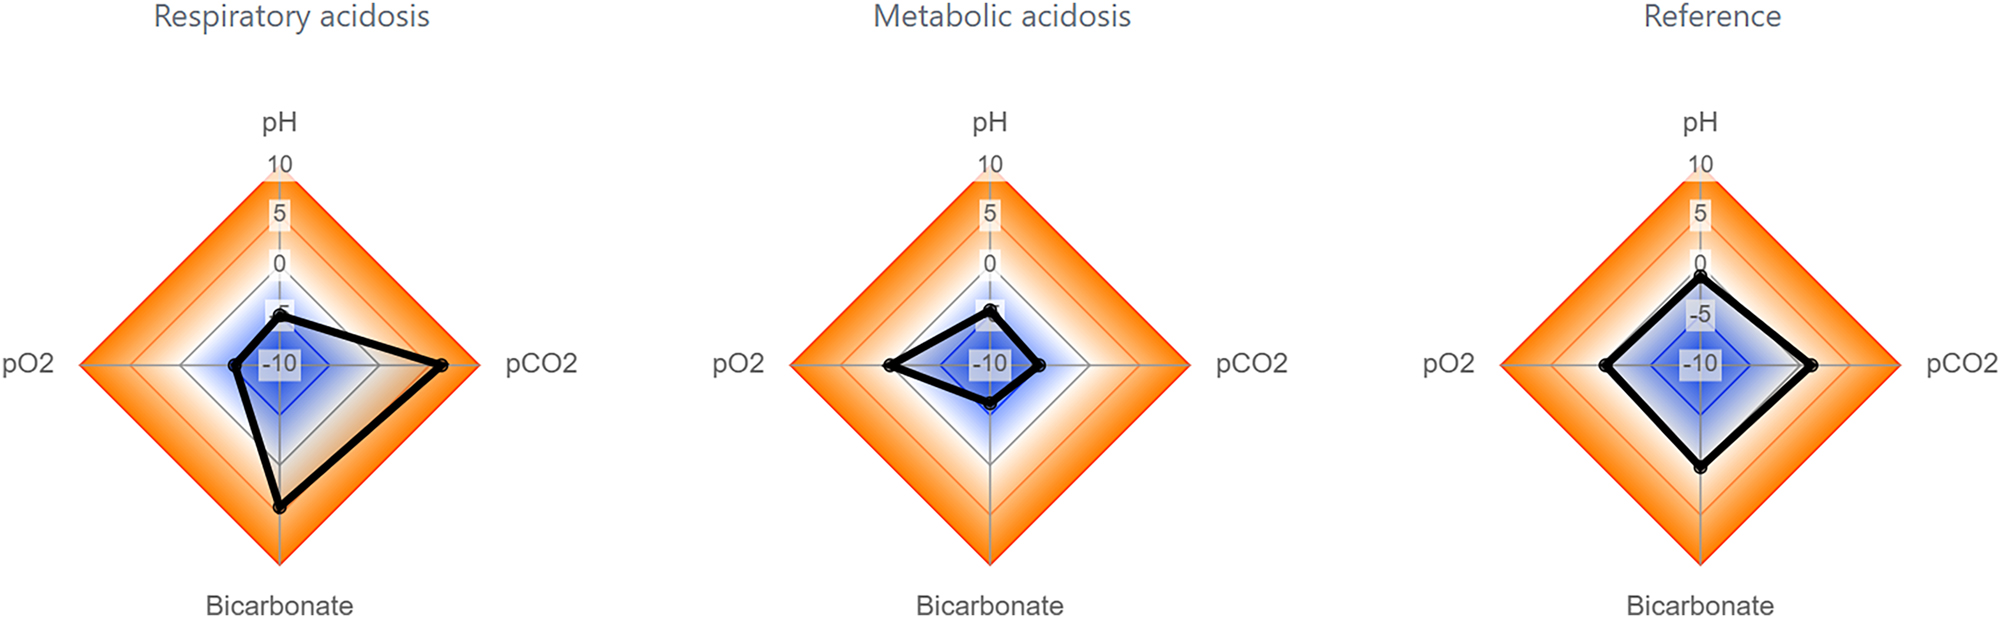
Acid-base status panel with example results for respiratory acidosis (left), metabolic acidosis (mid) and a healthy reference (right).
The consistent positioning of these parameter groups within the spider diagram establishes a recognizable framework that clinicians can quickly familiarize themselves with. This standardized arrangement ensures that healthcare professionals may develop visual memory patterns associated with specific diagnostic contexts, enhancing both speed and accuracy of interpretation.
Most importantly, the constellations of laboratory values manifest as distinct geometric shapes within the spider diagram, with each shape corresponding to characteristic diagnostic patterns. These geometric representations serve as visual signatures for different medical conditions, transforming abstract numerical relationships into intuitive visual patterns that the human brain can process more efficiently [20].
The diagnostic power of this approach lies in the fact that these geometric shapes are significantly different from one another and can be clearly distinguished, even by clinicians who may not be specialists in the particular diagnostic area. This visual differentiation can reduce the cognitive load required for pattern recognition and could minimize the risk of misinterpretation that may occur when analyzing traditional tabular data presentations [21].
Discussion
Although the spider diagram approach is considered to offer significant advantages for laboratory value visualization, it is essential to acknowledge and consider its limitations when implementing it.
The method faces inherent constraints in diagnostic differentiation, as not all diagnoses can be clearly distinguished through geometric pattern recognition alone. This limitation necessitates the continued use of traditional tabular presentations alongside the spider diagram visualization, creating a dual-format requirement that may initially increase rather than reduce the cognitive load for clinicians. Furthermore, not only laboratory results, but more clinical information form a diagnosis. Future research should include an integration of other relevant information in fast diagnosis recognition patterns.
The zlog-transformation itself presents technical challenges, particularly regarding its asymmetric properties, which can introduce bias in value interpretation. Furthermore, the circular representation of the spider diagram creates an inherent visual bias where elevated values appear more prominent than decreased values, potentially leading to selective attention patterns that may overlook clinically significant low values. A gradient background can help counteract these biases (see Figure 3).

Comparison of a gradient background and colored lines.
The initial configuration of the method represents a substantial institutional barrier, as it demands considerable time and specialized clinical expertise to ensure optimal diagnostic utility.
Despite these constraints, the spider diagram method offers substantial clinical benefits that justify its implementation in many diagnostic contexts. The visual pattern recognition capabilities enable fast identification of diagnostic constellations, reducing the time required for clinical decision-making. The geometric representation makes pathological patterns less likely to be overlooked compared to traditional table formats, where critical information can be buried within extensive numerical data.
Most importantly, the method’s ability to facilitate quick recognition of diagnostic patterns enables healthcare professionals to make critical decisions more rapidly, potentially improving patient outcomes in time-sensitive clinical situations.
Further comprehensive evaluation of this visualization method is required to validate its clinical effectiveness and establish its reliability across diverse diagnostic scenarios. Prospective studies should assess its impact on diagnostic accuracy, decision-making tempo and user acceptance among healthcare professionals. If the results demonstrate significant improvements in clinical workflow and patient outcomes, this zlog-based spider diagram approach could be integrated as a clinical decision support system component within routine laboratory information software, thereby enhancing the diagnostic capabilities of healthcare institutions.
Conclusions
The zlog spider employs the zlog-transformation as a standardization method, thereby facilitating the comparison of laboratory parameters with each other, irrespective of unit and dimension. When combined with the spider diagram as a visualization tool, the contextual linking of one-dimensional data points creates an additional level of information. Evidence suggests that the zlog spider may serve as a valuable instrument in facilitating the comprehension of laboratory reports among clinicians, potentially leading to enhanced efficiency and reduced risk of missing critical information. However, the true efficacy of this approach requires further investigation with meaningfully designed case studies.
-
Research ethics: Not applicable.
-
Informed consent: Not applicable.
-
Author contributions: All authors have accepted responsibility for the entire content of this manuscript and approved its submission.
-
Use of Large Language Models, AI and Machine Learning Tools: Claude.ai for translation.
-
Conflict of interest: The authors state no conflict of interest.
-
Research funding: None declared.
-
Data availability: Not applicable.
References
1. Cadamuro, J, Hillarp, A, Unger, A, von Meyer, A, Bauçà, JM, Plekhanova, O, et al.. Presentation and formatting of laboratory results: a narrative review on behalf of the European Federation of Clinical Chemistry and Laboratory Medicine (EFLM) Working Group “postanalytical phase” (WG-POST). Crit Rev Clin Lab Sci 2021;58:329–53. https://doi.org/10.1080/10408363.2020.1867051.Search in Google Scholar PubMed
2. Bold, AM. Clinical chemistry reporting. Problems and proposals. Lancet 1976;1:951–5.10.1016/S0140-6736(76)92726-4Search in Google Scholar
3. Politser, PE. How to make laboratory information more informative. Clin Chem 1986;32:1510–6. https://doi.org/10.1093/clinchem/32.8.1510.Search in Google Scholar
4. Jones, GRD, Haeckel, R, Loh, TP, Sikaris, K, Streichert, T, Katayev, A, et al.. Distinguishing reference intervals and clinical decision limits - a review by the IFCC Committee on Reference Intervals and Decision Limits. Clin Chim Acta 2018;483:249–57.Search in Google Scholar
5. Cadamuro, J. Der Laborbericht in neuem Gewand - die Notwendigkeit der Re-Formatierung als Basis für optimale medizinische Versorgung. Pipette – Swiss Laboratory Medicine 2021;6:8–12.Search in Google Scholar
6. Hoffmann, G, Klawonn, F, Lichtinghagen, R, Orth, M. The zlog value as a basis for the standardization of laboratory results. LaboratoriumsMedizin 2017;41:20170135. https://doi.org/10.1515/labmed-2017-0135.Search in Google Scholar
7. KBV. 2.7.17 zlog-Wert, Update. Kbv.de. Available from: https://hub.kbv.de/display/LAB1X0X0/2.7.17+zlog-Wert%2C+Update [cited 7 Aug 2025].Search in Google Scholar
8. Al-Mekhlafi, A, Klawitter, S, Klawonn, F. Standardization with zlog values improves exploratory data analysis and machine learning for laboratory data. J Lśab Med 2024;48:215–22. https://doi.org/10.1515/labmed-2024-0051.Search in Google Scholar
9. Klawitter, S, Hoffmann, G, Holdenrieder, S, Kacprowski, T, Klawonn, F. A zlog-based algorithm and tool for plausibility checks of reference intervals. Clin Chem Lab Med 2023;61:260–5. https://doi.org/10.1515/cclm-2022-0688.Search in Google Scholar PubMed
10. Palm, J, Ono, M, Niedermaier, C, Hörer, J, Hoffmann, G, Holdenrieder, S, et al.. Quantification of ventricular stress in univentricular hearts during early childhood using age-independent zlog-NT-proBNP. Int J Cardiol 2024;406:131983. https://doi.org/10.1016/j.ijcard.2024.131983.Search in Google Scholar PubMed
11. Palm, J, Niedermaier, C, Holdenrieder, S, Hoffmann, G, Klawonn, F, Hörer, J, et al.. Impact of systemic ventricular morphology on age-adjusted (zlog-)NT-proBNP in children with univentricular hearts. Pediatr Cardiol 2025. https://doi.org/10.1007/s00246-025-03898-2.Search in Google Scholar PubMed
12. Niedermaier, C, Ono, M, Klawonn, F, Holdenrieder, S, Lemmer, J, Hörer, J, et al.. Perioperative prediction of adverse events with age-adjusted NT-proBNP in children undergoing Norwood surgery. Cardiol Young 2025;35:529–38. https://doi.org/10.1017/S1047951125000290.Search in Google Scholar PubMed
13. Schroeder, L, Kuelshammer, M, Dolscheid-Pommerich, R, Holdenrieder, S, Mueller, A, Kipfmueller, F. NT-proBNP and Zlog-transformed NT-proBNP values predict extubation failure in critically ill neonates with pulmonary hypertension and ventricular dysfunction. Pediatr Pulmonol 2023;58:253–61. https://doi.org/10.1002/ppul.26193.Search in Google Scholar PubMed
14. Palm, J, Holdenrieder, S, Hoffmann, G, Hörer, J, Shi, R, Klawonn, F, et al.. Predicting major adverse cardiovascular events in children with age-adjusted NT-proBNP. J Am Coll Cardiol 2021;78:1890–900. https://doi.org/10.1016/j.jacc.2021.08.056.Search in Google Scholar PubMed
15. Palm, J, Hoffmann, G, Klawonn, F, Tutarel, O, Palm, H, Holdenrieder, S, et al.. Continuous, complete and comparable NT-proBNP reference ranges in healthy children. Clin Chem Lab Med 2020;58:1509–16. https://doi.org/10.1515/cclm-2019-1185.Search in Google Scholar PubMed
16. Palm, J, Holdenrieder, S, Hoffmann, G. Risikostratifizierung angeborener Herzfehler: Standardisierung von Referenzintervallen für NT-proBNP in der Pädiatrie. Trillium Diagnostik 2021;19:275–7. https://doi.org/10.47184/td.2021.04.04.Search in Google Scholar
17. Miller, GA. The magical number seven, plus or minus two: some limits on our capacity for processing information. Psychol Rev 1956;63:81–97. https://doi.org/10.1037/h0043158.Search in Google Scholar
18. Stevens, GA, Paciorek, CJ, Flores-Urrutia, MC, Borghi, E, Namaste, S, Wirth, JP, et al.. National, regional, and global estimates of anaemia by severity in women and children for 2000–19: a pooled analysis of population-representative data. Lancet Glob Health 2022;10:e627–39. https://doi.org/10.1016/s2214-109x(22)00084-5.Search in Google Scholar PubMed PubMed Central
19. Lee, GR. Clinical applications of blood gas analysis: a comparative review of arterial and venous blood gas monitoring in critical care. Acute Crit Care 2025;40:153–9. https://doi.org/10.4266/acc.000900.Search in Google Scholar PubMed PubMed Central
20. Paivio, A, Csapo, K. Picture superiority in free recall: imagery or dual coding? Cogn Psychol 1973;5:176–206. https://doi.org/10.1016/0010-0285(73)90032-7.Search in Google Scholar
21. Meyer, J, Shamo, MK, Gopher, D Information structure and the relative efficacy of tables and graphs. Hum Factors.1999;41:570-87. https://doi.org/10.1518/001872099779656707.Search in Google Scholar PubMed
© 2025 the author(s), published by De Gruyter, Berlin/Boston
This work is licensed under the Creative Commons Attribution 4.0 International License.
Articles in the same Issue
- Frontmatter
- Editorial
- Entering a new era of laboratory data processing and interpretation
- Articles
- Sustainable reference intervals and decision limits
- An update to reflimR: strengthening transparent reference interval verification
- Intuitive web tools for reference interval estimation: goCrunch and ReferenceRangeR
- Automated age and sex partitioning of reference intervals based on routine laboratory data
- Using zlog in spider charts for fast diagnosis recognition
- Using large language models for therapeutic drug monitoring reporting – a proof-of-concept
- EU AI Act: what could AI literacy mean for medical laboratories? – Opinion Paper on behalf of the Section Digital Competence and AI of the German Society for Clinical Chemistry and Laboratory Medicine (DGKL)
- Annual Reviewer Acknowledgment
- Reviewer Acknowledgment