Verification of ferritin on Roche cobas® 8000 C702 and comparison with E801
-
Sandrine Bouteille


To the editor,
Ferritin is an iron-binding protein responsible for storing iron mainly in the spleen, liver and bone marrow. The plasma concentration of ferritin reflects the iron status in the patient and is determined for monitoring iron metabolism and iron therapy in patients [1].
The laboratory of the university hospital UZ Brussel (Brussels, Belgium) performs approximately 3,5 million cobas® 8000 (Roche Diagnostics, Rotkreuz, Switzerland) analyses on a yearly basis on two mirrored cobas® 8000 ISE-c702-e801 systems, with one of the most requested cobas® e801 analyses being ferritin (ca. 40,000 out of 850,000 per year). Since 2000, we used the electrochemiluminescence assay (ECLIA) on Roche cobas® 8000 e801 for the determination of ferritin in plasma. This method has been standardized against the Elecsys Ferritin Assay (REF11820982122). Due to the optimization of turn-around-time (reduction of analysis time from 20 to 10 min) and the limitation of available reagent positions on the e801 rotor, we have recently made the switch to the immunoturbidimetric assay on Roche cobas® 8000 c702. This method has been standardized against the Elecsys Ferritin assay (immunological assay) which is traceable to NIBSC (WHO).
Until now, no method comparison has been published between these two assays for the determination of ferritin. Therefore, the aim of this study is to examine whether there is a difference between the two methods in the low, normal and/or high range of plasma ferritin and whether the methods can be used interchangeably. We initially conducted a method verification of the Tina-quant Ferritin Gen. 4 on Roche cobas® 8000 c702 by determining the imprecision and accuracy (CLSI EP5-A2), by the verification of the auto-dilution 1:50 (EP34) and by the investigation of the high-dose hook effect [2], 3]. Secondly, we carried out a comprehensive method comparison of 115 samples between both methods using Passing–Bablok regression analysis and we determined the clinical sensitivity and specificity of the c702 method with the e801 method as a reference (EP09) [4]. We used frozen stored samples and ferritin data of 115 subjects that had been obtained between November 2023 and January 2024 at UZ Brussel. UZ Brussel Ethical Committee agreement was obtained for the study.
Tina-quant Ferritin Gen. 4 assay total imprecision, accuracy and total error for PreciControl CliniChem Multi level 1 (mean: 122 μg/L) and level 2 (mean: 249 μg/L) were respectively within the optimal EFLM CV (3.2 %) and within the criteria of Sciensano (bias d% of 7.2 % and d % of 16 %) [5].
In a next step, the prozone-cut-off of 80,000 μg/L (stated in the instructions for use) was verified for a sample with an original ferritin concentration determined on cobas® 8000 e801 of 77,612 μg/L. No false result without a “prozone flag” was observed. Retrospective review of ca 40,000 samples analyzed in the past year in UZ Brussel made clear that only 0.001 % of these samples showed a ferritin concentration higher than 80,000 μg/L. However, the possibility of the presence of the prozone effect should be kept in mind when dubious ferritin results are found.
The recovery of six 50-fold auto diluted samples with a ferritin concentration approaching the limit of quantification (1,000 μg/L) was 101.9 %, which is within the acceptable range of 92.8–107.2 %. It is important to note that the measuring range is different between the two systems. The measuring range is 5–1,000 μg/L for the cobas® 8000 c702, while it is 0.50–2,000 μg/L for the cobas® 8000 e801. Switching to cobas® 8000 c702 therefore implicates a higher need for dilution of samples with a ferritin concentration higher than 1,000 μg/L. Only 3 % (ca. 1,200 on a yearly basis) of samples exceed this concentration and will require further dilution, which is negligible.
The overall Passing–Bablok regression analysis shows a good correlation between the two methods (y=1.09x−1.11, r=1, range: 8–997 μg/L). Figure 1 shows the respective Passing–Bablok graphs at low, normal and high ferritin levels.
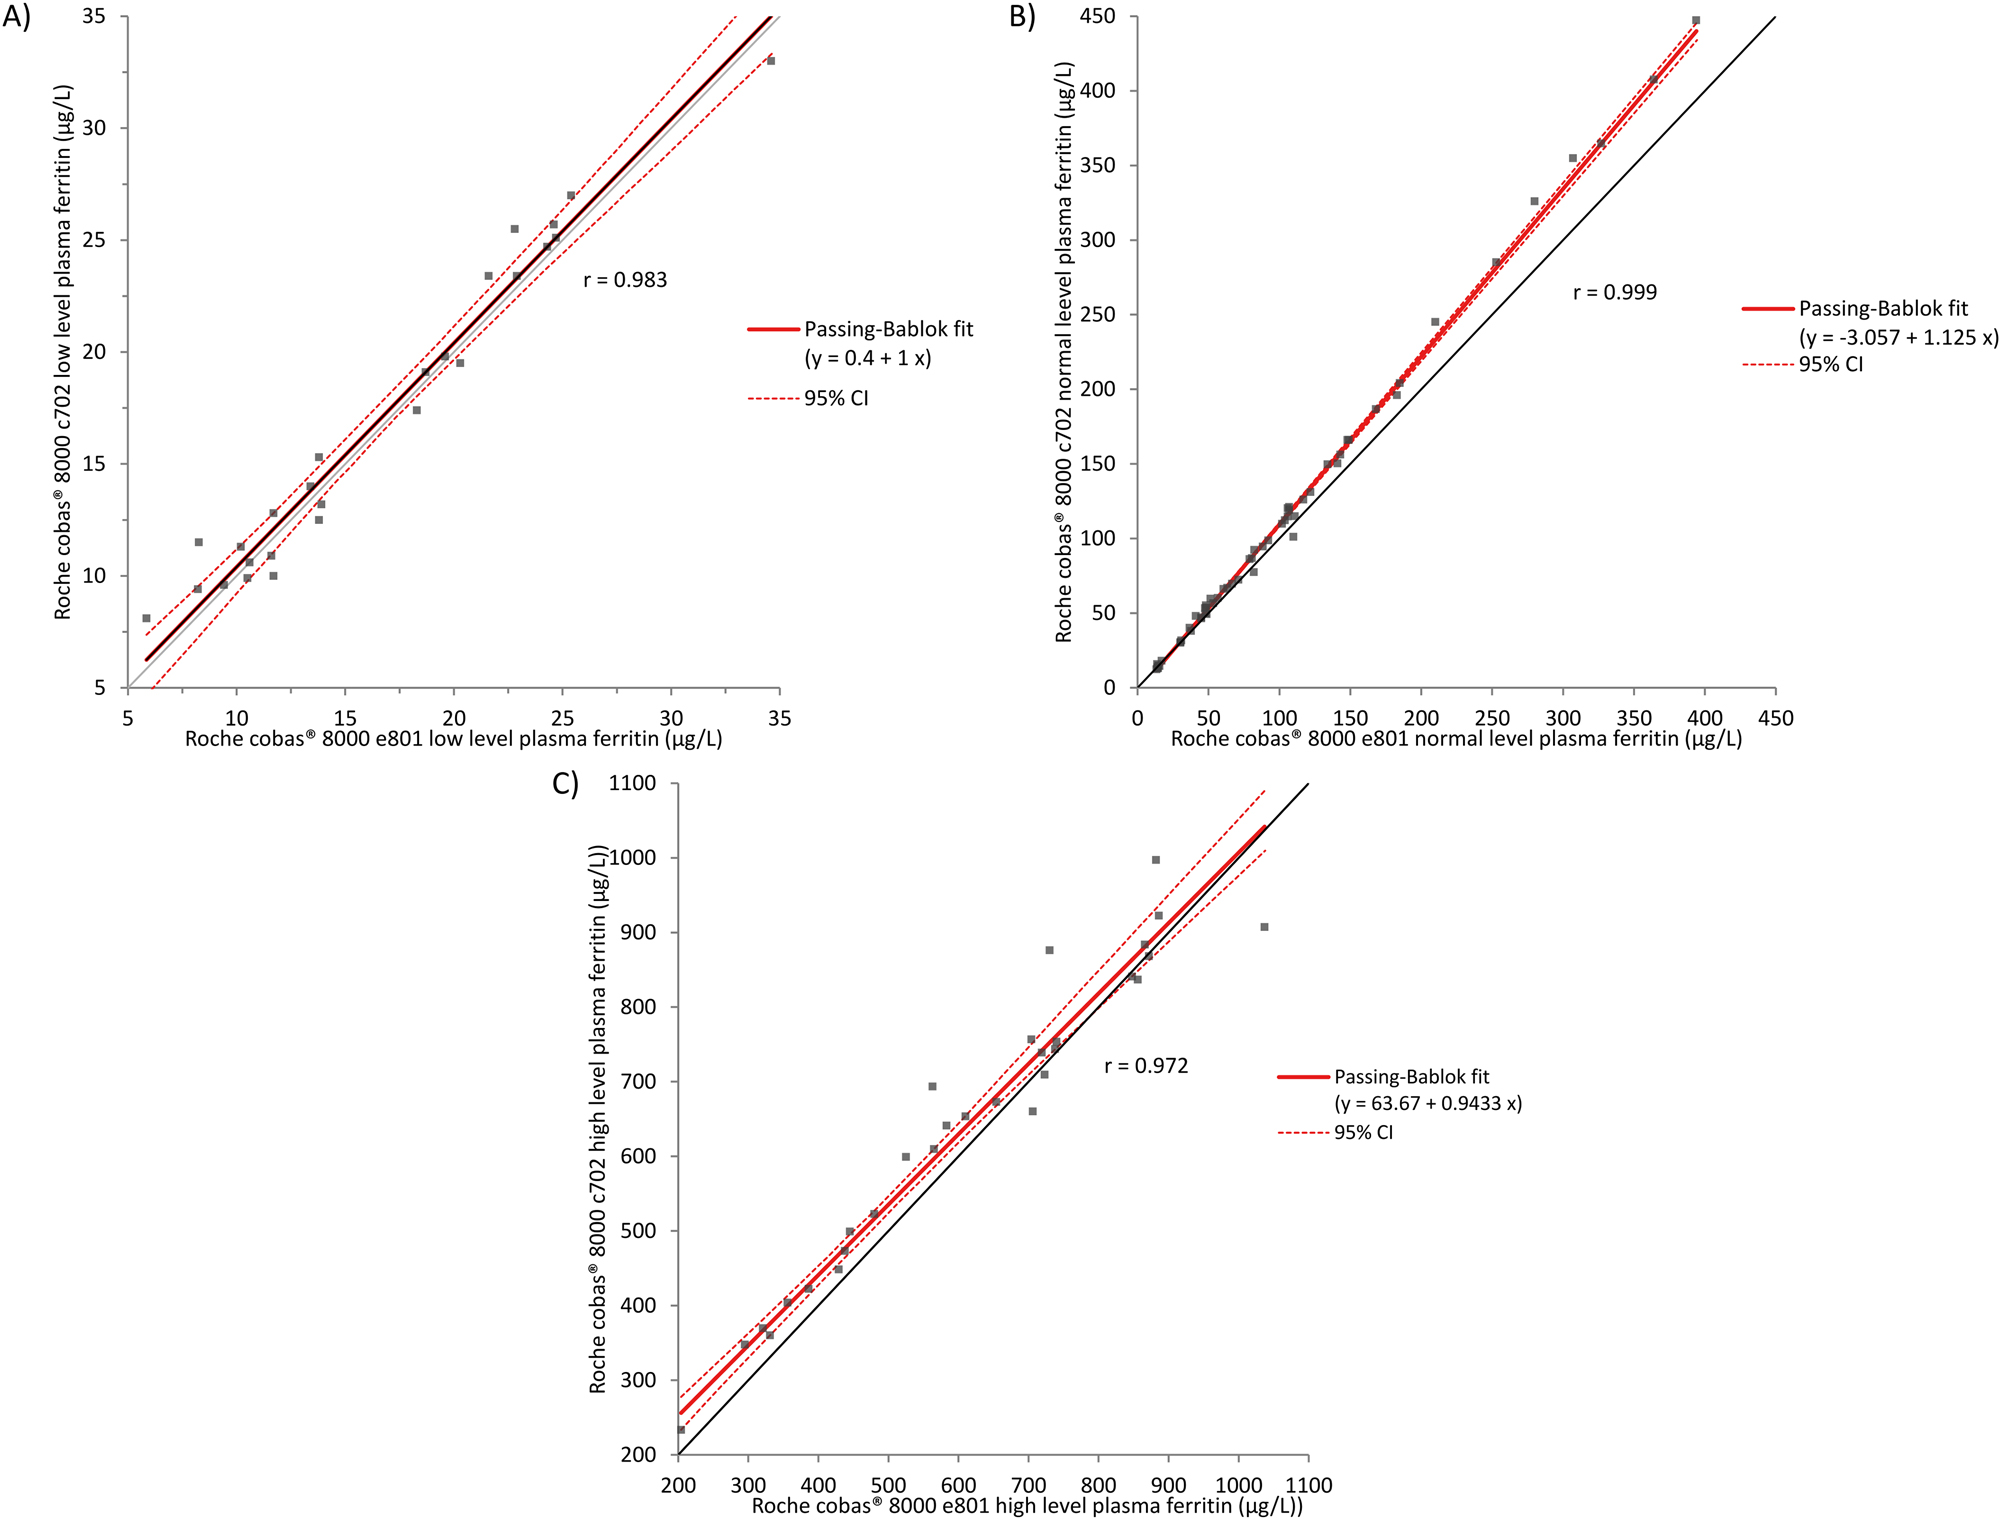
Comparison of cobas® e801 and cobas® c702 methods for low (A), normal (B) and high (C) plasma ferritin values by Passing–Bablok regression analysis. (A) Absence of a constant or proportional bias. (B) Presence of a constant and proportional bias. (C) Presence of a constant bias, no proportional bias.
Overall Bland-Altman analysis (not shown) showed that 95 % of the samples are within the d % criterion of Sciensano (16 %). For the ones exceeding this criterion, this resulted in no difference in clinical interpretation. The mean relative difference for low, normal and high plasma ferritin levels were respectively, 3.7 % (0.459 μg/L), 6.5 % (10.050 μg/L) and 6.3 % (31.670 μg/L), which are all below the bias d% of 7.2 %.
The reference values for ferritin are sex-dependent. The normal range for males is between 30 μg/L and 400 μg/L. For women, the normal range is situated between 13 μg/L and 150 μg/L. For the determination of the clinical sensitivity and specificity, each sample was classified according to sex and whether the value was low (n=26), normal (n=59) or high (n=30) using the Roche cobas® 8000 e801 as the reference method. The clinical sensitivity and specificity were between 95 and 100 % (Table 1).
Clinical sensitivity and specificity of Roche cobas® 8000 c702.
| Low ferritin concentration (men: 5–30 μg/L, n=18; women: 5–13 μg/L, n=8) | Normal ferritin concentration (men: 30–400 μg/L, n=30; women: 13–150 μg/L, n=29) | High ferritin concentration (men: >400 μg/L, n=15; women: >150 μg/L, n=15) | |
|---|---|---|---|
| Sensitivity, % | 100 | 95 | 100 |
| Specificity, % | 98 | 100 | 97 |
In conclusion, the immunoturbidimetric method of ferritin on cobas® 8000 c702 meets the requirements of verification for the determination and shows comparable clinical performance to the ECLIA method on cobas® 8000 e801. Importantly, implementation of the immunoturbidimetric method in our laboratory at UZ Brussels resulted in an overall improvement of the analytical turn-around-time (TAT) by 5 min. In our setting, the most important TAT reduction was achieved for the fertility panel (luteinizing hormone, follicle stimulating hormone, estradiol, progesterone and total human chorionic gonadotrophin) which has the highest share of analyses on the e-module (reduction of analytical TAT with ca. 18 min: 55 vs. 37 min).
-
Research ethics: 24266_FERRILAB. Ethical approved on 14/08/2024. The study was conducted in accordance with the Declaration of Helsinki (as revised in 2013).
-
Informed consent: Not applicable.
-
Author contributions: All authors have accepted responsibility for the entire content of this manuscript and approved its submission. SB and AVD were responsible for study design and statistics. KDV, PH and JD performed the analyses. EA reviewed the letter.
-
Use of Large Language Models, AI and Machine Learning Tools: None declared.
-
Conflict of interest: JDN, KVV, PH and AVD report reagents were provided by Roche Diagnostics, Belgium. EA reports a relationship with Roche Diagnostics that includes: speaking and lecture fees. AVD is a member of the Sciensano-expert commission for chemistry, electrophoresis, cardiac markers, immunoassays and therapeutic drug monitoring.
-
Research funding: None declared.
-
Data availability: The data that support the findings of this study are available from the corresponding author, AVD, upon reasonable request.
References
1. Knovich, MA, Storey, JA, Coffman, LG, Torti, SV, Torti, FM. Ferritin for the clinician. Blood Rev [Internet] 2009;23:95–104. https://doi.org/10.1016/j.blre.2008.08.001.Search in Google Scholar PubMed PubMed Central
2. CLSI. User verification of precision and estimation of bias; approved guideline, 3rd ed. EP15-A3. Wayne, PA: Clinical and Laboratory Standards Institute; 2014.Search in Google Scholar
3. CLSI. Establishing and verifying an extended measuring interval through specimen dilution and spiking, 1st ed. EP34. Budd, JR. Pittsburgh: Clinical and Laboratory Standards Institute; 2018.Search in Google Scholar
4. CLSI. Measurement procedure comparison and bias estimation using patient samples, 3rd ed. EP09. Budd, JR. Pittsburgh: Clinical and Laboratory Standards Institute; 2018.Search in Google Scholar
5. Aarsand, AK, Fernandez-Calle, P, Webster, C, Coskun, A, Gonzales-Lao, E, Diaz-Garzon, J, et al.. European federation of clinical chemistry and laboratory medicine 2025. https://biologicalvariation.eu/ [Accessed 19 Feb 2025].Search in Google Scholar
© 2025 the author(s), published by De Gruyter, Berlin/Boston
This work is licensed under the Creative Commons Attribution 4.0 International License.