Epidemiology characteristics of Epstein-Barr virus among children in Hangzhou from 2019 to 2023
-
Lin Chen
 and
Hongqiang Shen
and
Hongqiang Shen


Abstract
Objectives
Epstein-Barr virus (EBV) is ubiquitous, affecting up to 50 % of children and 90 % of adults globally. This study aimed to investigate the epidemiological characteristics of EBV among children in Hangzhou from 2019 to 2023.
Methods
From January 2019 to December 2023, all children with suspected EBV-related diseases in Children’s Hospital were enrolled. EBV DNA detection and statistical analysis were conducted.
Results
A total of 26,592 children were enrolled, of which 2,148 (8.07 %) tested positive for EBV DNA. In comparison to those in the pre‐COVID‐19 period (2019) and during- COVID‐19 period (2020–2022), the prevalence of EBV‐positive children significantly increased to 788 (10.35 %) in post-COVID-19 period (2023) (p<0.001). There was a gender difference in the EBV‐positive rate, with 7.66 % (1,157/15,095) of males and 8.62 % (991/11,497) of females positive (p<0.05). The age distribution of EBV remained an apparent consistent trend from 2019 to 2023, with the peak positive rates all observed in children aged 3–6 years and the lowest in children aged 0–1 year. IM is the most common disease accounting for 50.74 %. Compared to IM, HLH had significantly higher EBV DNA loads, while respiratory infections, leukemia and AA had significantly lower loads (p<0.05).
Conclusions
This is a large sample and the first comprehensive assessment that reveals the epidemiological characteristics of EBV among children in Hangzhou across the pre-, during- and post-COVID-19 periods, which provide a deeper understanding of EBV epidemiology to inform prevention, diagnosis, and treatment strategies.
Introduction
Epstein-Barr virus (EBV), a γ-herpesvirus, exhibits an extraordinarily high global infection rate, with over 90 % of adults eventually exposed to the virus, leading to lifelong infection [1], 2]. EBV is characterized by a complex transmission pattern, which includes oral contact, blood transfusion, and possibly even congenital transfer from mother to child [3], [4], [5]. This diversity in transmission routes significantly contributes to the virus’s high prevalence, posing substantial challenges for infection control and prevention.
EBV infection is prevalent among children, often affecting multiple bodily systems and resulting in various conditions, including infectious mononucleosis (IM), hemophagocytic lymphohistiocytosis (HLH), lymphoproliferative disorders, certain cancers, and autoimmune diseases [6], 7]. Clinical manifestations of EBV infection differ by age, with childhood infections typically being asymptomatic or mild, whereas up to 70 % of adolescent and adult infections may result in IM, characterized by symptoms such as sore throat, swollen lymph nodes, and fever [8]. Additionally, severe complications, including bronchitis/pneumonia and hepatic dysfunction, can also arise from EBV infection [9].
The epidemiological features of EBV exhibit significant variation across different geographical regions, socioeconomic backgrounds, and population groups. For instance, in developing countries, early childhood infections with EBV are common, while in developed countries, primary infections often occur during adolescence or early adulthood [10], 11]. Moreover, the clinical presentation of EBV infection is highly variable, ranging from asymptomatic chronic infections to severe acute illnesses. Therefore, in-depth research into the epidemiology of EBV can reveal the transmission patterns, risk factors for infection, and associations with related diseases.
In this study, we conducted a retrospective analysis of the positive rate of EBV DNA in our hospital from January 2019 to December 2023. This represents the first comprehensive assessment of EBV epidemiology across the pre-, during-, and post-COVID-19 periods. Through this study, we aim to provide a deeper understanding of EBV epidemiology to inform prevention, diagnosis, and treatment strategies.
Materials and methods
Patient enrollment and sample collections
This retrospective study enrolled 26,592 inpatients from Children’s Hospital, Zhejiang University School of Medicine, who underwent EBV nucleic acid testing between January 2019 and December 2023. EBV DNA testing was suspended in February and March 2020 because of COVID-19. Data were extracted from electronic medical records, encompassing demographic information, clinical diagnoses, laboratory findings, and EBV-related diseases. Diagnostic criteria for EBV-related diseases refer to these standards [12]. All procedures adhered to relevant guidelines and regulations, and the study received Ethical Approval from the Ethics Committee of Children’s Hospital, Zhejiang University School of Medicine (Approval Number: 2022-IRB-268).
Detection of EBV DNA
Peripheral blood samples (2 mL) were collected in tubes from each inpatient. Following collection, samples were transported to the clinical laboratory for analysis. The serum was separated by centrifugation at 1000 g for 20 min after clotting, and DNA was extracted for quantitative analysis using an ABI-7500 Real-Time PCR System (Applied Biosystems, USA). The EBV Nucleic Acid Detection Kit (PCR-Fluorescence Probing), manufactured by Shengxiang Biotechnology Co., Ltd, Changsha, China, was utilized following the manufacturer’s protocol. Real‐time PCR was performed as follows: 93 °C for 2 min and 40 cycles at 93 °C for 15 s and 55 °C for 45 s. Each assay included a negative quality control, a critical quality control, a positive quality control, and four positive quantity controls. Viral DNA loads were quantified by comparing the cycle threshold (Ct) values of the samples to a standard curve.
Statistical analysis
Statistical analyses were conducted using IBM SPSS Statistics, version 19.0. Fisher’s exact test was employed to compare prevalence based on patient age, gender, month of onset, or disease category. The Kruskal–Wallis rank-sum test was used for pairwise comparisons of EBV DNA loads among different disease groups. A p-Value <0.05 was considered statistically significant.
Results
Patient characteristics
As shown in Table 1 and Figure 1, specimens were enrolled from January 2019 to December 2023, including 24,444 with negative EBV DNA and 2,148 with positive EBV DNA. The overall positive rate for EBV DNA was 8.07 %. The yearly distribution of specimens was as follows: 5,391 in 2019, 3,599 in 2020, 5,115 in 2021, 4,877 in 2022, and 7,610 in 2023. The number (rate) of positive cases each year were 373(6.91 %), 307(8.53 %), 342(6.68 %), 338(6.93 %)and 788 (10.35 %), respectively. Compared to the pre‐COVID‐19 period (2019) and during-COVID‐19 period (2020–2022), the number (rate) of EBV‐positive specimens significantly increased to 788 (10.35 %) in post-post-COVID-19 period (2023) (p<0.001).
Comparison of epidemiological characteristics of EBV across the pre‐COVID‐19, COVID‐19 and post‐COVID‐19 periods.
| Pre‐COVID‐19 | COVID‐19 | Post‐COVID‐19 | ||||||
|---|---|---|---|---|---|---|---|---|
| 2019 | 2020 | 2021 | 2022 | 2023 | Total | χ2 value | p-Value | |
| Total positive specimens | 373 | 307 | 342 | 338 | 788 | 2,148 | 85.866 | <0.001 |
| Total specimens | 5,391 | 3,599 | 5,115 | 4,877 | 7,610 | 26,592 | ||
| Detection rate | 6.91 % | 8.53 % | 6.68 % | 6.93 % | 10.35 % | 8.07 % | ||
| Gender (positive/total) | 8.014 | 0.005 | ||||||
| Male | 177/3,063 | 183/2,026 | 191/2,954 | 172/2,716 | 434/4,336 | 1,157/15,095 | ||
| Female | 196/2,328 | 124/1,573 | 151/2,161 | 166/2,161 | 354/3,274 | 991/11,497 |

The monthly distribution of EBV across the pre‐COVID‐19, COVID‐19 and post‐COVID‐19 periods.
Regarding the gender distribution among EBV‐positive patients, 7.66 % (1,157/15,095) of males and 8.62 % (991/11,497) of females were positive, resulting in a male‐to‐female ratio of 1.16:1. There was a significant difference in the EBV positive rate between males and females (p<0.05).
Apparent trends in age distribution of EBV
The age distribution of EBV‐positive specimens exhibited a consistent trend from 2019 to 2023 (Figure 2A). Peak positivity rates were observed in children aged 3–6 years, followed by those aged 1–3 and 6–8 years, with the lowest rates in children aged 0–1 year (Figure 2B). The peak positivity rates each year were 6.10 % (175/1,434), 7.31 % (150/1,025), 4.89 % (160/1,633), 5.23 % (167/1,595), and 7.70 % (358/2,323), respectively.

Age distribution of EBV across the pre‐COVID‐19, COVID‐19 and post‐COVID‐19 periods.
Children were categorized into six age groups: 0–1 year, 1–3 years, 3–6 years, 6–8 years, 8–10 years, and ≥10 years. As age was not normally distributed, it was expressed as median (min, max) (Table 2). Chi-square tests were conducted on six age groups for all five years, indicating a significant difference in the percentage of positive specimens among four age groups (0–1 year, 1–3 years, 3–6 years, 6–8 years). In comparison to those in the pre‐COVID‐19 period (2019) and during-COVID-19 period (2020–2022), the number of EBV‐positive specimens among these four age groups increased significantly in post-COVID‐19 period (2023) (p<0.05). However, the other two age groups (8–10 years, ≥10 years) showed no difference each year.
Comparison of age distribution of EBV across the pre‐COVID‐19, COVID‐19 and post‐COVID‐19 periods.
| Pre‐COVID‐19 | COVID‐19 | Post‐COVID‐19 | ||||||
|---|---|---|---|---|---|---|---|---|
| 2019 | 2020 | 2021 | 2022 | 2023 | Total | χ2 value | p-Value | |
| Median (min, max) | 3y4m (15 h, 17y) | 3y6m (1d, 18y) | 3y11 m (7 h, 17y) | 4y6m (6 h, 18y) | 5y1m (4 h, 18y) | |||
| 0 years≤age<1 years | 3/977 (0.15) | 6/611 (0.49) | 7/658 (0.53) | 6/571 (0.52) | 14/728 (0.96) | 36/3,545 (1.01) | 10.872 | 0.028 |
| 1 years≤age<3 years | 110/1,537 (3.57) | 86/990 (4.34) | 85/1,409 (3.01) | 65/1,156 (2.81) | 151/1,675 (4.50) | 497/6,767 (7.34) | 18.167 | 0.001 |
| 3 years≤age<6 years | 175/1,434 (6.10) | 150/1,025 (7.31) | 160/1,633 (4.89) | 167/1,595 (5.23) | 358/2,323 (7.70) | 1,010/8,010 (12.60) | 38.913 | <0.001 |
| 6 years≤age<8 years | 44/536 (4.10) | 26/313 (4.15) | 33/421 (3.91) | 49/564 (4.34) | 141/1,004 (7.02) | 293/2,838 (10.32) | 23.410 | <0.001 |
| 8 years≤age<10 years | 18/391 (2.30) | 18/247 (3.64) | 31/420 (3.69) | 28/411 (3.40) | 53/743 (3.56) | 148/2,212 (6.69) | 3.432 | 0.488 |
| ≥10 years | 23/516 (2.22) | 21/413 (2.54) | 26/574 (2.26) | 23/580 (1.98) | 71/1,137 (3.12) | 164/3,220 (5.09) | 5.452 | 0.243 |
-
Significant differences (p<0.05) are shown in bold.
EBV was more prevalent in children aged 1–8 years, accounting for 83.8 % (1,800/2,148) of EBV-positive cases, compared to 14.5 % (312/2,148) in children aged>8 years and 1.7 % (36/2,148) in children aged 0–1 years.
Weak variation in seasonal distribution of EBV
As depicted in Table 3 and Figure 3, the total number and percentage of EBV-positive patients increased in 2023 (post-COVID‐19 period), particularly in September. However, seasonal variation in the month-by-month distribution of EBV was minimal. Over the five-year period, the overall positive rate of EB was basically stable, from 5.11 to 9.99 % per month. However, there were two periods during the COVID-19 period (2020–2022), the positive rate of EBV increased significantly, namely April and May 2020 and February 2021, respectively.
Comparison of seasonal distribution of EBV across the pre‐COVID‐19, COVID‐19 and post‐COVID‐19 periods.
| Pre‐COVID‐19 | COVID‐19 | Post‐COVID‐19 | ||||||
|---|---|---|---|---|---|---|---|---|
| 2019 | 2020 | 2021 | 2022 | 2023 | Total | χ2 value | p-Value | |
| January | 27/496 (5.44) | 11/308 (3.57) | 26/447 (5.81) | 12/400 (3.00) | 33/480 (6.87) | 109/2,131 (5.11) | 8.825 | 0.065 |
| February | 18/444 (4.05) | 0/0 (0) | 54/364 (14.83) | 13/351 (3.70) | 31/467 (6.63) | 116/1,626 (7.13) | 45.350 | <0.001 |
| March | 39/520 (7.50) | 0/0 (0) | 35/390 (8.97) | 23/420 (5.47) | 61/779 (7.83) | 158/2,109 (7.49) | 3.827 | 0.280 |
| April | 33/447 (7.38) | 21/228 (9.21) | 26/391 (6.64) | 31/390 (7.94) | 51/605 (8.42) | 162/2061 (7.86) | 1.781 | 0.776 |
| May | 31/471 (6.58) | 47/336 (13.99) | 24/458 (5.24) | 33/389 (8.48) | 88/696 (12.6) | 223/2,350 (9.49) | 30.702 | <0.001 |
| June | 21/480 (4.37) | 34/339 (10.02) | 37/545 (6.78) | 30/408 (7.35) | 79/675 (11.7) | 201/2,447 (8.21) | 23.637 | <0.001 |
| July | 33/476 (6.93) | 37/364 (10.16) | 26/433 (6.00) | 30/378 (7.93) | 63/616 (10.2) | 189/2,267 (8.34) | 8.861 | 0.064 |
| August | 33/406 (8.12) | 35/362 (9.66) | 26/375 (6.93) | 39/408 (9.55) | 65/567 (11.4) | 198/2,118 (9.35) | 6.353 | 0.174 |
| September | 34/435 (7.81) | 35/406 (8.62) | 26/445 (5.84) | 36/427 (8.43) | 99/590 (16.7) | 230/2,303 (9.99) | 43.058 | <0.001 |
| October | 33/424 (7.78) | 35/422 (8.29) | 24/390 (6.15) | 32/376 (8.51) | 62/608 (10.1) | 186/2,220 (8.38) | 5.343 | 0.253 |
| November | 37/371 (9.97) | 29/423 (6.85) | 23/419 (5.48) | 39/471 (8.28) | 84/707 (11.8) | 212/2,391 (8.87) | 16.745 | 0.002 |
| December | 34/421 (8.07) | 23/411 (5.59) | 15/458 (3.27) | 20/459 (4.35) | 72/820 (8.78) | 164/2,569 (6.38) | 20.885 | <0.001 |
-
Significant differences (p<0.05) are shown in bold.

Seasonal distribution of EBV across the pre‐COVID‐19, COVID‐19 and post‐COVID‐19 periods.
Chi-square tests conducted each month for all five years, indicated significant differences in the EBV-positive percentage in February, May, June, September, November and December (p<0.05).
Characteristics of EBV-related diseases
We analyzed the discharge diagnoses of 2,148 EBV-positive patients and mapped the distribution of related diseases. As shown in Figure 4, the top 10 diseases were IM (50.74 %), respiratory infection (7.08 %), atypical EBV infection (6.84 %), HLH (5.68 %), thrombocytopenia (5.26 %), leukemia (4.93 %), viral encephalitis (3.17 %), lymphoma (2.05 %), aplastic anemia (AA, 1.35 %)and sepsis (1.35 %). Other EBV-related diseases, such as Henoch-schonlein purpura (HSP), Chronic active EBV infection (CAEBV), immunodeficiency and systemic lupus erythematosus (SLE) accounted for 0.56 , 0.51, 0.33 and 0.14 %, respectively. Other rare diseases, including urticaria, sinusitis, myocarditis, arthritis, myositis, and connective tissue diseases, collectively accounted for 5.07 %.
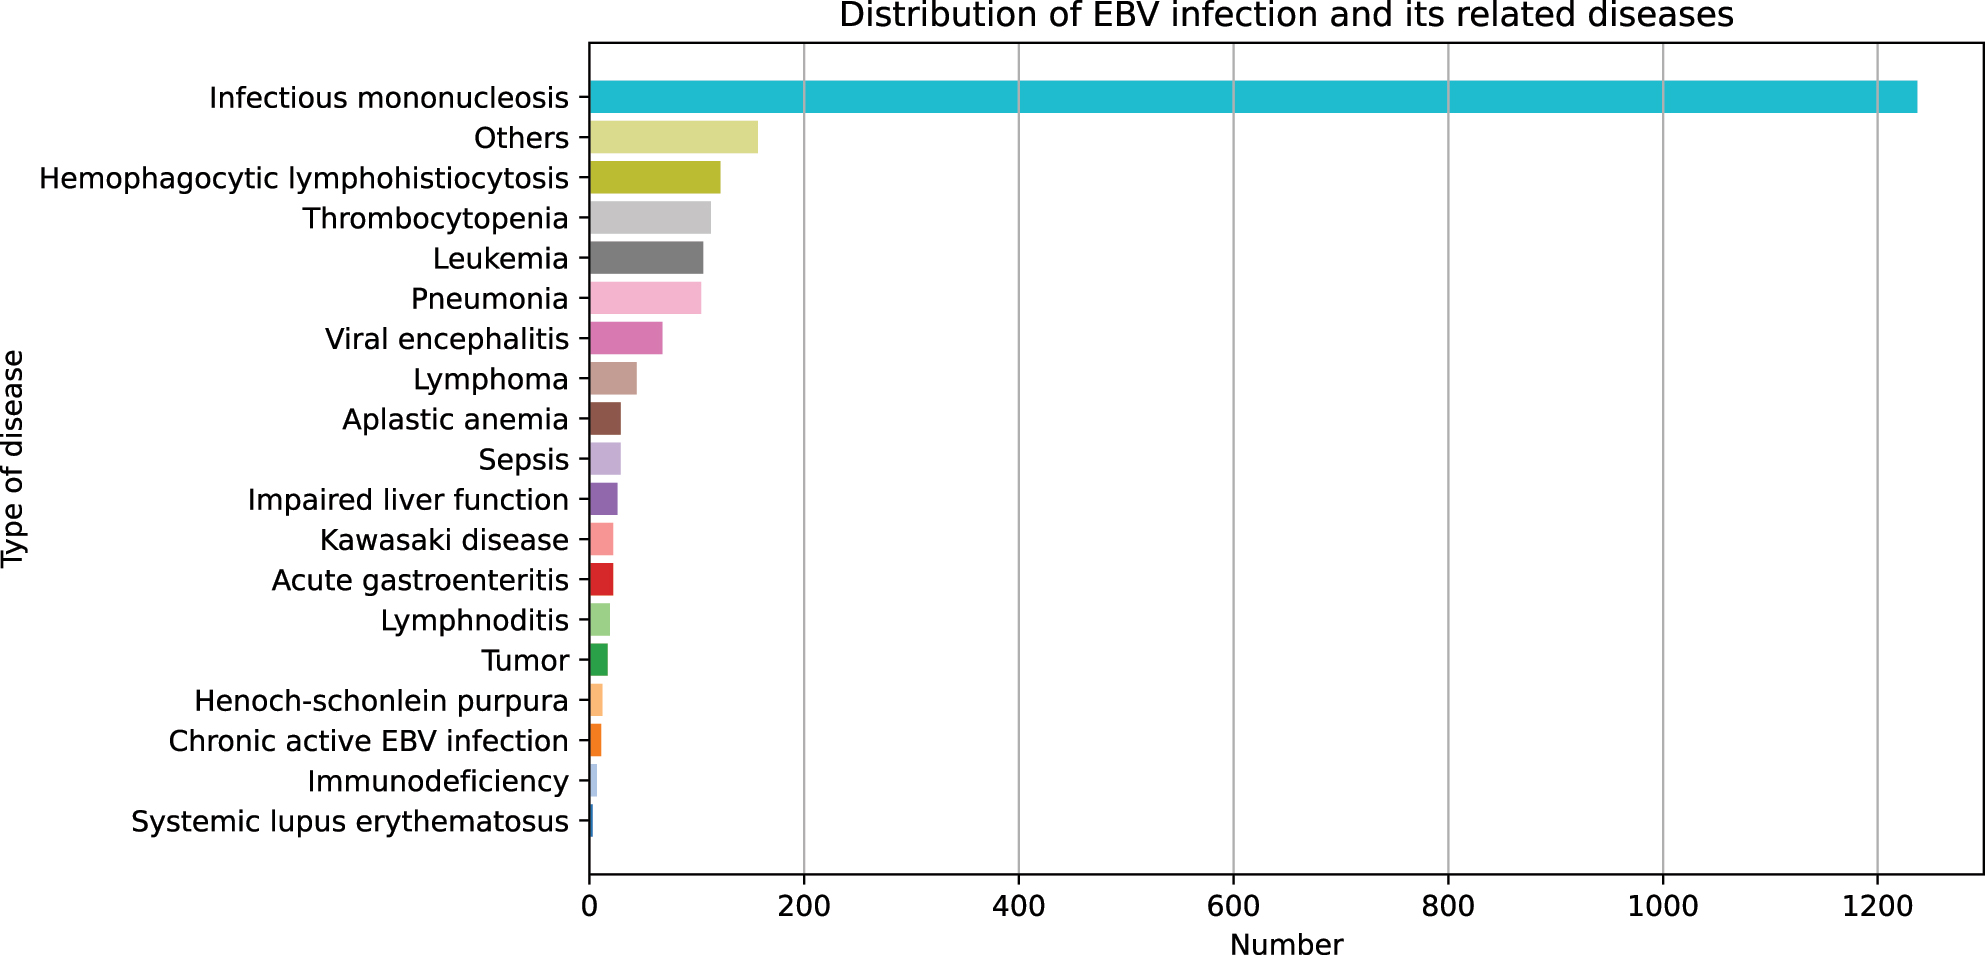
Distribution of EBV-related diseases.
The association of EBV DNA loads and related diseases
We further analyzed EBV DNA loads in 13 diseases closely associated with EBV infection and performed pairwise comparisons of their loads. The results showed that patients with HLH had the highest EBV DNA load, followed by CAEBV, IM and HSP (Table 4). Compared to IM, HLH had significantly higher EBV DNA loads, while respiratory infections, leukemia and AA had significantly lower loads (p<0.05).
Comparison of EBV DNA loads in different EBV-related diseases.
| Group | n | Median, copies/mL | Range, copies/mL | Compared with infectious mononucleosis |
|---|---|---|---|---|
| Infectious mononucleosis | 1,089 | 3.86×10³ | 4.01×10²−4.42×10⁶ | |
| Respiratory tract infection | 152 | 1.44×10³ | 4.03×10²−1.74×10⁶ | p<0.001 |
| Aplastic anemia | 29 | 1.16×10³ | 4.14×10²−4.09×10⁶ | p=0.002 |
| Lymphoma | 44 | 2.89×10³ | 4.20×10²–1.22×10⁷ | p=37.393 |
| Septicemia | 29 | 1.23×10³ | 4.15×10²−4.97×10⁴ | p=0.125 |
| Hemophagocytic syndrome | 122 | 1.06×10⁵ | 4.27×10²−1.98×10⁸ | p<0.001 |
| Leukemia | 104 | 1.36×10³ | 4.11×10²−1.65×10⁸ | p<0.001 |
| Viral encephalitis | 68 | 2.13×10³ | 4.39×10²−4.73×10⁵ | p=0.680 |
| Atypical EBV infection | 145 | 2.24×10³ | 4.01×10²−1.01×10⁷ | p=0.157 |
| Thrombocytopenia | 112 | 2.65×10³ | 4.12×10²−5.05×10⁵ | p=0.850 |
| Kawasaki disease | 22 | 1.10×10³ | 5.00×10²−1.60×10⁵ | p=1.825 |
| Allergic purpura | 12 | 3.52×10³ | 4.31×10²−4.12×10⁷ | p=67.511 |
| Chronic active EBV infection | 11 | 3.83×10³ | 4.11×10²−3.10×10⁴ | p=60.203 |
-
Significant differences (p<0.05) are shown in bold.
Discussion
Epstein-Barr virus (EBV) is ubiquitous, affecting up to 50 % of children and 90 % of adults globally [13].The pathogenesis of EBV involves infection of B-lymphocytic cells following the proliferation of epithelial cells in the oropharyngeal cavity, with the infected cells circulating through the bloodstream throughout the body, resulting in systemic infection [14]. Following primary infection, EBV can remain latent in resting memory B cells, from which it periodically reactivates. Due to its widespread infection and reactivation potential, combined with a wide spectrum of associated diseases, EBV has attracted more and more attention [15], [16], [17], [18].
Since the onset of COVID-19 pandemic, studies from different regions have demonstrated that Non-Pharmacological Interventions (NPIs) can significantly impact the incidence of EBV infection in children [19], [20], [21], [22]. Our study summarized data over a five-year span, encompassing the pre-, during-, and post-COVID-19 periods, and highlighted the latest epidemiological characteristics of EBV among children in Hangzhou.
In our study, the overall positive rate for EBV DNA was 8.07 %, aligning with previous studies (7.3–11.5 %) [20], 22]. Positive rates remained stable from 2019 to 2022 (6.91 , 8.53, 6.68, 6.93 %), but significantly increased to 10.35 % in 2023 (post- COVID‐19 period) (p<0.001). This rise may be attributed to the reactivation of the EBV virus following COVID-19 infection [23], [24], [25]. During the COVID-19 period (2020–2022), strict NPIs (such as wearing masks, washing hands, using disinfectants, social distancing, closing factories and schools, nucleic acid testing and vaccinations) effectively mitigated the local COVID-19 outbreak [26]. The lifting of NPIs in 2023 led to a surge in COVID-19 cases, potentially explaining the concurrent increase in EBV infections observed in our study. Chen et al. suggested that a reduction in CD8+ T cells in COVID-19 patients could lead to EBV reactivation [24]. Furthermore, Paolucci et al. observed a correlation between reduced CD8+ cells, EBV DNA levels, and COVID-19 severity [27]. The exact role of COVID-19 in reactivation of latent EBV and its consequences warrants further investigation.
Unlike previous studies, our study identified a significant gender difference, with a higher prevalence of EBV in females. It is well known that EBV infections in children are mainly transmitted through saliva (such as kissing) [28]. Thus, the greater possibility of girls being kissed more often, the decline in birth rates in recent years, and the imbalance in the ratio of male-to-female births may explain the increased percentage of EBV-positive girls [29], 30].
The age distribution of EBV remained consistent over the 5‐year period, with peak occurrence observed in children aged 3–6 years, followed by children aged 1–3 and 6–8 years, and the lowest in children aged 0–1 year. This pattern suggests that age distribution of EBV positivity is unaffected by COVID-19. The peak at ages 3–6 years may be linked to primary EBV infection typically occurring in Chinese children within this age range [31]. The lowest rate in infants aged 0–1 year may be due to maternal antibody protection and the immature immune system’s limited response capacity [32]. Given the complex and variable clinical manifestations of EBV, early diagnosis and timely antiviral intervention are crucial for favorable outcomes. Therefore, heightened attention to EBV DNA testing is warranted when children aged 3–6 years present with non-specific symptoms such as fever and sore throat.
Overall, seasonal variation in EBV positivity was weak over the 5‐year period. Despite the increased number and percentage of EBV-positive patients in 2023 (post-COVID-19 period), the monthly positive rate remained stable (5.11–9.99 %). Notably, during the COVID-19 period, two specific intervals (April-May 2020 and February 2021) saw significant increases in EBV positivity. This may be attributed to NPIs for COVID-19, leading to increased close contact with family members during lockdowns [13]. These findings strongly suggest that minimizing intimate parent-child contact, such as kissing, and improving lifestyle habits (e.g., avoiding shared cutlery) are important for reducing EBV infection.
As reported in the literature, EBV can cause a broad spectrum of diseases [8], 10], 33]. Our study also showed dozens of EBV-associated diseases (Figure 4). Among them, IM is the most common disease accounting for 50.74 %, which was consistent with previous studies [28], 34].
This study also illustrated the association between EBV DNA loads and various illnesses in EBV-positive children. High EBV loads were most common in HLH, followed by CAEBV, IM, and HSP, while low loads were more frequent in respiratory infections, leukemia, and AA. Previous studies have indicated that EBV DNA loads correlate with disease severity, with EBV-HLH exhibiting higher viral loads than other EBV-related diseases [35], [36], [37], consistent with our findings. These results revealed that the EBV DNA loads might be useful for evaluating disease activity and distinguishing IM from HLH as well as respiratory infections.
Limitation
Our study has some limitations. First, it was a retrospective, single-center study. Secondly, it lacked serological tests for analysis. Future prospective studies integrating molecular biology and serological assays across multiple centers are needed.
Conclusions
This large-scale, comprehensive assessment reveals the epidemiological characteristics of EBV-related diseases in children in Hangzhou across the before-, during- and post-COVID-19 periods.
-
Research ethics: The study received Ethical Approval from the Ethics Committee of Children’s Hospital, Zhejiang University School of Medicine (Approval Number: 2022-IRB-268).
-
Informed consent: Not applicable.
-
Author contributions: All authors contributed to the study conception and design. Material preparation, data collection and analysis were performed by Lin Chen, Hao Wang, Fengqing Cai and Wei Li. Experimental procedures and manuscript preparation were performed by Shuangshuang Huang, Zhijian Song, Xiaoshuai Bao and Hongqiang Shen. The first draft of the manuscript was written by Lin Chen and all authors commented on previous versions of the manuscript. All authors read and approved the final manuscript.
-
Use of Large Language Models, AI and Machine Learning Tools: None declared.
-
Conflict of interest: The authors state no conflict of interest.
-
Research funding: None declared.
-
Data availability: Not applicable.
References
1. Cai, J, Zhang, B, Li, Y, Zhu, W, Akihisa, T, Li, W, et al.. Prophylactic and therapeutic EBV vaccines: major scientific obstacles, historical progress, and future direction. Vaccines (Basel) 2021;9. https://doi.org/10.3390/vaccines9111290.Search in Google Scholar PubMed PubMed Central
2. Macsween, KF, Crawford, DH. Epstein-Barr virus-recent advances. Lancet Infect Dis 2003;3:131–40. https://doi.org/10.1016/s1473-3099(03)00543-7.Search in Google Scholar PubMed
3. Andronikou, S, Kostoula, A, Ioachim, E, Dimou, S, Ntourntoufi, A, Papanikolaou, S. Perinatal Epstein Barr virus infection in a premature infant. Scand J Infect Dis 1999;31:96–8. https://doi.org/10.1080/00365549950161970.Search in Google Scholar PubMed
4. Enok Bonong, PR, Buteau, C, Delage, G, Tanner, JE, Lacroix, J, Duval, M, et al.. Transfusion-related Epstein-Barr virus (EBV) infection: a multicenter prospective cohort study among pediatric recipients of hematopoietic stem cell transplants (TREASuRE study). Transfusion 2021;61:144–58. https://doi.org/10.1111/trf.16149.Search in Google Scholar PubMed
5. Rickinson, AB, Fox, CP. Epstein-Barr virus and infectious mononucleosis: what students can teach us. J Infect Dis 2013;207:6–8. https://doi.org/10.1093/infdis/jis647.Search in Google Scholar PubMed
6. Cohen, JI. Epstein-Barr virus infection. N Engl J Med 2000;343:481–92. https://doi.org/10.1056/nejm200008173430707.Search in Google Scholar PubMed
7. Tangye, SG. Genetic susceptibility to EBV infection: insights from inborn errors of immunity. Hum Genet 2020;139:885–901. https://doi.org/10.1007/s00439-020-02145-3.Search in Google Scholar PubMed
8. Fugl, A, Andersen, CL. Epstein-Barr virus and its association with disease - a review of relevance to general practice. BMC Fam Pract 2019;20:62. https://doi.org/10.1186/s12875-019-0954-3.Search in Google Scholar PubMed PubMed Central
9. Liu, M, Wang, X, Zhang, L, Feng, G, Zeng, Y, Wang, R, et al.. Epidemiological characteristics and disease burden of infectious mononucleosis in hospitalized children in China: a nationwide retrospective study. Virol Sin 2022;37:637–45. https://doi.org/10.1016/j.virs.2022.07.007.Search in Google Scholar PubMed PubMed Central
10. Balfour, HHJr., Verghese, P. Primary Epstein-Barr virus infection: impact of age at acquisition, coinfection, and viral load. J Infect Dis 2013;207:1787–9. https://doi.org/10.1093/infdis/jit096.Search in Google Scholar PubMed PubMed Central
11. Dowd, JB, Palermo, T, Brite, J, McDade, TW, Aiello, A. Seroprevalence of Epstein-Barr virus infection in U.S. children ages 6-19, 2003-2010. PLoS One 2013;8:e64921. https://doi.org/10.1371/journal.pone.0064921.Search in Google Scholar PubMed PubMed Central
12. Shi, J, Ma, W, Li, W. Epidemiologic features of children with Epstein-Barr virus associated diseases in Hangzhou, China. J Med Virol 2020;92:1277–82. https://doi.org/10.1002/jmv.25633.Search in Google Scholar PubMed
13. Yu, S, Yang, Q, Wu, J, Zhu, M, Ai, J, Zhang, H, et al.. Clinical application of Epstein-Barr virus DNA loads in Epstein-Barr virus-associated diseases: a cohort study. J Infect 2021;82:105–11. https://doi.org/10.1016/j.jinf.2020.11.027.Search in Google Scholar PubMed
14. Cao, Y, Xie, L, Shi, F, Tang, M, Li, Y, Hu, J, et al.. Targeting the signaling in Epstein-Barr virus-associated diseases: mechanism, regulation, and clinical study. Signal Transduct Targeted Ther 2021;6:15. https://doi.org/10.1038/s41392-020-00376-4.Search in Google Scholar PubMed PubMed Central
15. Houen, G, Trier, NH, Frederiksen, JL. Epstein-barr virus and multiple sclerosis. Front Immunol 2020;11:587078. https://doi.org/10.3389/fimmu.2020.587078.Search in Google Scholar PubMed PubMed Central
16. Houen, G, Trier, NH. Epstein-barr virus and systemic autoimmune diseases. Front Immunol 2020;11:587380. https://doi.org/10.3389/fimmu.2020.587380.Search in Google Scholar PubMed PubMed Central
17. Draborg, AH, Duus, K, Houen, G. Epstein-Barr virus in systemic autoimmune diseases. Clin Dev Immunol 2013;2013:535738. https://doi.org/10.1155/2013/535738.Search in Google Scholar PubMed PubMed Central
18. Pedersen, M, Asprusten, TT, Godang, K, Leegaard, TM, Osnes, LT, Skovlund, E, et al.. Predictors of chronic fatigue in adolescents six months after acute Epstein-Barr virus infection: a prospective cohort study. Brain Behav Immun 2019;75:94–100. https://doi.org/10.1016/j.bbi.2018.09.023.Search in Google Scholar PubMed
19. Ye, Z, Chen, L, Zhong, H, Cao, L, Fu, P, Xu, J. Epidemiology and clinical characteristics of Epstein-Barr virus infection among children in Shanghai, China, 2017-2022. Front Cell Infect Microbiol 2023;13:1139068. https://doi.org/10.3389/fcimb.2023.1139068.Search in Google Scholar PubMed PubMed Central
20. Wang, Y, Shi, L, Liu, D, Mao, Y, Liu, W. Changes in Epstein-Barr virus infections in the children before and after the COVID-19 pandemic in Zhengzhou, China. J Med Virol 2023;95:e28597. https://doi.org/10.1002/jmv.28597.Search in Google Scholar PubMed
21. Liang, Y, Hou, L, Hou, G, Zhang, X, Chen, L, Zhang, W. The influences of the COVID-19 pandemic on Epstein-Barr virus infection in children, Henan, China. J Infect 2023;86:525–8. https://doi.org/10.1016/j.jinf.2023.01.021.Search in Google Scholar PubMed PubMed Central
22. Shi, T, Huang, L, Tian, J. Prevalence of Epstein-Barr Viral DNA among children at a single hospital in Suzhou, China. J Pediatr 2022;98:142–6. https://doi.org/10.1016/j.jped.2021.05.006.Search in Google Scholar PubMed PubMed Central
23. Shafiee, A, Aghajanian, S, Athar, MMT, Gargari, OK. Epstein-Barr virus and COVID-19. J Med Virol 2022;94:4040–2. https://doi.org/10.1002/jmv.27823.Search in Google Scholar PubMed PubMed Central
24. Chen, T, Song, J, Liu, H, Zheng, H, Chen, C. Positive Epstein-Barr virus detection in coronavirus disease 2019 (COVID-19) patients. Sci Rep 2021;11:10902. https://doi.org/10.1038/s41598-021-90351-y.Search in Google Scholar PubMed PubMed Central
25. Xie, Y, Cao, S, Dong, H, Lv, H, Teng, X, Zhang, J, et al.. Clinical characteristics and outcomes of critically ill patients with acute COVID-19 with Epstein-Barr virus reactivation. BMC Infect Dis 2021;21:955. https://doi.org/10.1186/s12879-021-06638-y.Search in Google Scholar PubMed PubMed Central
26. Chen, D, Shao, Q, Ru, X, Chen, S, Cheng, D, Ye, Q. Epidemiological and genetic characteristics of norovirus in Hangzhou, China, in the postepidemic era. J Clin Virol 2024;172:105679. https://doi.org/10.1016/j.jcv.2024.105679.Search in Google Scholar PubMed
27. Paolucci, S, Cassaniti, I, Novazzi, F, Fiorina, L, Piralla, A, Comolli, G, et al.. EBV DNA increase in COVID-19 patients with impaired lymphocyte subpopulation count. Int J Infect Dis 2021;104:315–9. https://doi.org/10.1016/j.ijid.2020.12.051.Search in Google Scholar PubMed PubMed Central
28. Dunmire, SK, Verghese, PS, Balfour, HHJr. Primary Epstein-Barr virus infection. J Clin Virol 2018;102:84–92. https://doi.org/10.1016/j.jcv.2018.03.001.Search in Google Scholar PubMed
29. Nakatani, H. Ageing and shrinking population: the looming demographic challenges of super-aged and super-low fertility society starting from Asia. Glob Health Med 2023;5:257–63. https://doi.org/10.35772/ghm.2023.01057.Search in Google Scholar PubMed PubMed Central
30. Chen, Q, Wang, A, Song, X, Liu, X, Liu, Y, Wei, J, et al.. Fertility intentions to have a second or third child among the childbearing-age population in Central China under China’s three-child policy: a cross-sectional study. J Glob Health 2023;13:04072. https://doi.org/10.7189/jogh.13.04072.Search in Google Scholar PubMed PubMed Central
31. Huang, Y, Wei, C, Zheng, K, Zhao, D. The impact of serological features in Chinese children with primary or past Epstein-Barr virus infections. Virol J 2013;10:55. https://doi.org/10.1186/1743-422x-10-55.Search in Google Scholar PubMed PubMed Central
32. Zhang, Y, Zhao, Y, Jiang, Y, Wang, H. Effects of Epstein-Barr virus infection on liver function in children. J Infect Public Health 2020;13:260–5. https://doi.org/10.1016/j.jiph.2019.11.009.Search in Google Scholar PubMed
33. Nowalk, A, Green, M. Epstein-Barr virus. Microbiol Spectr 2016;4. https://doi.org/10.1128/microbiolspec.dmih2-0011-2015.Search in Google Scholar
34. Dunmire, SK, Hogquist, KA, Balfour, HH. Infectious mononucleosis. Curr Top Microbiol Immunol 2015;390:211–40. https://doi.org/10.1007/978-3-319-22822-8_9.Search in Google Scholar PubMed PubMed Central
35. Gao, LW, Xie, ZD, Liu, YY, Wang, Y, Shen, KL. Epidemiologic and clinical characteristics of infectious mononucleosis associated with Epstein-Barr virus infection in children in Beijing, China. World J Pediatr 2011;7:45–9. https://doi.org/10.1007/s12519-011-0244-1.Search in Google Scholar PubMed
36. Hutt-Fletcher, LM. Epstein-Barr virus entry. J Virol 2007;81:7825–32. https://doi.org/10.1128/jvi.00445-07.Search in Google Scholar
37. Kanakry, JA, Hegde, AM, Durand, CM, Massie, AB, Greer, AE, Ambinder, RF, et al.. The clinical significance of EBV DNA in the plasma and peripheral blood mononuclear cells of patients with or without EBV diseases. Blood 2016;127:2007–17. https://doi.org/10.1182/blood-2015-09-672030.Search in Google Scholar PubMed PubMed Central
© 2025 the author(s), published by De Gruyter, Berlin/Boston
This work is licensed under the Creative Commons Attribution 4.0 International License.
Articles in the same Issue
- Frontmatter
- Original Articles
- A comparative study between the Chrono-log 700 and the Sysmex CS-2100i analyzers for assessing ristocetin cofactor activity in patients with von Willebrand disease
- Evaluation of hemolysis index thresholds for 18 biochemistry assays: implications for laboratory-developed tests in the era of the IVDR
- Elevation of plasma podoplanin in Kawasaki disease
- Epidemiology characteristics of Epstein-Barr virus among children in Hangzhou from 2019 to 2023
- Mean platelet volume vs. optical platelet volume measurement: which is a better indicator for neonatal sepsis?