Evaluation for serum glucose standardization in clinical laboratories of Southern China by consecutive 6 years proficiency testing based on JCTLM-recommended reference methods
-
Xueying Lin
 ,
Xianzhang Huang
and
Liqiao Han
,
Xianzhang Huang
and
Liqiao Han

Abstract
Objectives
The accuracy of blood glucose measurement in clinical laboratories is vital for diabetes diagnosis. Trueness Verification Plan was carried out and analyzed for evaluating the standardization of serum glucose among clinical laboratories.
Methods
Trueness verification samples were distributed to clinical laboratories for three days measurement, and their target values were assigned by two certified reference laboratories. The relative bias, coefficient of variation (CV), and total error (TE) for each clinical laboratory were calculated and analyzed. Moreover, the Six Sigma metrics and Quality Goal Index were utilized to reflect the measurement quality of the clinical laboratories.
Results
The pass rates evaluated by bias, CV, and TE ranged from 45.2 % to 64.8 %, 96.8 %–98.9 %, and 83.9 %–97.1 % over the six years. The matched systems used in clinical laboratories demonstrated better accuracy than the un-matched systems. The pass rate by bias of hexokinase method is 53.1 %–78.6 %, while the glucose oxidase method is 29.2 %–52.2 %. Overall, 74.2 %–85.7 % of clinical laboratories achieved an acceptable level (both σ>3), and 35.2 %–61.4 % of laboratories reached a “world-class” level (both σ>6).
Conclusions
The quality for serum glucose measurement has been greatly improved. However, standardization among clinical systems still needs to be further promoted.
Introduction
The number of diabetic patients worldwide is 537 million in 2021 according to the International Diabetes Federation (IDF) Diabetes Atlas (10th Edition) [1], which increased by 74 million compared to 2019. This highlights a significant growth of global diabetes prevalence. Serum glucose is one of the key indicators for diabetes mellitus (DM), and its accuracy measurement in clinical laboratories is vital for the diagnosis, treatment and monitoring of DM.
However, there are various in vitro diagnostic (IVD) systems employed for serum glucose measurement in clinical laboratories with two main methods, the hexokinase method and glucose oxidase method. On the other hand, the matched systems, which the instrument, reagents and calibrators are from the same manufacturer, usually has a good traceability to SI unite, but there are also a variety of un-matched systems employed in clinical laboratories due to the economic factors. With the advancement of standardization efforts in serum glucose measurement, more and more laboratories achieved consistency and comparability results. The external quality assessment (EQA) program is widely implemented and took important part in promoting the measurement quality. The EQA program covering 4,571 laboratories in China demonstrated that the majority of participating laboratories submitted satisfactory results for serum glucose [2]. Besides, the EQA program conducted in multiple laboratories across Europe and United States in 2017 revealed that 92 %–94 % of the laboratories met the acceptance criteria for glucose measurement [3]. As we all know, the allowable total error (TEa), which is 8.0 % for glucose (CLIA’88), was usually used as the judgment criteria for EQA. Trueness Verification Plan (TVP) is more than an EQA with much stringent requirement for accuracy, the acceptance criteria for serum glucose is 3.6 %, less than 1/2 of CLIA’88 criteria. Besides, the target values are assigned by reference methods, which is more reliable and helps avoid biased deviations compared to the mean value of EQA. In addition, freeze-dried or spiked materials used as EQA samples may produce matrix effects. In contrast, fresh frozen serum is usually applied in TVP, which is considered of free from matrix effects. In general, TVP is more stringent for evaluating clinical measurement systems, and provides reliable information for laboratories to improve their measurement quality [4], as well as reflects measurement standardization among multiple systems.
In this study, the quality status of serum glucose measurement in Southern China was assessed by TVP program from 2017 to 2022. Two reference measurement procedures, the CDC hexokinase method (JCTLM database ID: NRMeth 34) [5, 6] and the NCCL ID LC-MS/MS method (JCTLM database ID: C14RMP11) [5, 7] were implemented for target value assignment by two certified reference laboratories. The standardization of glucose measurement in clinical laboratories in Southern China over the past six years was retrospectively evaluated and analyzed. The Six Sigma metrics and Quality Goal Index (QGI) were utilized to reflect the measurement quality and cause analysis toward to serum glucose standardization in the clinical laboratories.
Materials and methods
Samples collection, preparation and evaluation
Two concentrations of TVP samples were prepared from leftover serum pools, which collected in the clinical laboratory of Guangdong Provincial Hospital of Chinese Medicine, with the approval of the hospital’s Ethics Committee (No. Z2017-152). All collected serum samples were tested to ensure that they were not reactive for anti-human immunodeficiency virus antibodies (anti-HIV-1, anti-HIV-2), hepatitis C virus (HCV), treponema pallidum antibody (TP), and hepatitis B surface antigen (HBsAg). The samples were pooled and thoroughly mixed after being filtered with 0.45 μm and 0.22 μm filter membrane, then they were sub-packaged into 2.0 mL cryotube vials with 0.5 mL content of each vial, and stored at −70 °C till distributed to clinical laboratories by dry ice within three months.
The homogeneity, stability and commutability of the TVP samples were evaluated according to ISO GUIDE35:2017 [8], CLSI EP30-A [9] and our previous article [10]. Briefly, 15 samples were randomly selected and tested for 3 times for homogeneity, and one-way ANOVA was used for analysis. Stability at room temperature (R.T.), 2–8 °C, −80 °C and during transportation were evaluated, and regression analysis was used for data statistics. The commutability of TVP samples was assessed in four routine systems, Roche, Beckman, Mindray, and Maccura at 2017. The verification samples and 20 individual serum samples were measured twice simultaneously by reference method and routine systems. The data was analyzed by linear regression using the least square method.
Reference and clinical measurement systems
The target values were assigned by two reference laboratories accredited by the China National Accreditation Service for Conformity Assessment (CNAS), in compliance with ISO 15195 [11] and ISO/IEC 17025 [12]. The reference measurement service for serum glucose provide by the two reference laboratories are also listed in JCTLM database [13], and their proficiency is verified annually through their participation in IFCC External Quality assessment scheme for Reference Laboratories in Laboratory Medicine (RELA, Labs No. 61 and No. 65) [14]. The traceability of the results is ensured using certified reference material NIST 917c. TVP samples were analyzed three times each day over three consecutive days each year. The average value of the two reference laboratories was calculated as the target value (Supplementary Table S1).
There were 58, 62, 54, 70, 57, and 88 clinical laboratories reported their data in this TVP program from 2017 to 2022, respectively. The ratio for laboratories using matched system was 44.9 , 38.7, 46.3, 52.9, 57.9, and 62.5 % over the six years. Biochemical analysis systems of Roche, Beckman, Mindray, Hitachi, Siemens, Abbott, Olympus, Toshiba, Johnson & Johnson, and other manufacturers were used for serum glucose measurement. In the majority of clinical laboratories, the hexokinase method and the glucose oxidase method were the two mainly used methods. Besides, the oxygen electrode method, dry chemistry method, and O-toluidine method were used by a few laboratories. The situation of the clinical measurement systems were summarized in Table 1. Each concentration of the TVP samples was determined by clinical systems for 5 times on 3 consecutive days. The result of 15 data for each concentration is required to report.
The numbers of participating laboratories using different measurement systems and measurement methods in Trueness Verification Plan from 2017 to 2022.
| System | 2017 | 2018 | 2019 | 2020 | 2021 | 2022 | |
|---|---|---|---|---|---|---|---|
| Measurement system | Matched | 25 | 24 | 25 | 37 | 34 | 55 |
| Un-matched | 33 | 38 | 29 | 33 | 23 | 33 | |
| IVD system | Roche | 14 | 15 | 9 | 17 | 14 | 24 |
| Beckman | 19 | 22 | 23 | 26 | 15 | 29 | |
| Hitachi | 10 | 13 | 11 | 11 | 11 | 12 | |
| Mindray | 3 | 2 | 5 | 7 | 7 | 12 | |
| Abbott | 2 | 1 | 2 | 2 | 3 | 1 | |
| Siemens | 1 | 4 | 2 | 3 | 2 | 4 | |
| Olympus | 3 | 0 | 0 | 0 | 0 | 0 | |
| Toshiba | 0 | 2 | 0 | 1 | 2 | 1 | |
| Johnson & Johnson | 0 | 0 | 1 | 1 | 2 | 1 | |
| Others | 6 | 3 | 1 | 2 | 1 | 4 | |
| Measurement methods | Hexokinase method | 31 | 32 | 28 | 43 | 37 | 54 |
| Glucose oxidase | 26 | 30 | 23 | 24 | 18 | 31 | |
| Oxygen electrode | 1 | 0 | 2 | 2 | 0 | 1 | |
| Dry chemistry | 0 | 0 | 1 | 1 | 2 | 1 | |
| O-toluidine | 0 | 0 | 0 | 0 | 0 | 1 |
Statistical analysis for the Trueness Verification Plan
The reported data of each clinical laboratory were first inspected for outliers (truncated at±3SD). Bias between the tested mean and target value, as well as intra-laboratory precision (coefficient variation, CV) was calculated. The total error (TE) was calculated as |bias|+1.65CV. The allowable bias (Ba), allowable CV (CVa), and allowable total error (TEa) were derived from European Federation of Clinical Chemistry and Laboratory Medicine (EFLM) Biological Variation Database [15], which were 3.6 %, 3.8 % and 9.8 %, respectively. The laboratories are considered qualified if their bias, CV, and TE of both samples are all within the allowable limit. The pass rate refers to the percentage of qualified laboratories in total participating laboratories. The sigma value (σ) for each laboratory was calculated as (TEa-bias)/CV. The measurement capability of the clinical laboratory is acceptable with σ ≥3, and excellent with σ ≥6. Otherwise, the Quality Goal Index (QGI) was calculated as bias/(1.5CV) if σ <3, which indicates the results of the laboratory is not acceptable. QGI<0.8, 0.8≤QGI≤1.2, QGI>1.2 indicate the precision, both precision and accuracy, and accuracy need to be improved [16], [17], [18].
Microsoft Excel 2010, GraphPad Prism 9.3.1, SPSS 17.0 were used for data analysis and presentation.
Results
Characteristic of the TVP samples
The TVP samples were homogeneous with p value >0.05 (Supplementary Table S2), as well as stable at R.T. for 8 h, at 2–8 °C for 24 h, at −80 °C for at least 6 months, and during transportation for 4 days (Supplementary Table S3). The commutability of TVP samples at 2017 was also confirmed to be commutable in four clinical commonly used systems, Roche, Beckman, Mindray, and Maccura system (Supplementary Figure S1).
The pass rate of clinical laboratories
From 2017 to 2022, the relative bias in each year across all clinical laboratories ranged as: −7.9 %–8.7 %, −5.5 %–9.8 %, −6.8 %–8.3 %, −7.6 %–7.9 %, −3.90 %–8.0 %, −7.0 %–12.7 %, respectively. The CV ranged as: 0.10 %–4.93 %, 0.13 %–9.36 %, 0.16 %–5.63 %, 0.12 %–7.39 %, 0.12 %–4.05 %, 0.12 %–6.22 %, respectively. The TE were 1.08 %–14.73 %, 1.07 %–16.18 %, 0.91 %–14.15 %, 0.85 %–17.18 %, 0.56 %–11.04 %, 0.94 %–17.23 %, respectively. The average bias, CV and TE for the 12 TVP samples across all clinical laboratories meet the specified criteria, the observed average bias all displayed a positive trend (Table 2).The pass rates evaluated by relative bias, CV and TE for all laboratories were 45.2 %–64.8 %, 96.8 %–98.9 %, and 83.9 %–97.1 %, respectively, for the six years, the details have been listed in Table 2.
The average bias, CV and TE and pass rates for the clinical laboratories in Trueness Verification Plan from 2017 to 2022.
| Sample no. | Average, % | Pass rate, % by | ||||
|---|---|---|---|---|---|---|
| Bias | CV | TE | Bias | CV | TE | |
| 2017-A | 0.56 | 1.11 | 4.52 | 48.3 | 98.3 | 86.2 |
| 2017-B | 0.82 | 1.17 | 4.89 | |||
| 2018-A | 2.86 | 1.20 | 5.57 | 45.2 | 96.8 | 83.9 |
| 2018-B | 3.40 | 1.15 | 5.70 | |||
| 2019-A | 0.66 | 1.43 | 5.19 | 64.8 | 98.2 | 94.4 |
| 2019-B | 1.58 | 1.09 | 4.57 | |||
| 2020-A | 0.21 | 1.12 | 4.65 | 51.4 | 97.1 | 97.1 |
| 2020-B | 1.07 | 1.03 | 4.74 | |||
| 2021-A | 2.41 | 1.10 | 4.57 | 54.4 | 98.3 | 93.0 |
| 2021-B | 2.53 | 1.01 | 4.45 | |||
| 2022-A | 2.30 | 1.15 | 4.93 | 58.0 | 98.9 | 86.4 |
| 2022-B | 2.95 | 1.08 | 5.23 | |||
The pass rate of matched systems vs. un-matched systems
The pass rate by bias of matched systems and un-matched systems are 62.5 %–70.6 % and 30.4 %–62.1 %, respectively. The pass rate by CV for the two kinds of systems is 91.7–100.0 % and 93.9–100.0 %, and the pass rate by TE is 83.3–100.0 % and 75.8–93.9 %. The measurement results of each clinical laboratory classified by matched and un-matched systems over the six years are displayed in Figure 1.

The measurement results of matched-systems and un-matched systems from clinical laboratories in the Trueness Verification Plan from 2017 to 2022. The quadrilateral box denote the allowable range of relative bias. (A) In 2017, 64.0 % (16/25) of the measurement results for the matched systems were within the allowable range of relative bias, and 36.4 %(12/33) for un-matched systems. (B) In 2018, 62.5 % (15/24) of the measurement results for the matched systems were within the allowable range of relative bias, and 34.2 %(13/38) for un-matched systems. (C) In 2019, 68.0 % (17/25) of the measurement results for the matched systems were within the allowable range of relative bias, and 62.1 %(18/29) for un-matched systems. (D) In 2020, 64.9 % (24/37) of the measurement results for the matched systems were within the allowable range of relative bias, and 36.4 % (12/33) for un-matched systems. (E) In 2021, 70.6 % (24/37) of the measurement results for the matched systems were within the allowable range of relative bias, and 30.4 % (7/23) for un-matched systems. (F) In 2022, 65.5 % (36/55) of the measurement results for the matched systems were within the allowable range of relative bias, and 45.5 % (15/33) for un-matched systems.
The pass rate of hexokinase method vs. glucose oxidase method
There are several methods used for serum glucose measurement in this TVP program from 2017 to 2022. And the hexokinase method and glucose oxidase method are the most commonly used, accounting for 51.6 %–64.9 % and 31.6 %–48.4 %, respectively. The pass rates for the two methods by bias are 53.1 %–78.6 % and 29.2 %–52.2 %, respectively. The pass rates by CV for the two methods are 93.8–100.0 % and 94.4–100.0 %, and the pass rates by TE are 75.0–98.2 % and 64.5–95.8 %. All have been summarized in Table 3.
The pass rate by bias, CV and TE for hexokinase method and glucose oxidase method in Trueness Verification Plan from 2017 to 2022.
| Year | Pass rate by bias, % | Pass rate by CV, % | Pass rate by TE, % | |||
|---|---|---|---|---|---|---|
| (Passed labs./total labs.) | (Passed labs./total labs.) | (Passed labs./total labs.) | ||||
| Hexokinase method | Glucose oxidase method | Hexokinase method | Glucose oxidase method | Hexokinase method | Glucose oxidase method | |
| 2017 | 61.3 (19/31) | 34.6 (9/26) | 96.8 (30/31) | 100.0 (26/26) | 87.1 (27/31) | 84.6 (22/26) |
| 2018 | 53.1 (17/32) | 36.7 (11/30) | 93.8 (30/32) | 100.0 (30/30) | 75.0 (24/32) | 93.3 (28/30) |
| 2019 | 78.6 (22/28) | 52.2 (12/23) | 96.4 (27/28) | 100.0 (23/23) | 96.4 (27/28) | 91.3 (21/23) |
| 2020 | 60.5 (26/43) | 29.2 (7/24) | 97.7 (42/43) | 95.8 (23/24) | 97.7 (42/43) | 95.8 (23/24) |
| 2021 | 64.9 (24/37) | 33.3 (6/18) | 100.0 (37/37) | 94.4 (17/18) | 97.3 (36/37) | 83.3 (15/18) |
| 2022 | 64.8 (35/54) | 48.4 (15/31) | 100.0 (54/54) | 96.8 (30/31) | 98.2 (53/54) | 64.5 (20/31) |
The pass rate for different biochemical analyzers
The commonly used biochemistry analyzers were Roche, Beckman, Hitachi, Mindray, Siemens, and Abbott, their performance are also evaluated in this six-year TVP program. The pass rate by bias for the six detection systems are 64.3 %–88.9 %, 40.0 %–62.1 %, 15.4 %–63.6 %, 0.0 %–71.4 %, 0.0 %–75.0 %, and 0.0 %–100.0 %, respectively, which exhibited significant variability, especially for the latter three systems due to the limited number of participating biochemical analyzer systems (Figure 2).
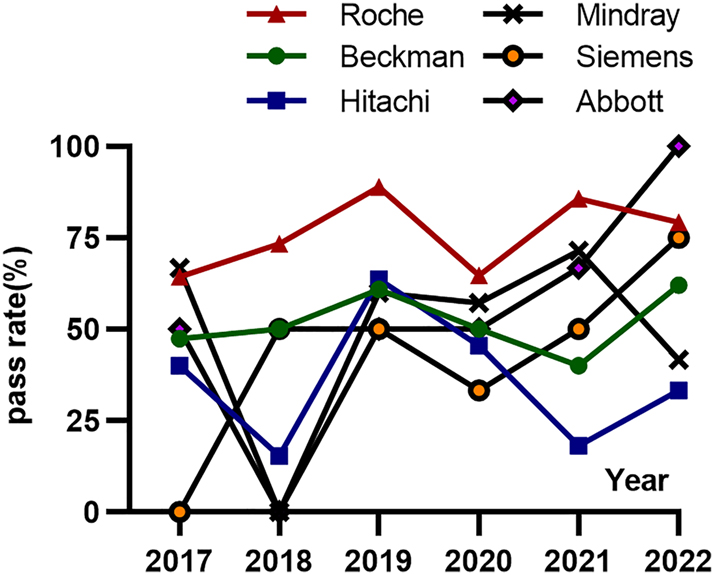
The average pass rate evaluated by relative bias for six biochemistry analysis systems in Trueness Verification Plan from 2017 to 2022. The pass rate by bias over the six years for Roche system is 64.3 %–88.9 %, for Beckman system is 40.0 %–62.1 %, for Hitachi system is 15.4 %–63.6 %, for Mindray system is 0.0 %–71.4 %, for Siemens system is 0.0 %–75.0 %, and for Abbott system is 0.0 %–100.0 %, respectively.
Analyzed by Six Sigma metrics and QGI for clinical laboratories
Six Sigma metrics is a management methodology aimed at improving the quality and repeatability of inspection results by reducing errors and variability. Sigma value (σ)=6” signifies that 99.99966 % of the results are error-free, with only 3.4 defects per million opportunities (DPMO), which is considered as “world-class” measurement level. Otherwise, “σ=3” indicates that 93.3 % of the results are error-free, corresponding to 66807 DPMO, which is considered as “poor” measurement [17, 18]. In this program, the sigma values were also calculated for each clinical laboratory, which has been shown in Figure 3. The laboratories with σ ≥6 for both concentrations, indicate their measurement capability is qualified as “world-class”, account for 41.4 %, 45.2 %, 35.2 %, 51.4 %, 61.4 %, and 45.5 %, respectively, from 2017 to 2022. Laboratories with σ ≥3 for both concentrations were considered to have an “acceptable” measurement capability, with percentages of 81.0 , 74.2, 79.6, 85.7, 84.2, and 76.1 % over the six years. Otherwise, the measurement capability of laboratories were regarded as “unacceptable” with σ <3, were 6.9 %, 4.8 %, 7.4 %, 1.4 %, 8.8 %, and 9.1 %, respectively.

Sigma values for two concentration samples of each laboratory from 2017 to 2022. The x-axis and y-axis represent the sigma values of sample A and sample B for each laboratory. The small dots in the upper right quadrant represent the laboratories with σ ≥6, indicate their measurement capability is “world-class” The small dots in the bottom-left box represent the laboratories with σ <3, indicate their measurement capability are “unacceptable”. The other small dots represent the laboratories with 3≤σ<6, indicate their measurement capability is “acceptable” The measurement capability for laboratories with σ≥6, σ≥3 and σ<3 for both samples in (A) 2017 were 41.4 %, 81.0 % and 6.9 %, respectively; (B) 2018 were 45.2 %, 74.2 % and 4.8 %, respectively; (C) 2019 were 35.2 %, 79.6 % and 7.4 %, respectively; (D) 2020 were 51.4 %, 85.7 % and 1.4 %, respectively; (E) 2021 were 61.4 %, 84.2 % and 8.8 %, respectively; (F) 2022 were 45.5 %, 76.1 % and 9.1 %, respectively.
The QGI was calculated to evaluate the factors leading to unsatisfactory results for laboratories with σ <3. The percentage of laboratories with QGI values more than or equal to 1.2 ranged from 0.0 to 79.0 %, indicate the main factor of accuracy. While the percentage of laboratories with QGI values less than 0.8 ranged from 9.1 % to 100.0 %, indicate the main factor of precision. The percentage of laboratories with QGI values between 1.2 and 0.8 varied from 0.0 to 27.3 % over the six years, indicate the factors of both accuracy and precision. The details are shown in Table 4.
Percentage of laboratories with sigma value <3 by Quality Goal Index (QGI).
| Sample no. | Number of laboratories with σ <3 | Percentage of laboratories, % | ||
|---|---|---|---|---|
| QGI<0.8 | 0.8≤QGI<1.2 | QGI≥1.2 | ||
| 2017-A | 7 | 57.1 | 0.0 | 42.9 |
| 2017-B | 8 | 50.0 | 0.0 | 50.0 |
| 2018-A | 11 | 9.1 | 27.3 | 63.6 |
| 2018-B | 8 | 37.5 | 0.0 | 62.5 |
| 2019-A | 10 | 40.0 | 0.0 | 60.0 |
| 2019-B | 5 | 20.0 | 20.0 | 60.0 |
| 2020-A | 7 | 71.4 | 14.3 | 14.3 |
| 2020-B | 4 | 100.0 | 0.0 | 0.0 |
| 2021-A | 7 | 28.6 | 0.0 | 71.4 |
| 2021-B | 6 | 33.3 | 16.7 | 50.0 |
| 2022-A | 13 | 15.4 | 23.1 | 61.5 |
| 2022-B | 19 | 15.8 | 5.3 | 79.0 |
Discussion
Serum glucose is an important indicator for diabetes mellitus (DM) and impaired fasting glucose (IFG), its accurate measurement is crucial for the diagnosis, intervention and monitoring of millions of related patients. With the advancement of standardization in clinical laboratories, the metrological comparability of laboratory results can be enhanced, and unnecessary inter-laboratory variation in testing and reporting can be reduced [19], [20], [21]. Standardization of serum glucose measurement has made significant progress in recent years, primarily due to the traceability to reference system and the promotion by EQA programs. The EQA results for serum glucose from several countries demonstrated that the pass rates of clinical laboratories are over 90 % [2, 3]. However, there is a scarcity of reports on the performance of serum glucose measurement for clinical laboratories in TVP programs. Therefore, this study conducted the retrospective analysis of 54–88 clinical laboratories participating in the TVP in Southern China for six years. Although the number of laboratories was limited, it provides insight into the current situation of standardization for serum glucose measurement.
The use of commutable samples allows the transferability of participating laboratory performance to clinical samples [22]. The commutability of the TVP samples has been verified in four routine measurement systems and showed commutable enough for this program, avoid the bias of matrix effect. As well as the homogeneity and stability meet the requirement. In this TVP program, the precision and total error of the participating laboratories demonstrated excellent, with a pass rate of over 96.8 % and 83.9 %. However, the pass rate by bias was comparatively lower than expected, only 45.2 %–64.8 %. Moreover, the relative bias among all laboratories compared to target value ranged from −7.9 % to 12.7 %. Several factors were analyzed to determine the causes, including the use of matched vs. un-matched systems, different methods such as hexokinase method vs. glucose oxidase method, and different brands of biochemical analyzers utilized, as well as the Six Sigma value and QGI were calculated for analysis.
The matched systems usually with good traceability to SI, demonstrate superior trueness compared to un-matched systems. There has been a growing trend among laboratories to adopt matched systems, with over half of them implementing matched systems since 2020. The hexokinase method and glucose oxidase method for serum glucose measurement are the two main methods used in clinical laboratories. The hexokinase method achieved a higher pass rate by bias compared to the glucose oxidase method in this TVP program, which is consistence with other research [23]. For the clinical systems used in this TVP program, Roche, Beckman, Hitachi, Mindray, Siemens, and Abbott were the predominant manufacturers of biochemical analyzers used for glucose measurement, and Roche systems exhibited the highest pass rate by bias through the six years. However, the limited number of each brand participating in the TVP program leading to a substantial variation for their pass rate, which may not accurately reflect the performance across all analyzer systems. In addition, the limited sample size per year restricted to conduct a comprehensive comparison among different IVDs classified of matched and un-matched system.
Six Sigma metrics is a useful tool for monitoring the measurement quality in clinical laboratories, and the application of Six Sigma metrics to improve the quality of clinical laboratories has been in place for nearly 20 years [24]. The frequency of defects is defined by sigma metrics, where higher sigma values indicate a lower likelihood of defects occurring [18]. The sigma values vary with the target value of Total Allowable Error (TEa) [25]. In this study, the sigma values were calculated for the two samples of each laboratory with the TEa provided by EFLM [15]. From 2017 to 2022, an acceptable measurement level (both σ>3) was achieved by 74.2 %–85.7 % of laboratories, and a “world-class” measurement level (both σ>6) was reached by 35.2 %–61.4 % of laboratories. On the other hand, 1.4 %–9.1 % of laboratories had σ below three for both samples. The QGI was calculated followed to evaluate the factors contributing to unsatisfactory results for the laboratories with σ <3. The performance of accuracy was identified as the major issue compared to precision and total error for most laboratories. The specificity of routine methods, the poor quality and traceability of calibrators may contribute to subpar measurement performance for laboratories that did not meet the qualifications. Furthermore, the measurement results in clinical laboratories can be impacted by the use of a single calibrator, as well as the concentration and accuracy of the calibrator.
Conclusions
The majority of clinical laboratories demonstrated good precision and low total error in serum glucose measurement. However, when more stringent criteria was applied, such as in Trueness Verification Plan, there is still potential for improvement in achieving accurate and standardization for serum glucose measurement in clinical laboratories. Six Sigma metrics and QGI plays a vital role in assessing the measurement capability and quality for serum glucose in clinical laboratories, as well as in conducting cause analysis. Their application holds paramount importance for facilitating the standardization of glucose testing procedures in clinical laboratories.
Award Identifier / Grant number: 2021A1515220149
Funding source: Research Fund for Bajian Talents of Guangdong Provincial Hospital of Chinese Medicine
Award Identifier / Grant number: BJ2022KY04
Funding source: Specific Research Fund for TCM Science and Technology of Guangdong Provincial Hospital of Chinese Medicine
Award Identifier / Grant number: YN2020QN19
Award Identifier / Grant number: YN2022QN16
Award Identifier / Grant number: YN2023QN07
Award Identifier / Grant number: YN2019QL03
Funding source: National Key Research and Development Program of China
Award Identifier / Grant number: 2022YFC3602300
Award Identifier / Grant number: 2022YFC3602301
Funding source: Guangdong Medical Science and Technology Research Fund
Award Identifier / Grant number: A2024336
Acknowledgments
We appreciate the organization by Guangdong Center of Clinical Laboratory for the Trueness Verification Plan in Southern China from 2017 to 2022.
-
Research ethics: The collection of leftover serum samples was approved by the Ethics Committee of the Second Affiliated Hospital of Guangzhou University of Chinese Medicine (No. Z2017-152).
-
Informed consent: Because leftover samples involved in this study was anonymous, the ethics committee allowed the exemption of informed consent.
-
Author contributions: All authors confirmed the significant contributions to the design, analysis and interpretation of data, draft and revise the article.
-
Competing interests: The authors state no conflict of interest.
-
Research funding: This work was supported by the National Key Research and Development Program of China (No. 2022YFC3602300, 2022YFC3602301), the Research Fund for Bajian Talents of Guangdong Provincial Hospital of Chinese Medicine (No. BJ2022KY04); Guangdong Basic and Applied Basic Research Foundation (No. 2021A1515220149); Guangdong Medical Science and Technology Research Fund (No. A2024336) and the Specific Research Fund for TCM Science and Technology of Guangdong Provincial Hospital of Chinese Medicine (No. YN2022QN16, YN2020QN19, YN2023QN07).
-
Data availability: Data available on request from the authors.
References
1. IDF Diabetes Atlas. https://diabetesatlas.org/ [Accessed 8 Jun 2023].Search in Google Scholar
2. Zhong, K, Yuan, S, Wang, ZG, Zhao, HJ, Wang, W, Zhang, CB, et al.. Application of ISO 13528 robust statistical method for external quality assessment of blood glucose measurements in China. Accred Qual Assur 2014;19:397–405.10.1007/s00769-014-1078-zSearch in Google Scholar
3. Mosca, A, Quercioli, M, Paleari, R. The analytical performance of laboratory plasma glucose and HbA1c measurements are largely acceptable. Acta Diabetol 2020;57:215–9. https://doi.org/10.1007/s00592-019-01408-4.Search in Google Scholar PubMed
4. Badrick, T, Punyalack, W, Graham, P. Commutability and traceability in EQA plans. Clin Biochem 2018;56:102–4. https://doi.org/10.1016/j.clinbiochem.2018.04.018.Search in Google Scholar PubMed
5. JCTLM Database: higher-order reference materials, methods and services. https://www.jctlmdb.org/#/app/search/searchresults?keywords=glucose& code_type=rmp [Accessed 6 Jul 2023].Search in Google Scholar
6. Neese, JW. Development and evaluation of a hexokinase/glucose-6-phosphate dehydrogenase procedure for use as a national glucose reference method. Atlanta: US Public Health Service, Center for Disease Control, Bureau of Laboratories. Clinical Chemistry Division; 1976.Search in Google Scholar
7. Zhang, T, Zhang, C, Zhao, H, Zeng, J, Zhang, J, Zhou, W, et al.. Determination of serum glucose by isotope dilution liquid chromatography-tandem mass spectrometry: a candidate reference measurement procedure. Anal Bioanal Chem 2016;408:7403–11. https://doi.org/10.1007/s00216-016-9817-0.Search in Google Scholar PubMed
8. International Organization for Standardization (ISO). Reference materials: guidance for characterization and assessment of homogeneity and stability; ISO-Guide 35. Genova: ISO; 2017.Search in Google Scholar
9. Clinical and Laboratory Standards Institute. CLSI EP30-A: characterization and qualification of commutable reference materials for laboratory medicine; approved guideline. Wayne, PA: CLSI; 2010.Search in Google Scholar
10. Wang, Z, Du, Y, Zhang, Q, Yan, J, Zhan, M, Zhang, P, et al.. Development of a glucose reference material in human serum for clinical assay standardization. J Pharm Biomed Anal 2023;228:115285. https://doi.org/10.1016/j.jpba.2023.115285.Search in Google Scholar PubMed
11. International Organization for Standardization. ISO 15195: laboratory medicine – requirements for the competence of calibration laboratories using reference measurement procedures, 2nd ed. Genova: ISO; 2018.Search in Google Scholar
12. International Organization for Standardization. ISO/IEC 17025: general requirements for the competence of testing and calibration laboratories. Genova: ISO; 2017.Search in Google Scholar
13. JCTLM Database: higher-order reference materials, methods and services. https://www.jctlmdb.org/#/app/home [Accessed 6 Jun 2023].Search in Google Scholar
14. RELA-IFCC external quality assessment scheme for reference laboratories in laboratory medicine. http://www.dgkl-rfb.de:81/index.shtml [Accessed 16 Jul 2023].Search in Google Scholar
15. EFLM biological variation database. https://biologicalvariation.eu/ [Accessed 6 Jul 2023].Search in Google Scholar
16. Westgard, J. Sigma metrics – how good is good enough? https://www.westgard.com/guest34.htm [Accessed 16 Sep 2023].Search in Google Scholar
17. Gras, JM, Philippe, M. Application of the Six Sigma concept in clinical laboratories: a review. Clin Chem Lab Med 2007;45:789–96. https://doi.org/10.1515/cclm.2007.135.Search in Google Scholar
18. Wauthier, L, Di Chiaro, L, Favresse, J. Sigma metrics in laboratory medicine: a call for harmonization. Clin Chim Acta 2022;532:13–20. https://doi.org/10.1016/j.cca.2022.05.012.Search in Google Scholar PubMed
19. Ricós, C, Perich, C, Boned, B, González-Lao, E, Fernández-Calle, P, Ventura, M, et al.. Standardization in laboratory medicine: two years’ experience from category 1 EQA programs in Spain. Biochem Med 2019;29:010701. https://doi.org/10.11613/BM.2019.010701.Search in Google Scholar PubMed PubMed Central
20. Jones, GR. The role of EQA in harmonization in laboratory medicine – a global effort. Biochem Med 2017;27:23–9. https://doi.org/10.11613/bm.2017.004.Search in Google Scholar
21. Plebani, M. Harmonization in laboratory medicine: the complete picture. Clin Chem Lab Med 2013;51:741–51. https://doi.org/10.1515/cclm-2013-0075.Search in Google Scholar PubMed
22. Braga, F, Pasqualetti, S, Panteghini, M. The role of external quality assessment in the verification of in vitro medical diagnostics in the traceability era. Clin Biochem 2018;57:23–8. https://doi.org/10.1016/j.clinbiochem.2018.02.004.Search in Google Scholar PubMed
23. Dohnal, L, Kalousova, M, Zima, T. Comparison of three methods for determination of glucose. Prague Med Rep 2010;111:42–54.Search in Google Scholar
24. Li, R, Wang, T, Gong, L, Peng, P, Yang, S, Zhao, H, et al.. Comparative analysis of calculating sigma metrics by a trueness verification proficiency testing-based approach and an internal quality control data inter-laboratory comparison-based approach. J Clin Lab Anal 2019;33:e22989. https://doi.org/10.1002/jcla.22989.Search in Google Scholar PubMed PubMed Central
25. Hens, K, Berth, M, Armbruster, D, Westgard, S. Sigma metrics used to assess analytical quality of clinical chemistry assays: importance of the allowable total error (TEa) target. Clin Chem Lab Med 2014;52:973–80. https://doi.org/10.1515/cclm-2013-1090.Search in Google Scholar PubMed
Supplementary Material
This article contains supplementary material (https://doi.org/10.1515/labmed-2024-0037).
© 2024 the author(s), published by De Gruyter, Berlin/Boston
This work is licensed under the Creative Commons Attribution 4.0 International License.
Articles in the same Issue
- Frontmatter
- Mini Review
- Implementing the ESMO recommendations for the use of circulating tumor DNA (ctDNA) assays in routine clinical application/diagnostics
- Original Articles
- Questionable accuracy of four ELISA kits in serum Netrin-1 measurement
- Evaluation for serum glucose standardization in clinical laboratories of Southern China by consecutive 6 years proficiency testing based on JCTLM-recommended reference methods
- Assessment of long-term stored specimens in the Siriraj Hospital colorectal cancer biobank for RNA sequencing and profiling
- Identification of a high threshold value of serum ferritin in the diagnosis of hemophagocytic lymphohistiocytosis in hospitalized children in China
- Usefulness of neutrophil-to-lymphocyte count ratio, procalcitonin, and interleukin-6 for severity assessment of bacterial sepsis
- Congress Abstracts
- German Congress of Laboratory Medicine: 19th Annual Congress of the DGKL and 6th Symposium of the Biomedical Analytics of the DVTA e. V. together with the 6th German POCT-Symposium