Performance evaluation of the automated body fluid analysis of the new Sysmex XR haematology analyser
-
Christine Van Laer

 ,
Lieselot Dedeene
,
Lien Gruwier
,
Bram Vanmechelen
,
Lieselot Dedeene
,
Lien Gruwier
,
Bram Vanmechelen

Abstract
Objectives
The cellular composition of body fluids (BF) provides insight into disease pathology and is an important diagnostic parameter. The well-established Sysmex XN haematology analyser (XN) offers automated BF analysis and is in routine use in many laboratories. In this study the performance of the new Sysmex XR analyser (XR) in testing BF is compared to the XN.
Methods
Cerebrospinal, pleural, peritoneal, and synovial fluids, as well as bronchoalveolar lavage (BAL) samples, were processed in BF mode on both analysers. Standard statistical methods were used to evaluate the performance of XR compared to the reference XN.
Results
Cell counts were generated from a total of 356 measurements from 307 patient BF samples. After application of exclusion criteria, 86 cerebrospinal, 77 peritoneal, 78 pleural, and 89 synovial fluid sample pairs were compared. An excellent correlation coefficient (r) between the two analysers was observed for all diagnostic parameters; WBC-BF: 0.996, RBC-BF: 0.974, TC-BF: 0.995, MN#: 0.994, MN%: 0.830, PMN#: 0.985 and PMN%: 0.835. The research parameters also performed equally well (r values of 0.900–0.994). The performance of diluted and undiluted samples was equally good. Similar results for diagnostic and research parameters were obtained from 62 BAL samples (r values of 0.899–0.992).
Conclusions
This study demonstrates that the automated BF counts on the new Sysmex XR analyser are equivalent to that of the XN for all BF types analysed.
Introduction
Laboratory testing underpins clinical decision-making in medical practice globally, and therefore plays an important role in determining patient outcomes [1]. As body fluids (BF) provide a readily accessible source of diagnostic information, clinicians rely on BF analysis to assist diagnosis and monitoring effectiveness of treatment for various diseases [2].
In the broadest sense, the term “body fluids” includes all fluids that (1) circulate or are excreted from the human body (e.g., blood, urine, saliva), (2) are present in certain cavities under physiological conditions (e.g., synovial fluid, cerebrospinal fluid (CSF)) or (3) accumulate under pathological conditions in cavities that are ordinarily ‘dry’ (e.g., pleural, peritoneal, or pericardial effusions). From a laboratory perspective, however, BF analysis is generally restricted to CSF, pleural, peritoneal, pericardial, and synovial fluid. Therapeutically-induced fluid collections such as bronchoalveolar lavage (BAL), utilised as an adjunctive tool for the diagnosis of lung diseases [3], and continuous ambulatory peritoneal dialysis (CAPD) fluid, which is regularly tested because of the high risk of infection [4], are also considered as BF in the context of routine testing.
Evaluation of the cellular composition is a common first step for the analysis of BF. The type and relative abundance of different cell types provides valuable insights into the underlying pathology, notably as a rapid first screen for infection. Historically, BF cell counting, and WBC differentiation have been conducted using a counting chamber and manual microscopy, after cytocentrifugation and staining of the specimen. Although manual analysis is still considered the gold standard for BF cytometry [5], automated analysis is growing in popularity because of standardisation and fast processing, thus overcoming the high interobserver variability and long turnaround time inherent in manual procedures [6].
Multiple automated cell counters with BF analysis functionality are commercially available, including haematology analysers with a dedicated BF mode [7]. Sysmex (Sysmex Corporation, Kobe, Japan) first introduced a dedicated BF mode on its XE-5000 analyser in 2006 [8], and subsequently on the XT-4000i [9], and the XN-Series (XN) [10]. Several studies have confirmed good performance of the XN on a variety of BF in routine laboratories [10], [11], [12], [13], [14]. Sysmex recently launched the new XR-Series analyser (XR), which has the same principle of measurement as the XN, but with a different reagent system. Here a comparison of automated BF analysis (CSF, pleural, peritoneal, synovial fluid, and BAL) of the new XR and the well-established XN, is presented.
Materials and methods
Samples and sample handling
BF samples submitted to the department of Laboratory Medicine of the University Hospital Leuven, Belgium, with a volume of ≥500 µL were used for this study. CSF, pleural fluid, peritoneal fluid, CAPD, synovial fluid and BAL samples collected according to the local laboratory procedures, and <6 h old after sample collection, with no other preselection criteria, were evaluated. Samples were stored at room temperature prior to testing. The target was to include at least 60 samples for each BF type. As CAPD samples are infrequently encountered in our laboratory, they were grouped together with peritoneal fluids. All synovial fluid samples were treated with 1 mg hyaluronidase (Hyaluronidase H3757, 300–1000 U/mg, Sigma-Aldrich) per 1 mL sample, mixed well and incubated at 37 °C for 5 min prior to analysis. Hyaluronidase disrupts hyaluronic acid polymers, rendering the samples less viscous and more homogeneous, which improves the accuracy of the analysis.
Automated BF analysis method
All BF samples with request for haematological cell counting were routinely measured in the open BF mode on the Sysmex XN-Series haematology analyser (Sysmex Corporation, Kobe, Japan). Thereafter, the same samples were processed on the Sysmex XR-Series analyser (Sysmex Corporation, Kobe, Japan). Samples were mixed thoroughly by sample tube inversion before analysis, in accordance with manufacturer instructions. Pre-analytical dilution with Cellpack DCL (Sysmex Europe SE, Norderstedt, Germany) was performed whenever deemed necessary based on the appearance (increased turbidity) and viscosity of the sample. Sample dilution was also performed if the first measurement revealed cell counts that exceeded the analyser linearity range (identical for XN and XR) or when visual inspection of the WDF (white blood cell differential) scattergram revealed sub-optimal cell cluster separation (as judged by the laboratory technician), if residual sample volume was sufficient. In the latter case, both the original undiluted and diluted sample measurements were included. The dilutions ranged from 1 in 5 to 1 in 100. BAL samples were not diluted if linearity was exceeded as our routine processing of such samples is exclusively undertaken to obtain an approximate WBC count. Analytical quality control checks were conducted daily at regular time points using low and high levels of XN-Check BF (Streck, Omaha, USA). Analysis parameters included red blood cell (RBC-BF), WBC (WBC-BF), total nucleated cell (TC-BF) and WBC differential counts (Table 1).
Automated body fluid (BF) mode analysis parameters.
| Name | Description | Unit | |
|---|---|---|---|
| Diagnostic parameters | WBC-BF | White blood cell count in BF mode | 103/µL |
| RBC-BF | Red blood cell count in BF mode | 106/µL | |
| TC-BF | Total nucleated cell count in BF mode | 103/µL | |
| MN# | Mononuclear cell count in BF mode | 103/µL | |
| MN% | Mononuclear cell percentage in BF mode | % | |
| PMN# | Polymorphonuclear cell count in BF mode | 103/µL | |
| PMN% | Polymorphonuclear cell percentage in BF mode | % | |
| Research parameters | NE-BF# | Neutrophil count in BF mode | 103/µL |
| NE-BF% | Neutrophil percentage in BF mode | % | |
| LY-BF# | Lymphocyte count in BF mode | 103/µL | |
| LY-BF% | Lymphocyte percentage in BF mode | % | |
| MO-BF# | Monocyte count in BF mode | 103/µL | |
| MO-BF% | Monocyte percentage in BF mode | % | |
| EO-BF# | Eosinophil count in BF mode | 103/µL | |
| EO-BF% | Eosinophil percentage in BF mode | % | |
| HF-BF# | High fluorescent cell count in BF mode | 103/µL | |
| HF-BF% | High fluorescent cell percentage in BF mode | % |
-
Diagnostic parameters are intended to be used for patient diagnosis whereas research parameters are intended for research use only.
The principle of measurement utilised in the BF analysis is identical for both the XN and XR, albeit with a different reagent system. Hydrodynamically focused DC detection method is used to count RBC-BF, whereas TC-BF, WBC-BF and differential counts are determined using fluorescence flow cytometry in the WDF channel. In brief, forward scatter (cell size), side scatter (cellular complexity) and fluorescence intensity (nucleic acid content) are combined to characterise cells. In so doing, the WBC mononuclear cell (MN) and polymorphonuclear cell (PMN) clusters can be enumerated. The MN and PMN populations are further differentiated into lymphocyte and monocyte, and neutrophil and eosinophil sub-populations, respectively, and provided as research parameters. Furthermore, cells such as macrophages and mesothelial cells, identified by high intensity fluorescence, are reported as HF-BF. Samples with malignant cell infiltration may also exhibit an increase in HF-BF [15]. The latter are excluded from WBC-BF but are included in TC-BF. If the WDF cell clustering pattern does not conform to what is expected, the analyser triggers a WBC abnormal scattergram flag. In such instances, the WBC-related parameters may be unreliable.
Standard analytical performance metrics such as e.g., linearity, carryover, and precision, were not included in this method comparison evaluation.
Management of errors
After each analysis run, results obtained from both analysers were reviewed to identify any samples with technical errors. Repeat testing was performed for all samples where a sample handling or instrument-related error (e.g., inconsistent sample density or clogged instrument flow cell) was identified if there was sufficient residual sample volume, and the sample <6 h old.
Data management
For all samples, date and time of collection and fluid type were recorded. The raw data file export from both the XN and XR was conducted on a regular basis, in accordance with manufacturer instructions.
Data analysis
Sample measurements meeting any one of the following criteria were excluded from the data analysis: >6 h after collection, RBC-BF exceeds upper limit of linearity range (>5 × 10⁶/µL), WBC-BF exceeds upper limit of linearity range (>10 × 103/µL), raw data file not retrievable, missing measurement on one instrument, and analysis errors as described above. For samples exceeding linearity only the diluted sample measurements were included in the analysis. Data analysis was done using MedCalc® Statistical Software version 19.8 (MedCalc Software Ltd, Ostend, Belgium). Correlation coefficients, regression slopes and intercepts were estimated for all parameters using the Spearman’s rank correlation and Passing-Bablok regression methods. Bias between the methods was assessed using Bland-Altman plots. CSF, peritoneal, pleural, and synovial fluids were analysed separately per BF type as well as collectively. The WBC abnormal scattergram flagging rate between the analysers, and the impact thereof on the parameter values, was evaluated as described above. BAL fluids were analysed independently of the other body fluids as this BF type is not part of the intended use declared by the manufacturer for measurement on Sysmex analysers. For the research parameters, only absolute counts were included in the analysis.
Ethics approval
The study respected individuals’ rights to confidentiality and was in accordance with procedures supervised by Local Authorities responsible for Ethical Research (Ethics Committee Research UZ/KU Leuven, approval on May 18, 2021; reference S64732).
Results
Study samples
A total of 324 BF samples were collected (86 CSF, 80 peritoneal, 77 pleural, and 81 synovial fluids). One sample was excluded as it was >6 h old at the time of analysis, while 16 samples, which qualified for repeat testing, were eliminated due to insufficient volume. Among the remaining 307 samples, 25 required repeat testing due to analysis errors or missing data. Additionally, 24 samples needed dilution for re-analysis due to exceeding analyser linearity or suboptimal cluster separation as observed in the WDF scattergram. Ultimately, the 307 patient samples provided a total of 356 measurements, with 49 having two measurements.
After the application of exclusion criteria, 330 measurement pairs consisting of 86 CSF, 77 peritoneal, 78 pleural, and 89 synovial fluid samples were compared (Table 2). Where a sample was represented with two measurements, these were either undiluted and diluted, or two different dilutions. Comparison of 20 sample pairs for which both an undiluted and diluted XN and XR measurement was available, showed that the correlation coefficients before and after dilution were similar (data not shown) and thus diluted and undiluted samples were analysed together. For all samples, the cell counts for the diagnostic and research parameters (Table 1) were generated.
Study sample numbers with breakdown of excluded measurements.
| CSF | Peritoneal fluida | Pleural fluid | Synovial fluid | Total | |
|---|---|---|---|---|---|
| Patient samples included in analysis | 85 | 75 | 72 | 75 | 307 |
| Number of samples with 2 measurements | 1 | 4 | 10 | 34 | 49 |
| Total sample measurements | 86 | 79 | 82 | 109 | 356 |
| Measurement exclusions | 0 | 2 | 4 | 20 | 26 |
| Reason for exclusion | |||||
| >6 h oldb | 0 | 1 | 0 | 0 | 1 |
| Exceeds linearityc | 0 | 0 | 1 | 11 | 12 |
| Missing measurementd | 0 | 1 | 2 | 9 | 12 |
| Analysis error | 0 | 0 | 1 | 0 | 1 |
| Total sample measurements included in analysis | 86 | 77 | 78 | 89 | 330 |
-
CSF, cerebrospinal fluid. aContinuous ambulatory peritoneal dialysis (CAPD) fluids are included with peritoneal fluids. bThe sample was >6 h old at the time of repeat testing. cThe undiluted sample measurements with values that exceeded linearity were excluded, but the diluted sample measurements were included if there was no other reason for exclusion. dEither the XN or XR measurement was missing.
Of the 78 BAL samples measured, 16 exceeded the linearity range for WBC-BF and were excluded from further analysis. The remaining 62 BAL sample measurements were analysed separately.
CSF, peritoneal, pleural, and synovial fluid analysis
An excellent correlation coefficient (r) between the two analysers was observed for all diagnostic parameters; WBC-BF: 0.996, RBC-BF: 0.974, TC-BF: 0.995, MN#: 0.994, MN%: 0.830, PMN#: 0.985, and PMN%: 0.835 for all BF types collectively (Table 3). The regression line (Figures 1 and 2) for each comparison was very close to the line of equality for all parameters, and the coefficients showed excellent performance (Supplementary Tables 1 and 2). Bland-Altman analysis (Figures 1 and 2) showed that the difference of means (XN minus XR) for each parameter was zero or close to zero: WBC-BF: 0.06, RBC-BF: 0.0, MN#: 0.03, MN%: −2.2; PMN#: 0.03, PMN%: 1.6, and TC-BF: 0.06. The range for this difference did not reveal a significant bias in either direction; WBC-BF: −0.47 to 0.59, RBC-BF: −0.01 to 0.01, MN#: −0.37 to 0.44, MN%: −33.4 to 29.0, PMN#: −0.26 to 0.32, PMN%: −29.5 to 32.7, and TC-BF: −0.48 to 0.61.
Correlation coefficients of XR and XN body fluid mode parameters.
| All fluidsa (n=330) | CSF (n=86) | Peritoneal fluidb (n=77) | Pleural fluid (n=78) | Synovial fluid (n=89) | ||
|---|---|---|---|---|---|---|
| Diagnostic parameters | WBC-BF | 0.996 | 0.965 | 0.991 | 0.989 | 0.994 |
| RBC-BF | 0.974 | 0.940 | 0.930 | 0.984 | 0.987 | |
| TC-BF | 0.995 | 0.959 | 0.990 | 0.981 | 0.994 | |
| MN# | 0.994 | 0.941 | 0.986 | 0.985 | 0.991 | |
| MN% | 0.830 | 0.622 | 0.866 | 0.990 | 0.984 | |
| PMN# | 0.985 | 0.873 | 0.874 | 0.975 | 0.993 | |
| PMN% | 0.835 | 0.639 | 0.866 | 0.990 | 0.984 | |
| Research parameters | NE-BF# | 0.985 | 0.870 | 0.870 | 0.976 | 0.993 |
| LY-BF# | 0.994 | 0.936 | 0.990 | 0.978 | 0.992 | |
| MO-BF# | 0.981 | 0.867 | 0.961 | 0.954 | 0.979 | |
| EO-BF# | 0.900 | 0.913 | 0.840 | 0.887 | 0.903 | |
| HF-BF# | 0.958 | 0.803 | 0.948 | 0.938 | 0.924 | |
-
CSF, cerebrospinal fluid. aExcluding bronchoalveolar lavage (BAL) fluids. bContinuous ambulatory peritoneal dialysis (CAPD) fluids are grouped together with peritoneal fluids. WBC-BF, white blood cell count in body fluid (BF) mode; RBC-BF, red blood cell count in BF mode; MN#, mononuclear cell count in BF mode; MN%, mononuclear cell percentage in BF mode; PMN#, polymorphonuclear cell count in BF mode; PMN%, polymorphonuclear cell percentage in BF mode; TC-BF, total nucleated count in BF mode; NE-BF#, neutrophil cell count in BF mode; LY-BF#, lymphocyte cell count in BF mode; MO-BF#, monocyte cell count in BF mode; EO-BF#, eosinophil cell count in BF mode; HF-BF#, high fluorescent cell count in BF mode.
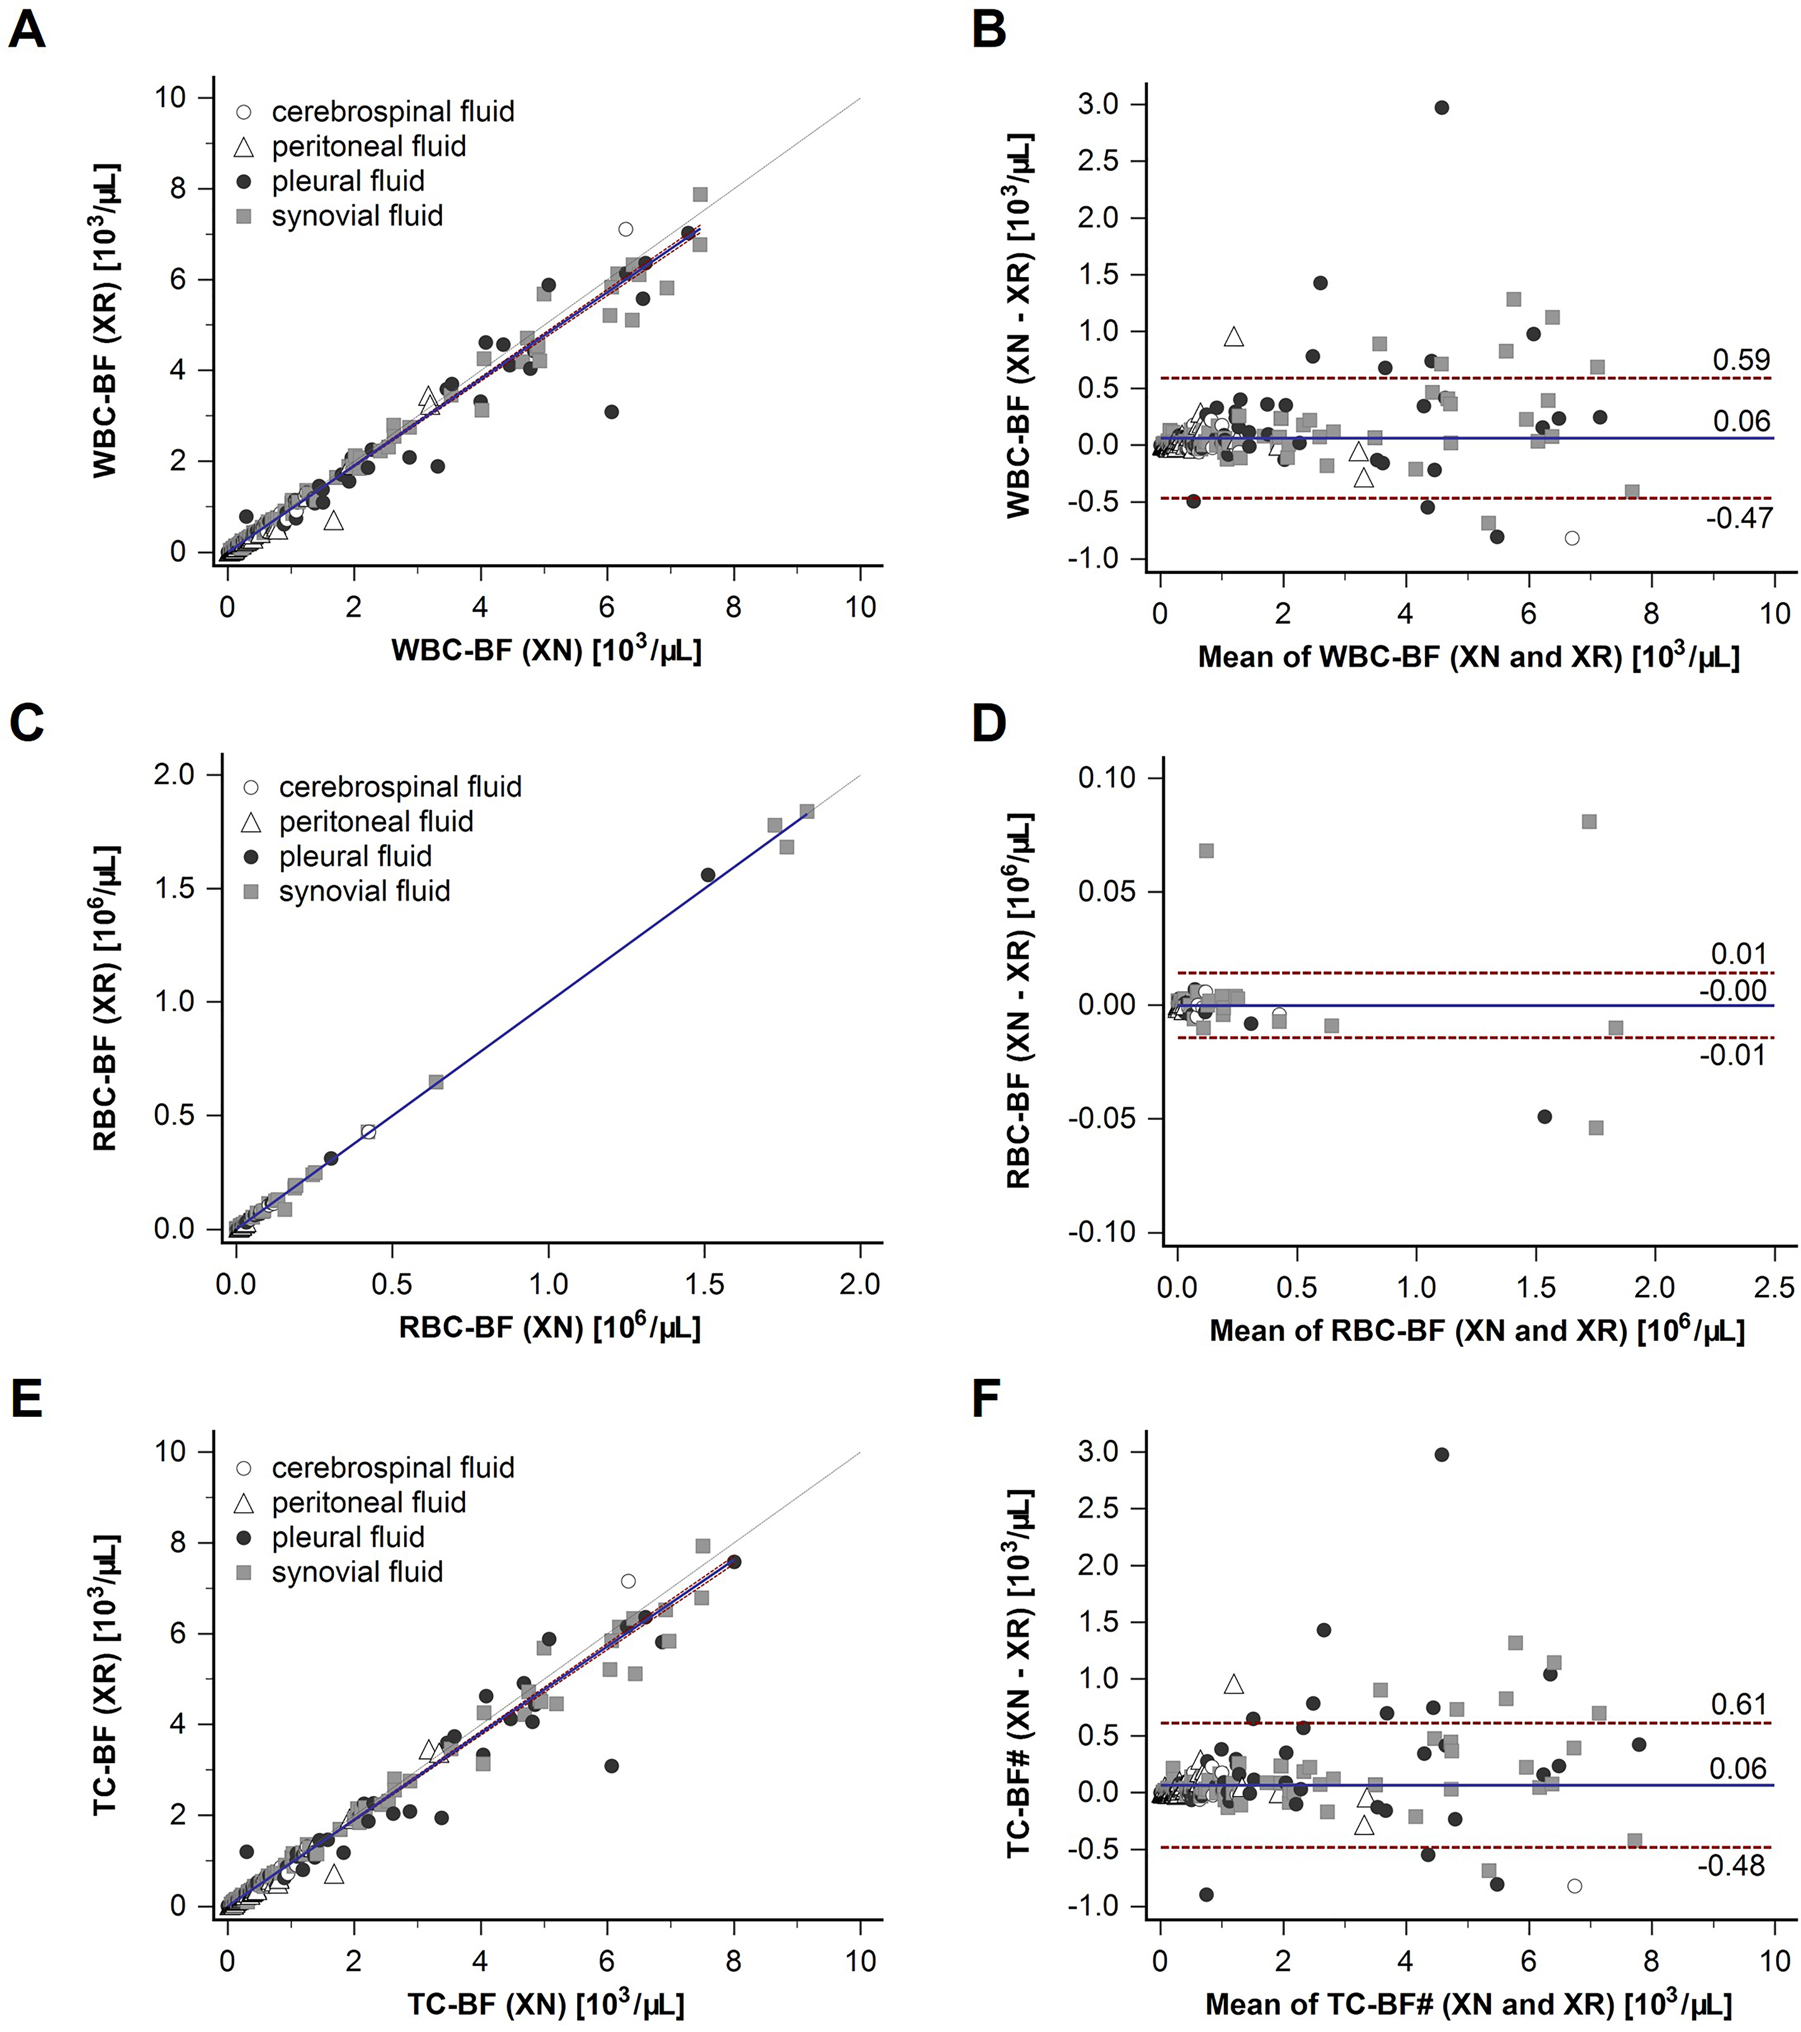
Correlation of XR and XN body fluid mode for WBC-BF, RBC-BF and TC-BF. Samples from four different body fluids were measured on Sysmex XR and XN analysers. Cerebrospinal fluid samples (n=86) are depicted with an open circle, peritoneal fluid samples (n=77) with an open triangle, pleural fluid samples (n=78) with a closed black circle, and synovial fluid samples (n=89) with closed grey square. Correlation graphs with regression line with confidence intervals, and line of equality (dashed) are shown for white blood cell count (WBC-BF) (A), red blood cell count (RBC-BF) (C), and total nucleated cell count (TC-BF) (E). Bland-Altman plots with difference of means (XN minus XR) (solid line) and range (1.96 SD) (dashed lines) are shown for WBC-BF (B), RBC-BF (D), and TC-BF (F).

Correlation of XR and XN body fluid mode for MN#, MN%, MPN#, PMN%. Samples from four different body fluids were measured on the Sysmex XR and XN analysers. Cerebrospinal fluid samples (n=86) are depicted with an open circle, peritoneal fluid samples (n=77) with an open triangle, pleural fluid samples (n=78) with a closed black circle, and synovial fluid samples (n=89) with a closed grey square. Correlation graphs with regression line with confidence intervals, and line of equality (dashed) are shown for mononuclear cell count (MN#) (A), mononuclear cell percentage (MN%) (C), polymorphonuclear cell count (PMN#) (E), and polymorphonuclear cell percentage (PMN%) (G). Bland-Altman plots with difference of means (XN minus XR) (solid line) and range (1.96 SD) (dashed lines) are shown for MN# (B), MN% (D), PMN# (F), and PMN% (H).
Similar results were observed for the five research parameters, with excellent correlation coefficients for all BF samples collectively; NE-BF#: 0.985, LY-BF#: 0.994, MO-BF#: 0.981, EO-BF#: 0.900, HF-BF#: 0.958 (Table 3). Albeit EO-BF# had the widest confidence intervals for its correlation coefficient (0.877–0.918), with a slope of 0.911, these numbers still indicate an excellent concordance between the two systems (Supplementary Figure 1G, Supplementary Table 2). Bland-Altman analysis (Supplementary Figure 1) followed the same trend as for the diagnostic parameters, with the difference of means (XN minus XR) being zero or close to zero (NE-BF#: 0.02, LY-BF#: 0.03, MO-BF#: 0.01, EO-BF#: 0.00, HF-BF#: 0.00) with no significant bias in either direction; NE-BF#: −0.29 to 0.33, LY-BF#: −0.35 to 0.41, MO-BF#: −0.11 to 0.12, EO-BF#: −0.08 to 0.09, and HF-BF#: −0.06 to 0.06.
Analysis of each BF type independently showed that they all had correlations close to the overall study sample group average for the absolute count diagnostic parameters of the BF mode (Table 3). The Bland-Altman analysis showed that the samples that were beyond the limits of agreement for each parameter were mostly pleural and synovial fluids (closed black circle and closed grey square respectively), with the majority showing a negative bias for the XR (Figures 1 and 2). The r values for MN% (0.622) and PMN% (0.639) were however significantly lower for CSF samples, compared to the overall BF group mean values (MN%: 0.830; PMN%: 0.835). These lower r values can be attributed to the CSF samples having very few cells relative to other BF types. A one cell difference has a big impact on percentage count but is insignificant in absolute numbers. Forty-four percent (38/86) of the CSF samples had WBC-BF values below the limit of quantification (LoQ) of the analyser (0.003 × 10³/µL for both XN and XR). When these samples were excluded, the r value for both MN% and PMN% was 0.969.
The research parameters also showed an excellent correlation between XN and XR for the different BF (Table 3). Similar to the diagnostic parameters, a few samples, again mostly pleural and synovial fluids, were beyond the limits of agreement in the Bland-Altman analysis (Supplementary Figure 1). Also, most synovial fluids concentrated above the difference of means for EO-BF# (Supplementary Figure 1H).
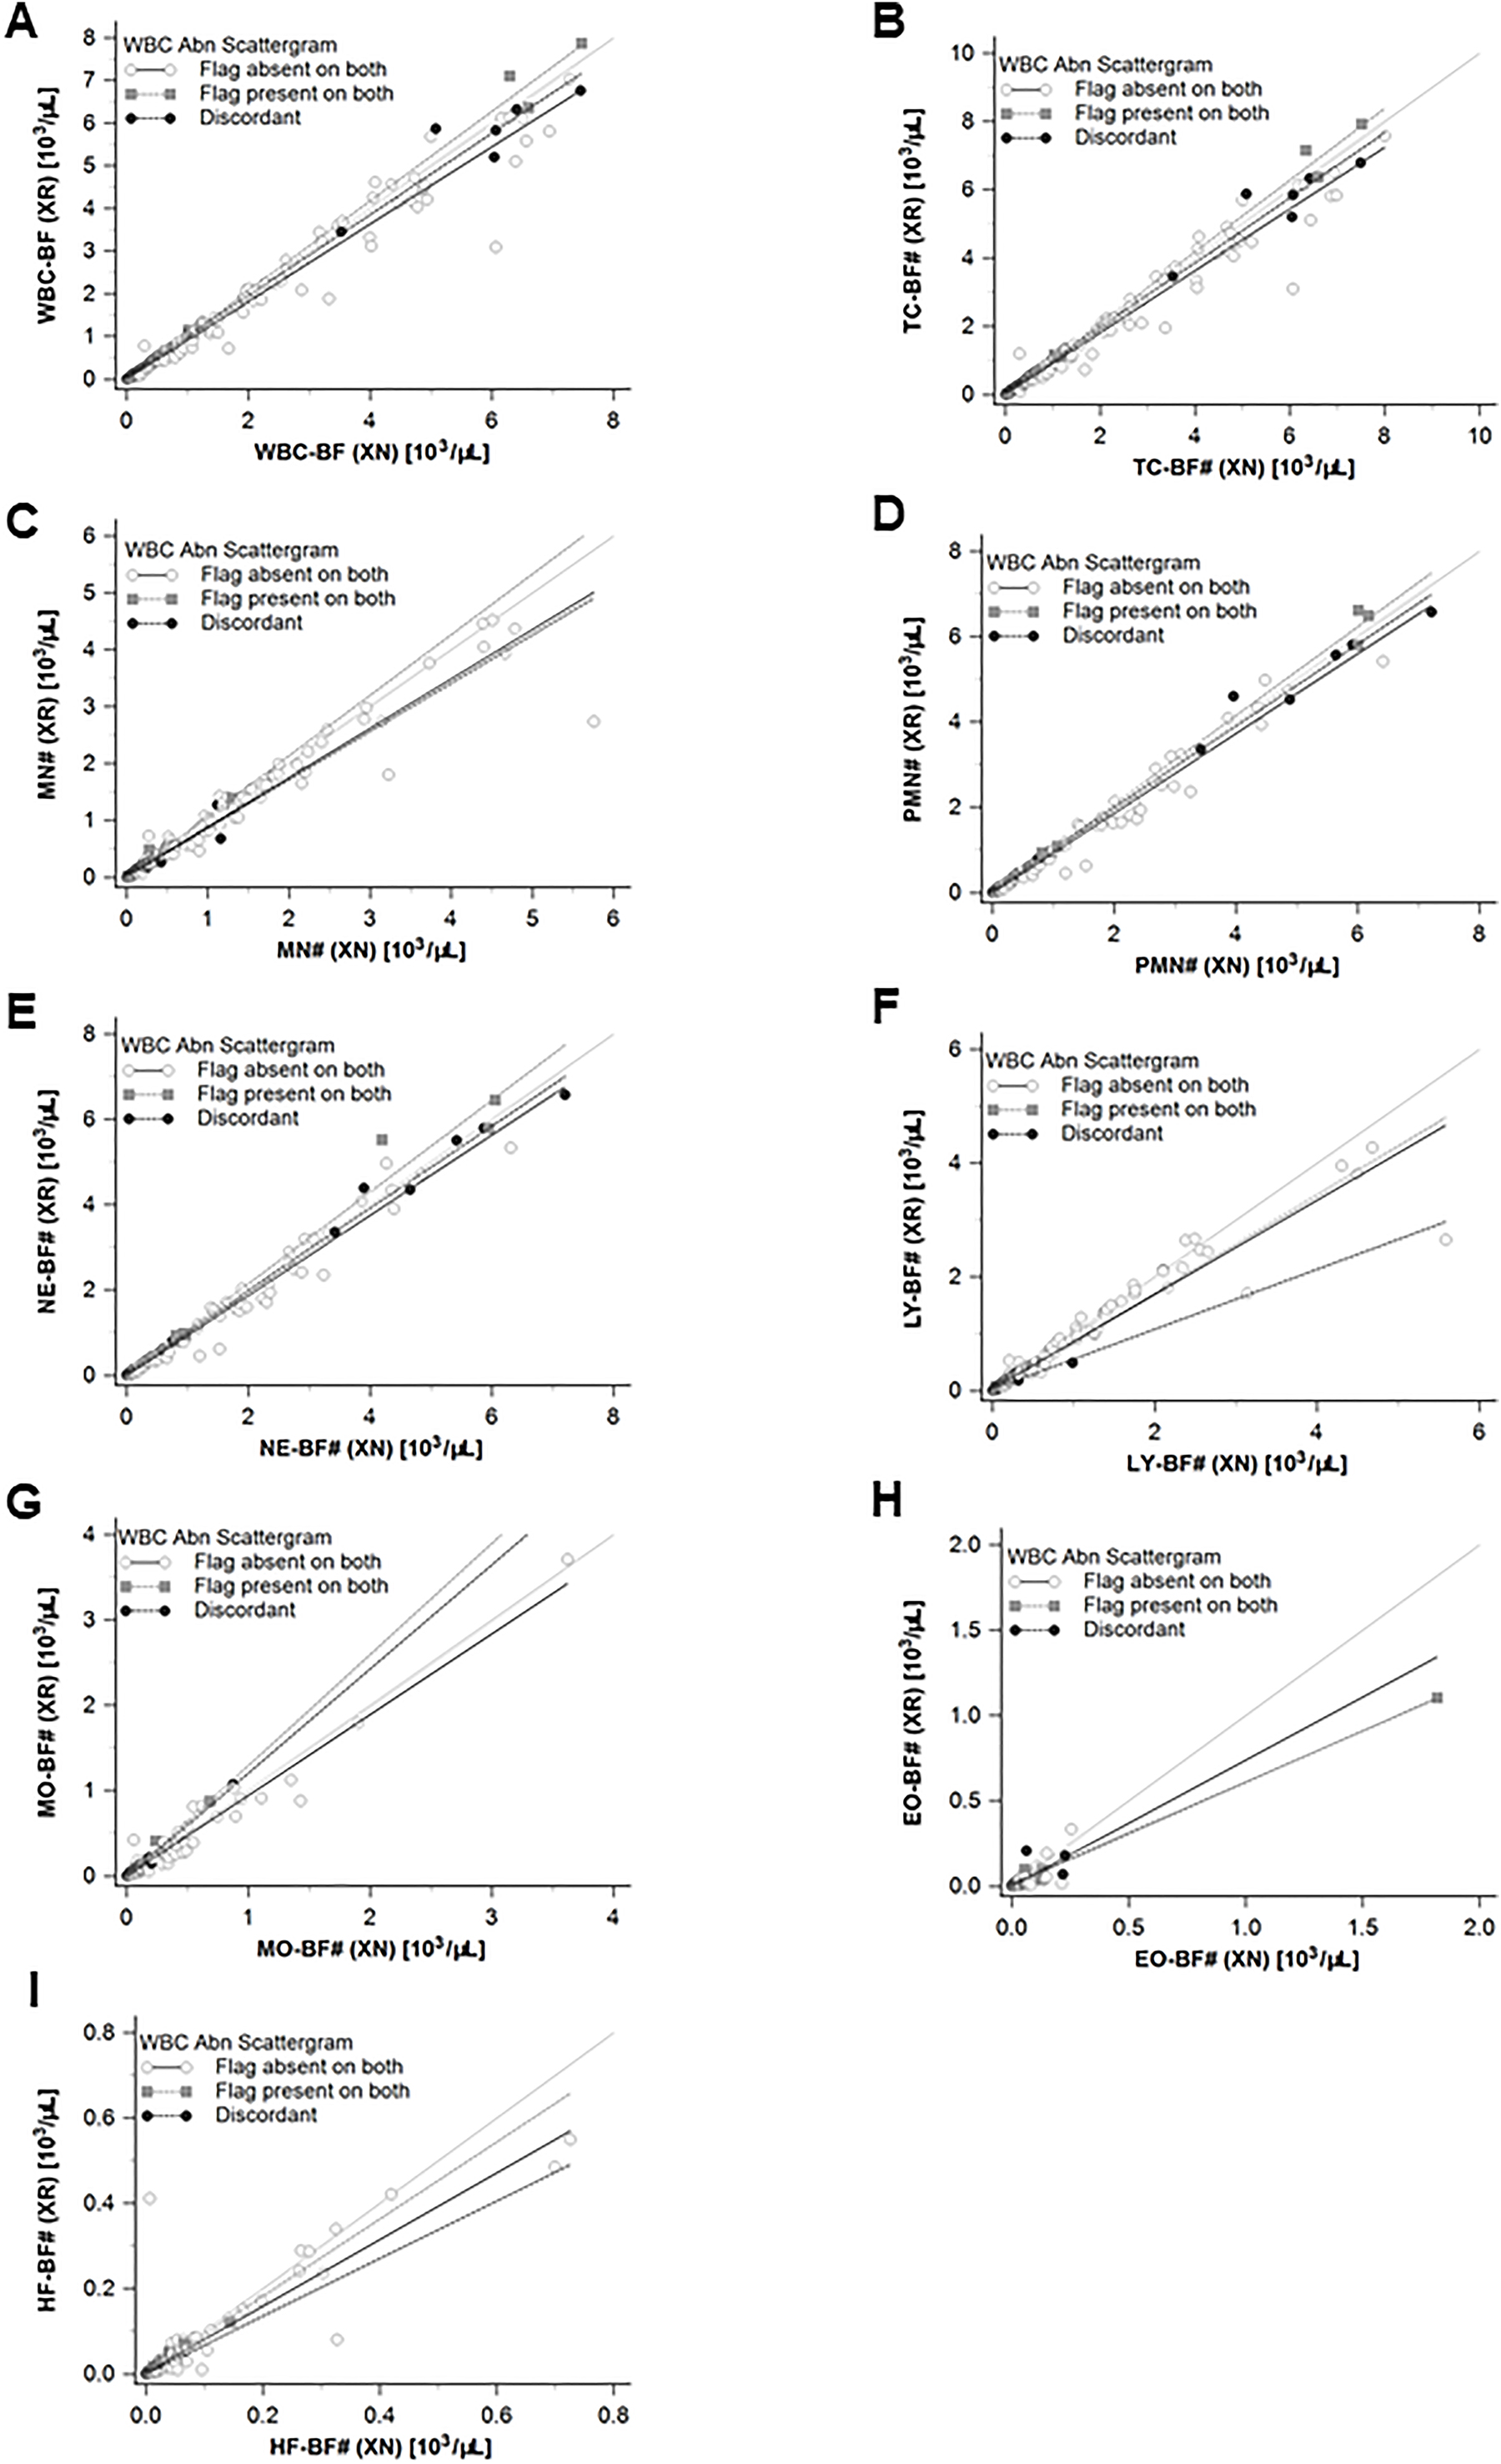
WBC abnormal scattergram flags
The flagging rate of 6.06 % (20/330) and 8.79 % (29/330) for XN and XR respectively, were comparable (p=0.1869). The discordance rate was 4.5 %. Correlation analysis of XN and XR analyser sample measurement pairs revealed closely comparable values (Spearman coefficient, slope, mean difference) for the group of samples where (1) no flag was triggered on both analysers (n=278), (2) both analysers flagged the same sample (n=17) or (3) only XN (n=3) or XR (n=12) triggered a flag, for all potentially affected parameters (WBC-BF, MN, PMN, LY-BF, MO-BF, NE-BF, EO-BF, HF-BF and TC-BF) (Supplementary Table 3, Supplementary Figure 2).
BAL fluids
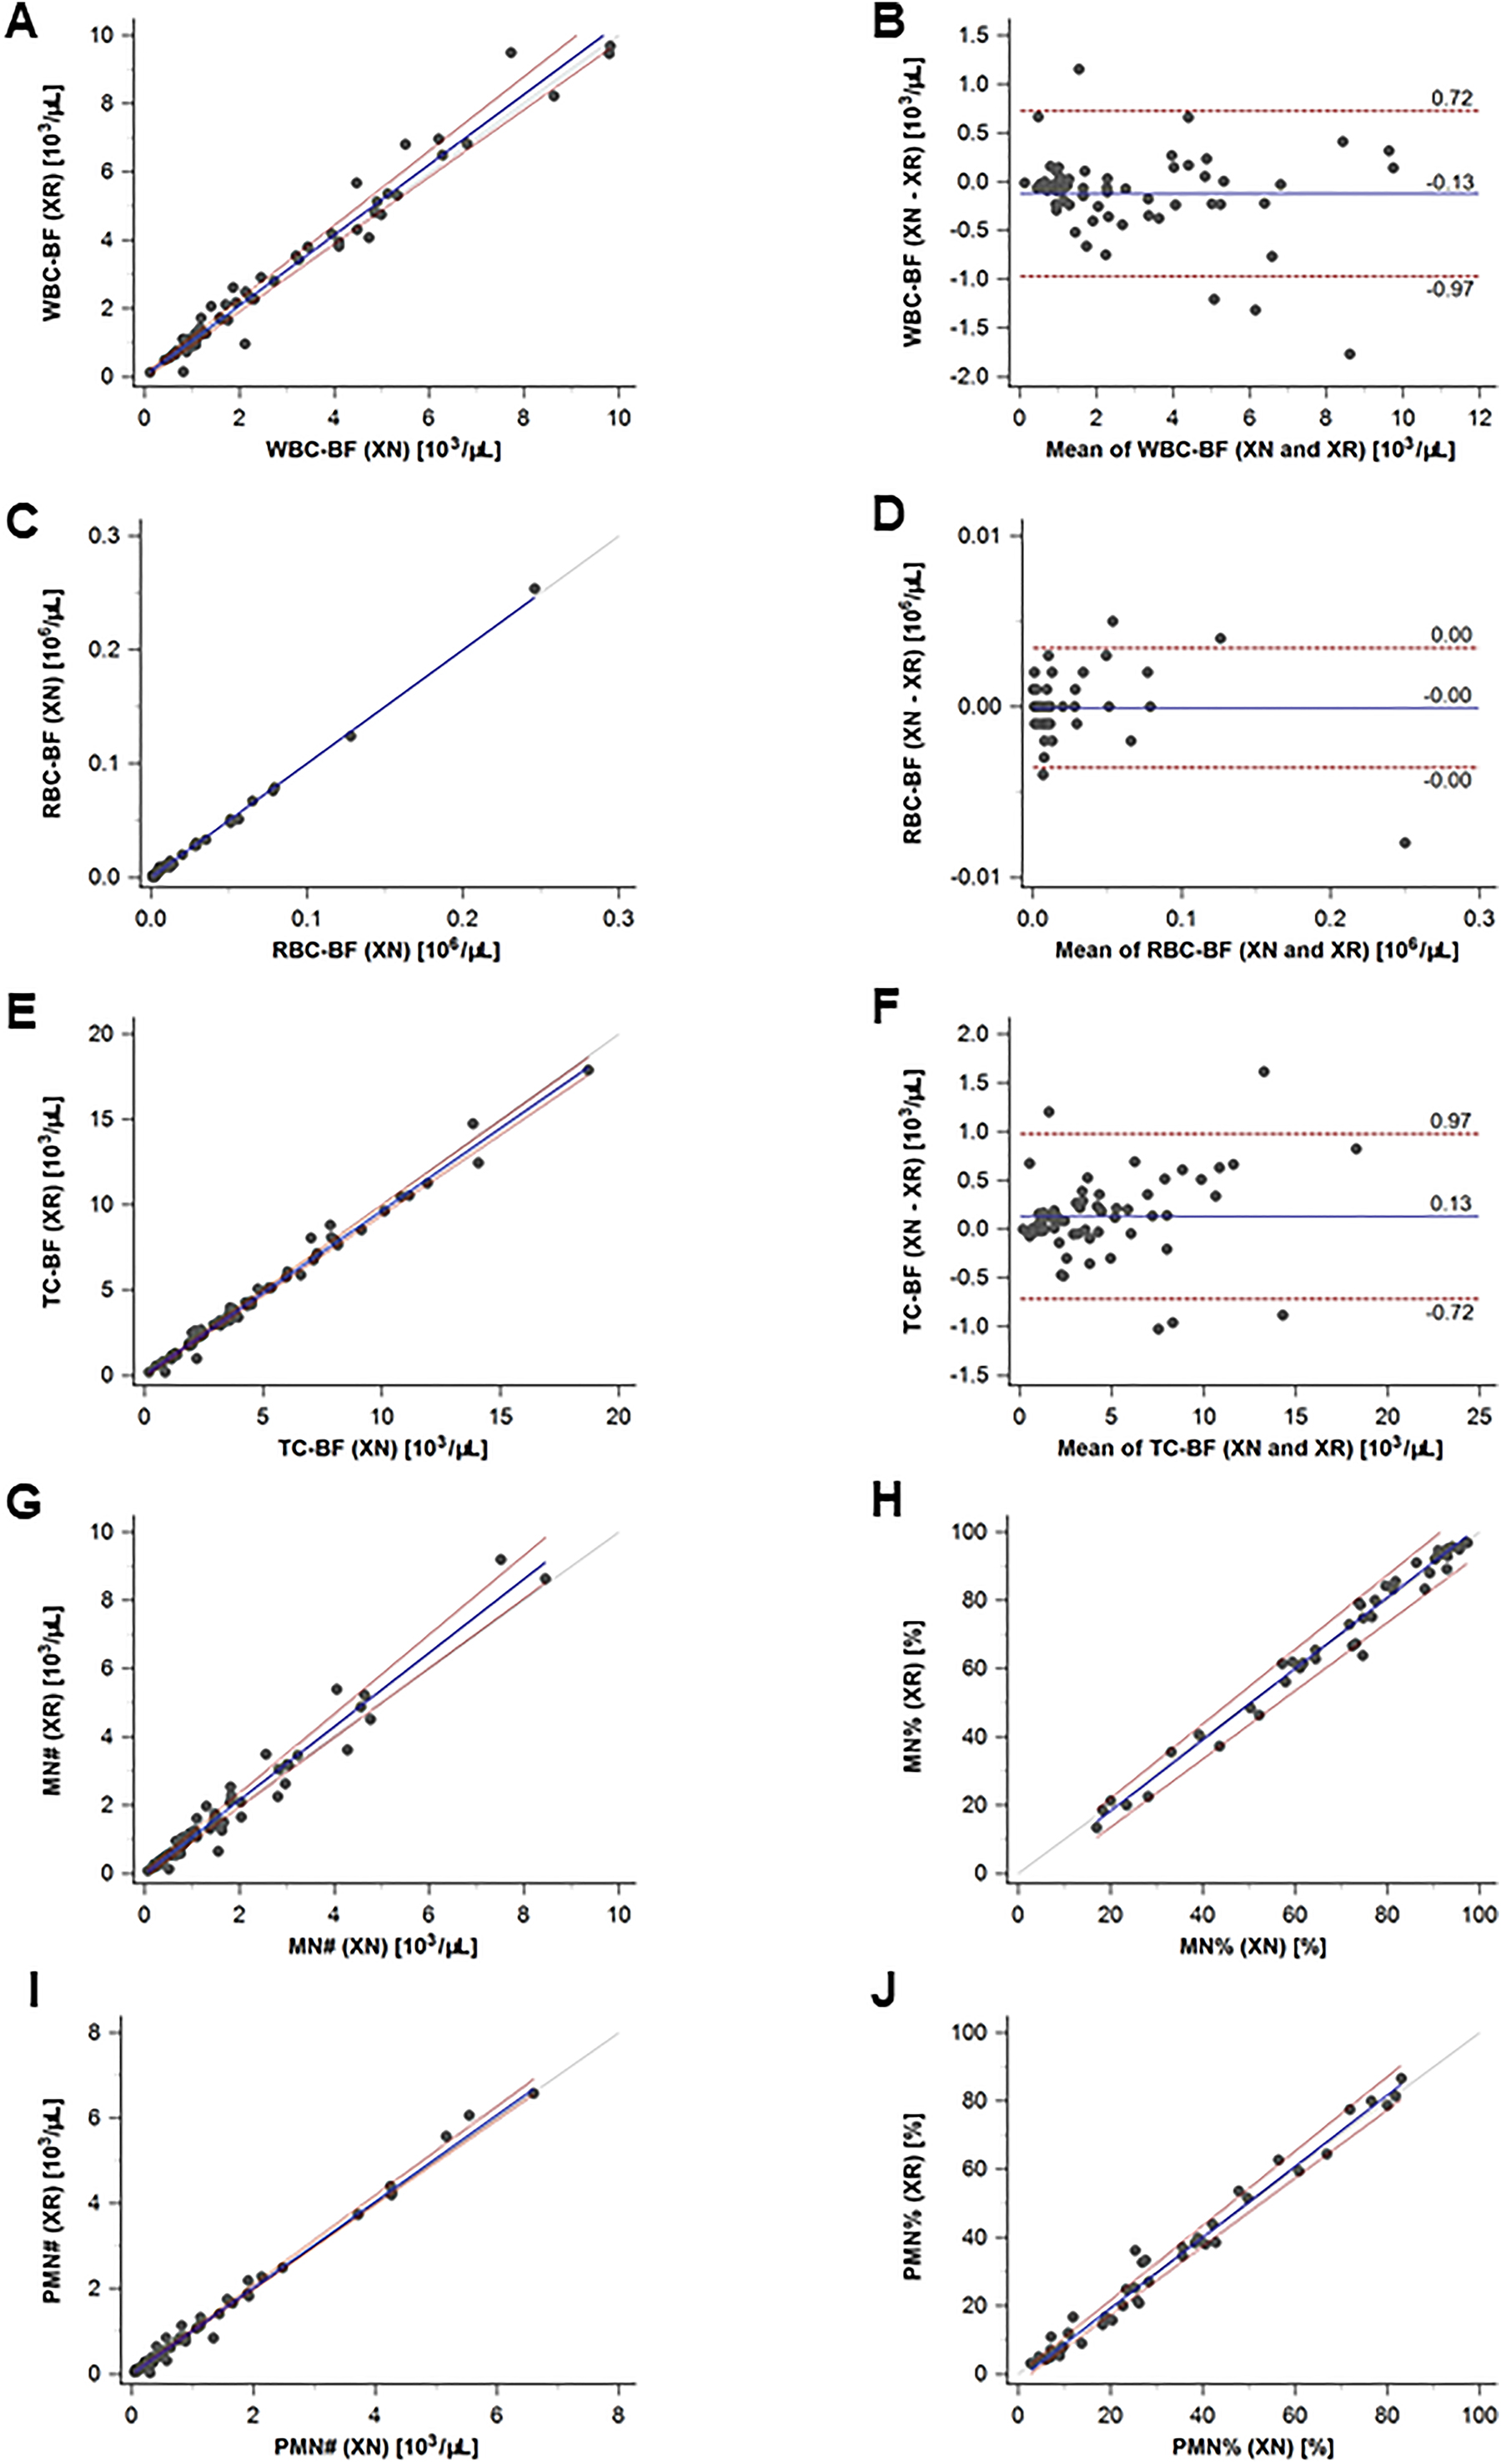
The correlation coefficients for the 62 samples were excellent both for diagnostic and research parameters: WBC-BF: 0.977, RBC-BF: 0.975, MN#: 0.975, MN%: 0.983, PMN#: 0.981, PMN%: 0.983 and TC-BF: 0.990, NE-BF#: 0.979, LY-BF#: 0.959, MO-BF#: 0.973, EO-BF#: 0.899, HF-BF#: 0.992 (Supplementary Figure 3). The largest deviation from the line of equality was observed for EO-BF# (slope 1.240) and HF-BF# (slope 0.859). On average, only four samples were beyond the limits of agreements in the Bland-Altman analysis for each parameter (data not shown).
Discussion
The aim of this study was to compare the performance of the automated BF mode of the new Sysmex XR haematology analyser to the predecessor Sysmex XN-Series. The automated BF mode of the latter is well established and has been in use in routine clinical laboratories since 2011 [10]. Several studies have confirmed good performance of the XN BF mode when compared with the manual method of light microscopy and a Fuchs-Rosenthal haemocytometer [10, 12], [13], [14, 16], [17], [18], [19], flow cytometry [13] and digital imaging [13] for comparative cell counting. Several BF sample types including CSF [10], [11], [12], [13], [14, 16, 17], pleural fluid [10, 14, 16], [17], [18], peritoneal fluid [13, 14, 17, 18], CAPD [10] and synovial fluid [14, 17, 19] were included in these analytical method comparison studies. The XR and XN analytical platforms are similar utilising the same measurement principle albeit with different reagent systems. This, together with the proven performance of XN, was the rationale for choosing XN as the reference method for the purpose of confirming XR BF analysis performance. This study focussed exclusively on the comparison of parameter values obtained from both analysers, and the WBC abnormal scattergram flagging rate, as this could have an impact on the reliability of WBC-BF, TC-BF, and differential counts. Comparison of standard performance specifications (e.g., linearity, precision, etc.) was not part of this study.
For the diagnostic parameters, the results showed excellent correlation (0.830–0.996) for all BF types overall, regardless of dilution. When analysed by BF type, similar results were observed, except for MN% (0.622) and PMN% (0.639) in CSF. This can be attributed to the paucicellular nature of the CSF samples relative to other BF types, as exclusion of samples (38/86) with WBC-BF <0.003 × 10³/µL (XN and XR LoQ) from the analysis, resulted in an r value of 0.969 for both MN% and PMN%. Furthermore, the LoQ value is below the consensus cut-off value that differentiates normal and pathological samples (0.005 × 10³/µL in adults, 0.007 × 10³/µL in infants and 0.030 × 10³/µL in neonates [20]), hence the poor correlation for the percentage differential counts in CSF samples overall in this study would have no clinical impact.
The research parameters also performed very well with correlation coefficients ranging from 0.994 for LY-BF# to 0.900 for EO-BF#. It is not unexpected that EO-BF# had a lower correlation than the other parameters as eosinophil counts overall were very low or absent in most samples. When evaluating individual BF types, a slight negative bias in the EO-BF# count on the XR was observed for synovial fluids. Even though EO-BF# values are not intended for use in patient diagnosis, the difference between the measurements was judged as not clinically significant and can be explained by the different reagent systems, allowing for enhanced separation of neutrophils and eosinophils on XR.
The correlation coefficient for HF-BF# was lowest for CSF, but at 0.803 it is still very good. The HF-BF# parameter is an absolute count of cells that exhibit high fluorescence intensity exceeding that ordinarily observed for both reactive and malignant white blood cells, hence it is excluded from the WBC-BF count. HF-BF counts are typically elevated in BF samples containing non-haematological tumour cells [15, 16], macrophages and mesothelial cells [10]. The presence of macrophages in the CSF has been observed to be significantly higher in patients with carcinomatous meningeal infiltration [21], which is rare [22] in contrast to CSF infiltration in haematological malignancies [23]. Moreover, blasts and lymphoma cells mostly locate to the MN cluster and are thus included in the WBC-BF count. This would explain why the HF-BF counts were low to absent in the CSF samples, in contrast to pleural and peritoneal fluids where suspected malignant effusions are common indications for BF analysis. Furthermore, arthrocentesis is most commonly deployed in the work-up of inflammatory arthritides, which are associated with an abundance of macrophages in synovial fluid [24], thus accounting for higher HF-BF counts. However, the cellular composition of samples with high HF-BF counts was not investigated in this study.
The software functionality of both analysers includes the flagging of samples that are judged as potentially exhibiting evidence of interferences that may make numerical results unreliable. As the presence of a WBC abnormal scattergram flag may reduce the reliability of the WBC-related parameters, the flagging rate of XN and XR was compared. Although XR had a higher flagging rate than XN (8.79 vs. 6.06 %), the difference was not statistically significant (p=0.1869). The was a 4.5 % discordance between XN and XR WBC abnormal scattergram flag occurrence, but this had no impact on the correlation of values obtained for all potentially affected parameters. Correlation coefficients were similar for samples with no flags on both analysers, samples flagged by both systems, and samples where flagging was discordant. EO-BF# had the lowest Spearman coefficient and slope, which is to be expected because of the very low cell counts and small sample size for the “flag present” (n=17) and “discordant” group (n=15).
BAL has gained widespread acceptance as a minimally invasive technique in the diagnostic work up of lung disorders as it provides important information about pathological processes taking place at the alveolar level [25]. Although not included as an approved fluid in the instructions for use of the XN and XR, this study showed that BAL fluid analysis performance (Supplemental Figure 3) was equivalent to that of the approved fluids (Table 3). This may be of interest to laboratories that currently process BAL fluids manually, as there is a growing demand for this type of analysis.
Sample measurement exclusions from the analysis were mainly due to missing measurements on either XN or XR or instances where the linearity limits of the analyser were exceeded. In the latter case, where possible, samples were reanalysed in dilution. The performance of undiluted and diluted samples was equally good, an important observation as dilution is needed to obtain reliable results when the linearity of the analytical measurement range is exceeded, for viscous samples or when visual inspection of WDF showed sub-optimal cell cluster separation.
Synovial fluids accounted for most of the exclusions. This is attributed to the frequent occurrence of hypercellularity (thus exceeding linearity) observed in synovial fluid samples in this study. Upon dilution of these samples, an excellent correlation was observed between the two analysers for recalculated WBC-BF values using the dilution factors (data not shown), providing clinically usable data in these samples. High cell counts are associated with inflammation and infection, the diagnosis of which are the commonest indications for arthrocentesis [24].
This study has limitations. The reason for the few discrepant results observed was not ascertained as there was no independent method of adjudication, since the XN is the only routine method of BF analysis in the laboratory where this study was conducted. This is of relevance for the BAL analysis as there are no published comparative studies of XN against an alternate method for this fluid type. Another limitation is not having evaluated CAPD (a fluid type approved for measurement on both XN and XR) as a stand-alone BF type in this study. Such samples are infrequently encountered in our laboratory and thus were grouped together with peritoneal fluids for data analysis.
In conclusion, the findings of this study demonstrate that the automated BF analysis on the new Sysmex XR haematology analyser is equivalent to that noted on the well-established XN analyser. This was observed for CSF, peritoneal, pleural, and synovial fluids, as well as BAL, although the latter has not been validated by the manufacturer.
Funding source: Sysmex Corporation
Acknowledgments
With thanks to all lab technicians who performed all technical assays.
-
Research ethics: The study respected individuals’ rights to confidentiality and was in accordance with procedures supervised by Local Authorities responsible for Ethical Research (Ethics Committee Research UZ/KU Leuven, approval on May 18, 2021; reference S64732).
-
Informed consent: Not applicable.
-
Author contributions: All authors have accepted responsibility for the entire content of this manuscript and approved its submission.
-
Competing interests: Talent Hwandih, Konstantinos Mintzas and Marion Münster are employees of Sysmex. All other authors state no conflict of interest.
-
Research funding: The Sysmex XR haematology analyser and all consumables and reagents were provided by Sysmex Corporation Japan.
-
Data availability: The raw data can be obtained on request from the corresponding author.
References
1. Sikaris, KA. Enhancing the clinical value of medical laboratory testing. Clin Biochem Rev 2017;38:107–14.Search in Google Scholar
2. Cheson, BD. Clinical utility of body fluid analyses. Clin Lab Med 1985;5:195–208. https://doi.org/10.1016/s0272-2712(18)30865-5.Search in Google Scholar
3. Meyer, KC. Bronchoalveolar lavage as a diagnostic tool. Semin Respir Crit Care Med 2007;28:546–60. https://doi.org/10.1055/s-2007-991527.Search in Google Scholar PubMed
4. Akoh, JA. Peritoneal dialysis associated infections: an update on diagnosis and management. World J Nephrol 2012;1:106–22. https://doi.org/10.5527/wjn.v1.i4.106.Search in Google Scholar PubMed PubMed Central
5. CLSI. Body fluid analysis for cellular composition: approved guideline. Wayne, USA: Clinical and Laboratory Standards Institite; 2006.Search in Google Scholar
6. Bottini, PV, Pompeo, DB, Souza, MI, Garlipp, CR. Comparison between automated and microscopic analysis in body fluids cytology. Int J Lab Hematol 2015;37:e16–8. https://doi.org/10.1111/ijlh.12228.Search in Google Scholar PubMed
7. Martín, MJA, Queral, LA, Frías, LS, Amado, LV, Merino, A, Guadiana-Romualdo, LG. Automated cell count in body fluids: a review. Adv Lab Med 2021;2:149–61. https://doi.org/10.1515/almed-2021-0011.Search in Google Scholar PubMed PubMed Central
8. de Jonge, R, Brouwer, R, de Graaf, MT, Luitwieler, RL, Fleming, C, de Frankrijker-Merkestijn, M, et al.. Evaluation of the new body fluid mode on the Sysmex XE-5000 for counting leukocytes and erythrocytes in cerebrospinal fluid and other body fluids. Clin Chem Lab Med 2010;48:665–75. https://doi.org/10.1515/cclm.2010.108.Search in Google Scholar PubMed
9. Lehto, TM, Leskinen, P, Hedberg, P, Vaskivuo, TE. Evaluation of the Sysmex XT-4000i for the automated body fluid analysis. Int J Lab Hematol 2014;36:114–23. https://doi.org/10.1111/ijlh.12134.Search in Google Scholar
10. Fleming, C, Brouwer, R, Lindemans, J, de Jonge, R. Validation of the body fluid module on the new Sysmex XN-1000 for counting blood cells in cerebrospinal fluid and other body fluids. Clin Chem Lab Med 2012;50:1791–8. https://doi.org/10.1515/cclm-2011-0927.Search in Google Scholar PubMed
11. Roccaforte, V, Daves, M, Proserpio, V, Sciarini, F, Sangiorgio, R, Costanzo, A, et al.. Evaluation of body fluid mode of Sysmex XN-9000 for white blood cell counts in cerebrospinal fluid. J Lab Precis Med 2018;3:22. https://doi.org/10.21037/jlpm.2018.02.01.Search in Google Scholar
12. Buoro, S, Peruzzi, B, Fanelli, A, Seghezzi, M, Manenti, B, Lorubbio, M, et al.. Two-site evaluation of the diagnostic performance of the Sysmex XN body fluid (BF) module for cell count and differential in cerebrospinal fluid. Int J Lab Hematol 2018;40:26–33. https://doi.org/10.1111/ijlh.12723.Search in Google Scholar PubMed
13. Ivady, G, Barath, S, Szaraz-Szeles, M, Szabo, EK, Kovacs, K, Petruska, E, et al.. Comparative evaluation of body fluid analysis by Sysmex XN hematology analyzers, CellaVision, manual microscopy and multicolor flow cytometry. Ann Clin Lab Sci 2022;52:314–22.Search in Google Scholar
14. Evren, E, Us, E, Hekimoğlu, C, Karahan, Z. Cell counting chamber vs. Sysmex XN-1000 for determining white blood cell count and differentiation for body fluids. Turk J Biochem 2023;48:19–25. https://doi.org/10.1515/tjb-2022-0179.Search in Google Scholar
15. Gérard, D, Henry, S, Chatelain, B, Lesesve, JF. Detection of metastatic cells in body fluids by the automated Sysmex XN-9000 analyzer and flow-cytometric Infinicyt software. Int J Lab Hematol 2020;42:e146–9. https://doi.org/10.1111/ijlh.13190.Search in Google Scholar PubMed
16. Cho, YU, Chi, HS, Park, SH, Jang, S, Kim, YJ, Park, CJ. Body fluid cellular analysis using the Sysmex XN-2000 automatic hematology analyzer: focusing on malignant samples. Int J Lab Hematol 2015;37:346–56. https://doi.org/10.1111/ijlh.12292.Search in Google Scholar PubMed
17. Aguadero, VC-CR, Berlanga, E, Torra, M. Evaluation of biological fluid analysis using the Sysmex XN automatic hematology analyzer. Cytometry B Clin Cytom 2018;94:836–44. https://doi.org/10.1002/cyto.b.21587.Search in Google Scholar PubMed
18. Buoro, S, Mecca, T, Azzarà, G, Seghezzi, M, Dominoni, P, Crippa, A, et al.. Cell population data and reflex testing rules of cell analysis in pleural and ascitic fluids using body fluid mode on Sysmex XN-9000. Clin Chim Acta 2016;452:92–8. https://doi.org/10.1016/j.cca.2015.11.005.Search in Google Scholar PubMed
19. Seghezzi, M, Buoro, S, Manenti, B, Mecca, T, Ferrari, R, Zappalà, G, et al.. Optimization of cellular analysis of synovial fluids by optical microscopy and automated count using the Sysmex XN body fluid mode. Clin Chim Acta 2016;462:41–8. https://doi.org/10.1016/j.cca.2016.08.018.Search in Google Scholar PubMed
20. Fleming, C, Russcher, H, Lindemans, J, Jonge, R. Clinical relevance and contemporary methods for counting blood cells in body fluids suspected of inflammatory disease. Clin Chem Lab Med 2015;53:1689–706. https://doi.org/10.1515/cclm-2014-1247.Search in Google Scholar PubMed
21. Kobayashi, S, Saio, M, Fujimori, M, Hirato, J, Oyama, T, Fukuda, T. Macrophages in Giemsa-stained cerebrospinal fluid specimens predict carcinomatous meningitis. Oncol Lett 2020;20:352. https://doi.org/10.3892/ol.2020.12217.Search in Google Scholar PubMed PubMed Central
22. Chowdhary, S, Chamberlain, M. Leptomeningeal metastases: current concepts and management guidelines. J Natl Compr Cancer Netw 2005;3:693–703. https://doi.org/10.6004/jnccn.2005.0039.Search in Google Scholar PubMed
23. Dara, A, Mook, BB, Doorduijn, JK, van den Bent, MJ, Dinmohamed, AG, Bromberg, JEC. Efficacy of intrathecal chemotherapy in patients with central nervous system involvement of hematological malignancies: a retrospective analysis. J Neuro Oncol 2018;139:117–23. https://doi.org/10.1007/s11060-018-2849-x.Search in Google Scholar PubMed
24. Seidman, AJ, Limaiem, F. Synovial fluid analysis. StatPearls. Treasure Island (FL): StatPearls Publishing; 2022.Search in Google Scholar
25. Davidson, KR, Ha, DM, Schwarz, MI, Chan, ED. Bronchoalveolar lavage as a diagnostic procedure: a review of known cellular and molecular findings in various lung diseases. J Thorac Dis 2020;12:4991–5019. https://doi.org/10.21037/jtd-20-651.Search in Google Scholar PubMed PubMed Central
Supplementary Material
This article contains supplementary material (https://doi.org/10.1515/labmed-2023-0064).
© 2023 the author(s), published by De Gruyter, Berlin/Boston
This work is licensed under the Creative Commons Attribution 4.0 International License.
Articles in the same Issue
- Frontmatter
- Original Articles
- Proof of concept: stabilized whole blood material suitable for external quality assessment of near-patient testing devices
- Predictive value of combined serum IL-6 with UREA on severity of neonatal pneumonia: an observational study
- Performance evaluation of the automated body fluid analysis of the new Sysmex XR haematology analyser
- The quality and quantity of compounds affected by viral inactivation methods in dried blood spots
- Short Communication
- Second generation of soluble transferrin receptor assay – consequences for the interpretation of the ‘Thomas plot’
- Acknowledgment
- Acknowledgment