Diurnal variation of leukocyte counts affects the indirect estimation of reference intervals
-
Antje Torge

 ,
Mustafa Özcürümez
,
Mustafa Özcürümez

Abstract
It has been observed that the estimation of reference intervals of leukocytes in whole venous blood leads to higher upper reference limits (uRLs) with indirect methods than has been reported in the literature determined by direct approaches. This phenomenon was reinvestigated with a newer, more advanced indirect method, and could be confirmed. Furthermore, a diurnal variation was observed with lower values during the morning and higher values in the late afternoon and at night. This observation can explain why indirect approaches using samples collected during 24 h lead to higher uRLs than direct methods applied on samples collected presumably in the morning.
Naus et al. [1] were the first authors who notified that the leukocyte count in whole venous blood estimated by an indirect method led to higher upper reference limits (uRLs) than those reported in the literature determined by direct approaches. The authors found an uRLs of 12.3·109/L in a mixed population (45% hospitalised patients, 45% out-patients, 10% blood donors) and cited two references from the literature with 10.0·109/L. A more recent study with apparently “healthy” hospital employees reported 3.9–10.9·109/L for men and 4.49–12.68·109/L for women [2].
Naus et al. [1] stated: “for leukocytes, the frequency distribution could be very well described by two overlapping Gaussian curves. It is quite not clear whether this second curve represents a true subpopulation. The fact, however, that about 30% of all data is part of the second distribution, indicates that they cannot be classified as ‘abnormals’. Possibly, this group represented persons who suffered from mild infections in the recent past”. The two Gaussian distributions were hypothesised and not supported by realistic data.
We reinvestigated the observation of Naus et al. with different subpopulations of one primary health care laboratory and two tertiary health care laboratories with a newer, more advanced indirect approach.
No relevant differences were found between men and women, and no age dependency was observed between 18 and 100 years (Figure 1). Therefore, RIs were estimated for the age interval 18–100 years for men and women combined (Table 1). The reference intervals (RIs) determined during the whole day (0–24 h) were similar to those reported by Naus et al. (3.8–12.31·109/L). The RIs of ambulant patients were slightly lower than those of hospitalised patients. The primary care laboratory had the lowest values which were almost identical to the RIs reported by a recent study with a direct method using the same analytical platform [2].

Reference limits of leukocytes in whole venous blood (×109/L) dependent on the age (years).
The upper curves represent the upper reference limits, the lower the lower reference limits (blue symbols for men, red symbols for women). The data are from laboratory 3 (n=862,193).
Reference limits (RLs) with confidence limits (CLs) of leukocyte counts (×109/L) in whole blood estimated by the truncated minimum chi-square (TMC) approach. The data sets (n, number of data) were of ambulant and hospitalised women and men (18–100 years).
| Day time | Lower RL | CLs | Upper RL | CLs | n | uPreva | ||
|---|---|---|---|---|---|---|---|---|
| Laboratory 1 | 0–24:00 | Ambulant | 3.91 | 3.904–3.923 | 13.39 | 13.357–13.422 | 553,249 | 2.4 |
| 0–06:00 | 4.72 | 4.635–4.262 | 16.52 | 16.278–16.628 | 16,808 | 0.7 | ||
| 10:00–11:00 | 3.63 | 3.603–3.658 | 12.34 | 12.202–12.367 | 68,579 | 2.7 | ||
| 0–24:00 | Hospitalised | 3.91 | 3.904–3.922 | 13.37 | 13.343–13.408 | 995,453 | 2.4 | |
| 0–06:00 | 4.72 | 4.656–4.721 | 16.52 | 16.154–16.628 | 48,851 | 0.7 | ||
| 10:00–11:00 | 3.63 | 3.603–3.652 | 12.34 | 12.202–12.367 | 136,284 | 2.7 | ||
| Laboratory 2 | 0–24:00 | Ambulant | 4.15 | 4.114–4.184 | 13.28 | 13.167–13.394 | 39,256 | 3.6 |
| 0–06:00 | 4.94 | 4.741–5.143 | 15.48 | 14.848–16.110 | 1,807 | 4.2 | ||
| 8:00–10:00 | 3.89 | 3.774–4.012 | 12.02 | 11.657–11.942 | 3,477 | 5.6 | ||
| 0–24:00 | Hospitalised | 4.23 | 4.204–4.254 | 13.92 | 13.840–14.004 | 100,076 | 8.5 | |
| 0–06:00 | 4.47 | 4.324–4.615 | 18.54 | 17.944–19.152 | 4,993 | 5.2 | ||
| 8:00–10:00 | 3.77 | 3.681–3.850 | 13.58 | 13.277–13.888 | 8,366 | 4.9 | ||
| Laboratory 3 | Ambulant | 3.94 | 3.918–3.946 | 11.2 | 11.179–11.220 | 862,193 | 5.1 |
-
Leukocyte counts were determined in two university hospitals (laboratory 1, university of Kiel, Sysmex XN 1000) and (laboratory 2, university of Bochum, Sysmex XN 1000), and in one laboratory of the primary health care section (laboratory 3, Karlsruhe, Sysmex XE2100). The laboratory results of patients were selected as described in ref. [3]. Laboratory 3 received less than 5% of samples from hospitalized patients. The laboratories which provided the measurement values were accredited according to ISO 15189 and followed the Guidelines of the German Medical Association on Quality Assurance in Medical Laboratory Examinations (RiliBAEK) [4]. The TMC method (truncated minimum chi-square) was performed as recently described [5]. RL, reference limits; CL, confidence limits.
-
aUpper prevalence in % of the total number of data in the particular subpopulation.
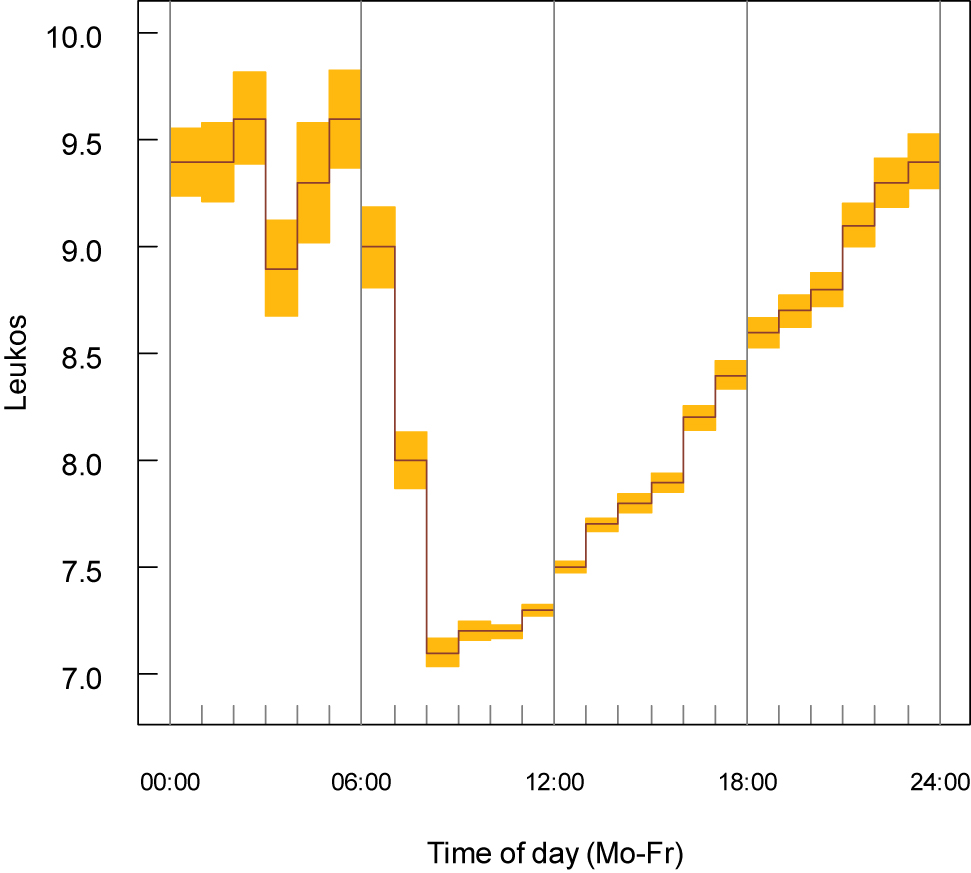
Furthermore, the data sets could be stratified according to the time when the samples arrived in the laboratory. It may be assumed that the transport times are approximately the same for all samples (about 2 h). The daytime variation has a similar pattern from Monday to Friday. If the values from Monday to Friday are combined (Figures 2–4, not stratified by sex and age), a maximum was detected during the night and a minimum in the morning (8:00–12:00). Therefore, uRLs were lower during the morning and higher in the late afternoon (Table 1). A diurnal variation has also be reported by others [5], [6].

Diurnal variation of the leukocyte count in whole venous blood (hospitalised patients, laboratory 1, n=995,453).
Daily observations are calculated during one week and the medians from Monday to Friday are presented (×109/L). The yellow areas represent the approximate 95% confidence limits based on the median absolute deviation.
Diurnal variation of the leukocyte count in whole venous blood (hospitalised patients, laboratory 2, n=100,076).
Daily observations are calculated during one week and the medians from Monday to Friday are presented (×109/L). The yellow areas represent the approximate 95% confidence limits based on the median absolute deviation.

Diurnal variation of the leukocyte count in whole venous blood (ambulant patients, laboratory 2, n=39,256).
Daily observations are calculated during one week and the medians from Monday to Friday are presented (×109/L). The yellow areas represent the approximate 95% confidence limits based on the median absolute deviation.
The daytime variation can explain why the upper RLs estimated by indirect methods are slightly higher than those derived by direct methods. Whereas indirect methods use samples collected during 24 h, direct methods usually apply samples taken during the morning (close to the nadir) from young, “healthy” subjects, often employed by hospitals [2]. Upper RLs determined in primary health care laboratories are close to the values from direct methods. Thus, the higher values are probably not mainly caused by contamination of the subpopulation used with subclinical recent inflammatory processes as suggested by Naus et al. [1].
For hospitalised patients, different upper RLs may be used for samples taken during the morning, and for samples taken during the late afternoon and during night. The time frame depends on the internal organisation of the hospitals.
The diagnostic efficiency of leukocytosis could not be studied from the available data sets. However, the prevalence of leukocytosis could be calculated by the truncated minimum chi-square (TMC) procedure as recently described [3]. The prevalences of leukocytosis varied between 0.7 and 2.7% in laboratory 1, and between 3.6 and 8.5% in laboratory 2 (Table 1) and were not higher during the night than during the morning. The prevalences were based on RLs derived from the particular population subsets and were used as a surrogate for the diagnostic efficiency. If the upper RLs seen during the night would be caused by a higher rate of subclinical diseases, the upper prevalence should be higher during the night. This was not the case.
Diurnal variations of lymphocytes in whole venous blood show similar pattern as observed for leukocytes [6], [7]. It is interesting to note that haemoglobin concentrations and erythrocyte counts have an opposite pattern with higher values in the morning and lower values in the afternoon [6], [8].
-
Research funding: None declared.
-
Author contributions: All authors have accepted responsibility for the entire content of this manuscript and approved its submission.
-
Competing interests: Authors state no conflict of interest.
-
Informed consent: Informed consent was obtained from all individuals included in this study.
-
Ethical approval: Research involving human subjects complied with all relevant national regulations, institutional policies and is in accordance with the tenets of the Helsinki Declaration (as revised in 2013), and has been approved by the authors’ Institutional Review Board or equivalent committee.
References
1. Naus, AJ, Borst, A, Kuppens, PS. The use of patient data for the calculation of reference values for some haematological parameters. J Clin Chem Clin Biochem 1980;18:621–5. https://doi.org/10.1515/cclm.1980.18.10.621.Search in Google Scholar PubMed
2. Pekelharing, JM, Hauss, O, de Jonge, R, Lockhoff, J, Sodikromo, J, Spaans, M, et al.. Haematology reference intervals for established and novel parameters in healthy adults. Diagn Perspect 2010;1:1–11.Search in Google Scholar
3. Haeckel, R, Wosniok, W, Torge, A, Junker, R. Age and sex dependent reference intervals for uric acid estimated by the truncated minimum chi-square (TMC) approach, a new indirect method. J Lab Med 2020;44:157–63. https://doi.org/10.1515/labmed-2019-0164.Search in Google Scholar
4. Richtlinie der Bundesärztekammer zur Qualitätssicherung laboratoriumsmedizinischer Untersuchungen (Rili-BÄK). Dt Aerzteblatt 2014;38:A1583–618.10.1515/labmed-2013-0040Search in Google Scholar
5. Wosniok, W, Haeckel, R. A new estimation of reference intervals: truncated minimum chi-square (TMC) approach. Clin Chem Lab Med 2019;57:1933–47. https://doi.org/10.1515/cclm-2018-1341.Search in Google Scholar PubMed
6. Sennels, HP, Jörgensen, HL, Hansen, ALS, Goetze, JP, Fahrenkrug, J. Diurnal variation of hematology parameters in healthy young males: the Bispebjerg study of diurnal variation. Scand J Clin Lab Invest 2011;71:532–41. https://doi.org/10.3109/00365513.2011.602422.Search in Google Scholar PubMed
7. Kanabrocki, EI, Sothern, RB, Schewing, LE, Vesely, DL, Tsai, TH, Shelstad, J, et al.. Reference values for orcadian rhythms of 98 variables in clinically healthy men in the fifth decade of life. Chronobiol Int 1990;7:445–61. https://doi.org/10.3109/07420529009059156.Search in Google Scholar PubMed
8. Hilderink, JM, Klinkenberg, LJJ, Aakre, KM, de Wit, NCJ, Henskens, YMC, van der Linden, N, et al.. Within-day biological variation and hour-to-hour reference change values for hematological parameters. Clin Chem Lab Med 2017;55:1013–24. https://doi.org/10.1515/cclm-2016-0716.Search in Google Scholar PubMed
© 2021 Antje Torge et al., published by De Gruyter, Berlin/Boston
This work is licensed under the Creative Commons Attribution 4.0 International License.
Articles in the same Issue
- Frontmatter
- Editorial
- Indirect approaches to estimate reference intervals
- Reviews
- Review of potentials and limitations of indirect approaches for estimating reference limits/intervals of quantitative procedures in laboratory medicine
- Separating disease and health for indirect reference intervals
- Opinion Papers
- Functional reference limits: a case study of serum ferritin
- Application of the TML method to big data analytics and reference interval harmonization
- Reference limits of high-sensitive cardiac troponin T indirectly estimated by a new approach applying data mining. A special example for measurands with a relatively high percentage of values at or below the detection limit
- Age and sex dependent reference intervals for random plasma/serum glucose concentrations related to different sampling devices and determined by an indirect procedure with data mining
- Original Articles
- Indirect estimation of reference intervals using first or last results and results from patients without repeated measurements
- The influence of sampling time on indirect reference limits, decision limits, and the estimation of biological variation of random plasma glucose concentrations
- Short Communications
- Diurnal variation of leukocyte counts affects the indirect estimation of reference intervals
- Reference intervals for platelet indices in seniors and frequency of abnormal results in a population-based setting: a comparison between directly and indirectly estimated reference intervals
- Calculation of indirect reference intervals of plasma lipase activity of adults from existing laboratory data based on the Reference Limit Estimator integrated in the OPUS::L information system