Sensitive determination of ethyl glucuronide in serum and whole blood: detection time after alcohol exposure compared with urine
-
Jasna Neumann


Abstract
Objectives
Ethyl glucuronide (EtG) is a conjugated, minor ethanol metabolite used as a biomarker for recent alcohol intake. EtG is commonly measured in urine as part of a drug testing service but has also attracted attention for measurement in blood. However, due to lower EtG concentrations in blood, the detection time is expected to be shorter. The present work aimed to improve the analytical sensitivity of EtG in blood, to prolong the detection time.
Methods
A liquid chromatography-tandem mass spectrometry method was developed for EtG in whole blood and serum, using protein precipitation with methanol, a deuterated internal standard, and selected reaction monitoring mode with negative electrospray ionization. No significant matrix effect was observed. The method generated linear results in the measuring range 1.0–50 μg/L, the accuracy was within ±10% and the imprecision <15%.
Results
In 46 patients followed with daily blood and urine sampling during alcohol detoxification, the mean (median) time to first negative serum EtG sample was 112 (111) h. This was slightly longer than for EtG in urine, using 100 μg/L as cutoff. The detection rate was 76% for serum EtG and 68% for urine EtG. In cases where serum EtG was positive but urine EtG negative, the urine samples tended to be more dilute as indicated by lower creatinine concentrations. On admission to hospital, the whole-blood and serum EtG concentrations correlated with the breath ethanol concentration (p = 0.012 and p = 0.027, respectively). In 100 patients sampled at admission to hospital for other reasons than substance abuse and with no ethanol detected in breath, 40% tested positive for EtG in serum and 43% in urine. In 79 paired urine and serum EtG measurements, the median urine/serum concentration ratio was 155.
Conclusions
A sensitive method was developed for EtG measurement in whole-blood and serum specimens, offering similar detection time for recent alcohol exposure compared with routine EtG measurement in urine.
Reviewed Publication:
Steimer W. Edited by:
Introduction
Ethyl glucuronide (EtG) is a direct, minor metabolite of ethanol that is routinely used as a biomarker for recent drinking. EtG measurement has become an established complementary parameter in urine drug testing and commercial immunochemical screening tests are available [1], [2]. To secure a preliminary positive immunoassay EtG result, mass spectrometry (MS) methods are used and often include also measurement of ethyl sulfate (EtS), another conjugated ethanol metabolite [3], to confirm alcohol intake [4], [5]. This is because EtG may be both formed and degraded after sampling, if the sample contains ethanol and/or proper transport and storage conditions are not applied [6], [7]. Other obstacles with using urine as the specimen is the risk for adulteration during sampling and the fact that the urine concentration may vary more than 10-fold due to diuresis.
Alternative specimens to urine for use in drug testing are currently receiving increasing attention [8]. In addition to in urine, EtG has been measured in other body fluids, e.g. whole blood, serum and oral fluid, and in hair [9]. EtG was shown to be present in serum after ethanol intake, shortly after first receiving attention as a possible alcohol biomarker [10]. Subsequently, EtG measurement in blood received interest in traffic medicine as a hangover indicator and in post-mortem investigations [11], [12], [13]. A main reason for using EtG as an alcohol biomarker is its prolonged detection time for recent drinking, compared with a breath or blood ethanol test. However, because EtG levels are much lower in blood, this has resulted in a shorter detection time compared with that for EtG in urine [14].
EtG has been measured in whole-blood and serum specimens by methods based on gas chromatography (GC) and liquid chromatography (LC) combined with MS, and by capillary electrophoresis [15], [16], [17], [18], [19], [20], [21], [22], using solid-phase extraction or protein precipitation for sample preparation. Currently, LC-MS is mainly used as it allows EtG to be analyzed in its native form [16]. Typically, methods for EtG in whole blood or serum have used lower measuring ranges (~50–100 μg/L) compared to urine methods (~100–500 μg/L). Even so, due to a >100-fold lower EtG concentration in blood [23], [24], this has resulted in a shorter detection time of EtG in blood for recent alcohol exposure [25].
This work aimed to develop a more sensitive LC-MS/MS method for EtG in whole-blood and serum specimens, and to determine the detection time for EtG in blood compared to urine in different clinical populations.
Materials and methods
Chemicals
EtG and EtG-d5 (internal standard) were purchased from LGC Standards GmbH (Wesel, Germany), methanol (ROTISOLOV® ≥99.98%, Ultra LCMS) and formic acid (zur Analyse; 98–100%) from Carl Roth (Karlsruhe, Germany) and acetonitrile (ULC/MS) from Biosolve B.V. (Valkenswasrd, The Netherlands). Pure water (ULC/MS Optigrade®) was from LGC Promochem GmbH (Wesel, Germany).
A serum control specimen with an assigned EtG concentration of 640 μg/L was obtained from ACQ Science GmbH (Rottenburg, Germany).
Analytical procedures
Preparation of calibrators and controls
Blank blood was obtained from laboratory staff members who reported no intake of alcohol for at least 1 week, or surplus aliquots of samples from children <11 years of age from the routine sample flow at the clinical chemistry laboratory. EtG was not detected in the serum blank samples used for preparation of calibrators and controls.
EtG calibrators were prepared by adding 3–250 μL (n=10) of a freshly made stock solution (100 μg/L EtG in methanol) to 1.5 mL vials. The methanol was evaporated with heated nitrogen and the residue was dissolved in 0.5 mL blank serum. The final calibrator concentration range was 0.60–50 μg/L EtG. Calibrators were stored at −20°C for a maximum of 6 months.
A quality control sample (32 μg/L EtG) was prepared by diluting the 640 μg/L EtG control material 20 times with blank serum, and two controls at lower concentrations (0.71 and 1.28 μg/L EtG) were prepared by further dilution with blank serum. Prepared controls were stored at −20°C for a maximum of 6 months.
Preparation of whole-blood and serum extracts
Frozen whole blood or serum was thawed on ice. Thereafter, a 20-μL aliquot was mixed with 200 μL methanol containing 20 pg EtG-d5. The mixture was shaken thoroughly and centrifuged at 12,000×g for 10 min (Eppendorf MiniSpin, Eppendorf AG, Hamburg, Germany). Of the resulting supernatant, 200 μL was transferred to autosampler vials (1 mL insert) and evaporated to dryness using nitrogen gas and a heatable evaporation block (Liebisch Labortechnik, Gebr. Liebisch GmbH & Co. KG, Bielefeld, Germany). The residue was dissolved in 80 μL 0.1% formic acid.
Instrumentation
The LC-MS/MS system consisted of a Waters Acquity UPLC (ultra-performance liquid chromatograph) with a vacuum degasser, binary pumps, autosampler (15°C) and sample manager connected to a XEVO TQ-S tandem MS with MassLynx™ Software version 4.1 (Waters Co, Milford, MA, USA). The electrospray interface (ESI) was used with the instrument operating in negative ion mode. Nitrogen was used as a nebulizer, desolvation and cone gas, and argon as a collision gas.
LC was performed by injecting a 10-μL sample onto a 1.8-μm 150×2.1 mm (inner diameter) HSS T3 C18 column (Waters Co). The column oven temperature was 40°C. The chromatography system was operated in gradient mode with 300 μL/min flow rate. Solvent A consisted of 0.1% (26.5 mmol/L) formic acid and solvent B of methanol with 0.1% formic acid. The gradient was increased linearly from 2% to 100% B over 0–2.70 min, held at 100% B for 0.30 min, decreased to 2% B over 0.1 min and then finally equilibrated at 2% B for 1.10 min. The total run time between injections was 4.5 min.
The following MS conditions were used: source temperature 150°C; desolvation gas temperature 650°C; capillary voltage 1.2 kV; collision gas flow 0.20 mL/min; cone voltage 20 V; scan dwell time 41 ms. The monitoring time was between 2.30 and 3.30 min. The selected ions and collision energy used for each analyte were: for EtG m/z 221.1>75.5 (quantifier, 14 eV), 221.1>85.1 (qualifier, 16 eV), 221.1>113.1 (qualifier, 14 eV) and for EtG-d5 m/z 226.1 to the same product ions and using the same collision energies. In order to approve EtG identification in an unknown sample, the peak area ratios between the quantifier and each qualifier ion had to fulfill the following criteria: peak area ratio >0.5 criterion ±20%, peak area ratio 0.2–0.5 criterion ±25%.
Quantification of EtG was done using calibration curves constructed by using the peak area ratio between EtG and EtG-d5 vs. the EtG concentration.
Analysis of EtG and creatinine in urine
EtG in urine was measured with a routine LC-MS/MS method that was accredited for forensic use according to ISO 17025. An aliquot of 25 μL of urine was diluted 20 times with an internal standard solution and 10 μL injected. The measuring range was 0.1–100 mg/L and the imprecision <5%. Method accuracy was documented by participation in the Society of Toxicological and Forensic Chemistry (GFTCh) proficiency program (www.gftch.org).
Creatinine analysis was performed with the Jaffé method on an Olympus AU680 with the DRI® Creatinine-Detect® Test (Microgenics GmbH, Passau, Germany). The creatinine concentrations were used to calculate normalized EtG urine concentrations (μg EtG/mg creatinine).
Method validation experiments
The linearity of the method was studied by preparing and analyzing the whole set of calibrators with concentrations 0.6, 0.8, 1.0, 1.2, 1.4, 2.0, 5.0, 10.0, 20.0 and 50.0 μg/L 6 times on the same day within one series according to the GTFCh validation guidelines [26]. In the calibration curve calculations, no weighting was used and the origin was excluded. The lower limit of quantification (LLOQ) and limit of detection (LOD) were documented using prepared controls at 0.4, 0.6, 0.8, 1.0, 1.2 and 1.4 μg/L following the GTFCh validation guidelines, alternative DIN 32645. The limits were set based on using the qualifier ion and the criterion was a positive detection based on the identification criteria [26].
Serum and whole-blood samples were collected from eight non-drinkers and 50 routine patient samples from children aged <11 years, to study possible chromatographic background or interference at the monitored channels.
Imprecision and accuracy were studied at three control concentration levels and with prepared controls in whole blood and serum. The controls were analyzed in triplicate for 7 consecutive days.
Interference from disulfiram (500 μg/L), 25 antiepileptic drugs (2.8–98 mg/L) and 31 benzodiazepines, zaleplon, zolpidem and zopiclone (31–1630 μg/L) were studied in prepared high-level controls. Interference from abused drugs was studied in authentic serum samples with detected substances.
Matrix effects were evaluated in both infusion and addition experiments. For the infusion experiment, stock solutions of EtG and EtG-d5 were prepared with a concentration of 1.0 mg/L. Five negative samples were prepared without internal standard and injected in an infusion experiment. The EtG and EtG-d5 stock solutions were infused in the mass spectrometer with a flow rate of 15 μL/min during the chromatography of the prepared samples. Ion suppression was detected between 2.50 and 2.65 min just before the elution of EtG (2.88 min). For the addition experiment, six matrix controls (1.0 μg/L and 40 μg/L) and six blank matrix samples were prepared. The six extracts from blank matrix samples and six blank mobile phase extracts were spiked with the analyte with concentrations corresponding to the matrix controls. Recovery was calculated from the peak area ratios of the matrix controls and the spiked matrix extracts. Matrix effects were calculated from the peak area ratios of the spiked matrix extracts and the six mobile phase extracts according to the GTFCh validation guidelines [26] and Matuszewski et al. [27].
The stability of prepared extracts in the autosampler was studied using EtG controls at 1.28 and 32 μg/L. The extracts were reinjected 6 times every 2 h over 12 h. Stability during freezer storage has been documented before [28].
Clinical studies
Study 1
Alcohol-dependent patients (meeting the Diagnostic and Statistical Manual of Mental Disorders, 4th Edition [DSM IV] criteria) being hospitalized for recovery from acute alcohol intoxication (Clinic of Psychiatry and Psychotherapy at University Hospital of Mainz) were randomly selected and invited to participate in this study. Only patients with a breath ethanol concentration ≥1 g/L on admission and a markedly lower or negative value at the second testing carried out about 18 h later (confirming they were in the elimination phase) were included. The number of patients was 49 (39 males aged 24–72 years and 10 females aged 32–68 years). Two patients terminated the participation after day 1 and one patient after day 2.
Paired urine and blood samples were collected on admission to hospital, a second sample the next morning and then once every ~24 h over several days in 46 patients. On each occasion, a breath ethanol test and clinical observation were used, to verify abstinence from alcohol during the study period. The urine specimens were collected in plastic tubes without preservative. Blood (ethylenediaminetetraacetic acid [EDTA] whole blood and serum) was collected by venipuncture into vacutainer tubes. All samples were stored at –20°C until analysis.
Study 2
Patients hospitalized (Psychiatric Hospital Fachklinik Katzenelnbogen) for various psychiatric disorders except drug and alcohol dependence were randomly selected and invited to participate in this study. Only patients testing negative for breath ethanol at admission and reporting social drinking habits were included. The number of patients was 100 (30 males aged 20–72 years and 70 females aged 22–74 years). On admission to hospital, paired urine and serum samples were collected. All samples were stored at –20°C until analysis.
Ethics
Both studies were approved by the Ethics Committee at the University of Mainz (Germany).
Statistics
Statistical calculations were done using Xact® chart software (Scilab, Hamburg, Germany) and MedCalc (MedCalc Software, Ostend, Belgium). Valistat 2.0 (Arvecon GmbH, Walldorf, Germany) was used for statistical calculations related to the method validation.
Results
Method development and validation
The main modification done when adapting the existing urine EtG method for use on serum and blood samples was to include a protein precipitation step and subsequent concentration of the supernatant. This procedure resulted in a 4-fold dilution of the specimen prior to injection. The 100-fold lower measuring range compared with that for urine was possible, due to a higher inborn sensitivity of the LC-MS instrument employed for blood EtG and less matrix effect. The extraction recovery of EtG in the protein precipitation step was ~90%. The retention time of EtG was typically in the range 2.5–3.0 min (<1 s shorter for EtG-d5). The column void eluted at ~0.8 min, meaning that EtG was well separated from early eluting components, and no matrix influence was observed in the infusion experiment. However, in the addition experiment at two EtG concentrations (1 and 40 μg/L), ~25% signal enhancement was observed but this was compensated for by the use of a deuterated internal standard. No interference from therapeutic or abused drugs was observed.
For serum standards, there was a linear relationship between the EtG concentration and the peak area ratio between EtG and EtG-d5 with a correlation coefficient (r) >0.998. The LOD was 0.3 μg/L and the LLOQ 0.4 μg/L. The intra- and inter-assay imprecision and accuracy were evaluated in the range 0.7–32 μg/L EtG, and the results demonstrated that quantification was performed with ≤15% imprecision (coefficient of variation [CV]) and <9.0% bias (Tables 1 and 2).
Analytical imprecision and accuracy of ethyl glucuronide (EtG) measurement in serum.
| EtG concentration, μg/L | Mean, μg/L | CV, % | Bias, % | n |
|---|---|---|---|---|
| Intra-assay | ||||
| 0.71 | 0.67 | 12.4 | −5.4 | 6 |
| 1.28 | 1.36 | 8.9 | 5.9 | 6 |
| 32.0 | 32.6 | 5.1 | 2.0 | 6 |
| Inter-assay | ||||
| 0.71 | 0.66 | 12.8 | −7.0 | 27 |
| 1.28 | 1.28 | 12.2 | 0 | 27 |
| 32.0 | 33.8 | 6.2 | 5.7 | 27 |
| QC samples in routine use over 3 months | ||||
| 0.71 | 0.70 | 10.5 | −1.4 | 71 |
| 1.28 | 1.26 | 9.9 | −1.6 | 71 |
| 32.0 | 31.8 | 7.0 | −0.6 | 71 |
| Calibration range | 0.6–50 μg/L | |||
| Recovery | ~90% | |||
| LOD | 0.3 μg/L | |||
| LLOQ | 0.4 μg/L | |||
-
QC, quality control.
Analytical imprecision and accuracy of EtG measurement in whole blood.
| EtG concentration, μg/L | Mean, μg/L | CV, % | Bias, % | n |
|---|---|---|---|---|
| Intra-assay | ||||
| 0.93 | 0.85 | 15.0 | −8.6 | 6 |
| 1.81 | 1.94 | 7.4 | 7.3 | 6 |
| 28.0 | 30.0 | 9.0 | 7.1 | 6 |
| Inter-assay | ||||
| 0.93 | 0.89 | 14.0 | −4.5 | 27 |
| 1.81 | 1.94 | 9.2 | 6.9 | 27 |
| 28.0 | 28.0 | 9.2 | 0 | 27 |
In the lowest concentration range, background peaks were observed at all EtG transitions both with mobile phase and blank serum extracts, which affected the choice of the measuring range. Figure 1 displays representative results in a low serum control, patient serum, blood and urine samples. An evaluation using blank serum or whole-blood extracts from several individuals demonstrated that the 1.0 μg/L EtG concentration level was well separated from this background noise and was therefore selected as the lower reporting limit. Serum from eight teetotalers all gave a low background response for EtG at the three channels monitored. In no case the response fulfilled criteria for identification of EtG. The mean response on the monitored quantifier transition was above the LLOQ level and at 60% of the reporting limit. The same was observed when analyzing serum from 50 children below 12 years of age.


Chromatograms obtained from the analysis of ethyl glucuronide (EtG) in serum and blood samples.
Results are (A) a low serum control sample (0.75 μg/L), (B) a positive whole-blood patient sample (2.0 μg/L), (C) a positive serum patient sample (1.9 μg/L) and (D) a positive urine patient sample (553 μg/L). The three upper traces represent the different transitions monitored for EtG and the three lower traces are for the internal standard (IS), EtG-d5. The first traces for EtG and IS are the transitions used for quantification. The elution gradients differed slightly between serum/whole blood and urine.
The method was developed and fully validated for serum as the primary specimen but also successfully applied and partially validated for use on whole blood. A comparison of serum and whole-blood EtG concentrations on paired patient samples (study 1) demonstrated that the mean concentration value was higher in serum than in whole blood; mean ratio 1.3±0.4 (standard deviation [SD]) (Figure 2). However, the ratio appeared to be concentration dependent (Figure 2).

The correlation between EtG in whole blood and serum presented in logarithmic scale.
The regression line is somewhat tilted (slope 0.50) toward a higher serum/whole blood ratio at higher concentrations.
Detection time of EtG in whole blood vs. urine
In study 1, 46 patients were monitored daily after admission to hospital for detoxification. Of these, 201 whole-blood samples had measurable EtG (Figure 3). The time to first negative whole-blood EtG sample (cutoff 1.0 μg/L) ranged from 22 to 179 h, with a mean (median) value of 112 (111) h. For comparison, in the parallell urine samples collected, the time to first negative urine EtG (cutoff 100 μg/L) ranged from 21 to 184 h, with a mean (median) value of 98 (92) h.
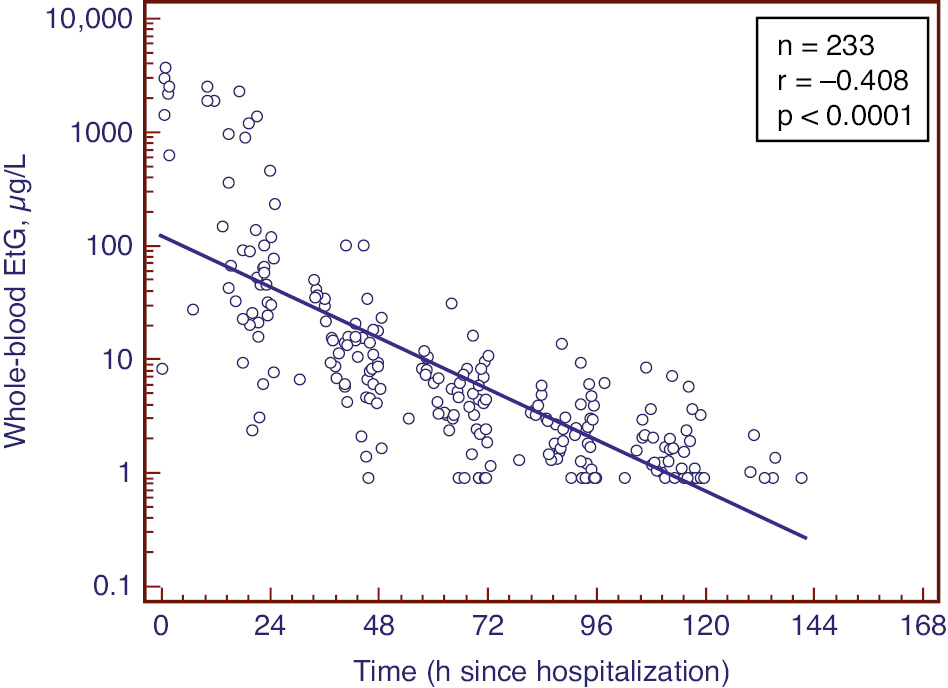
The correlation between EtG in whole blood and time since hospitalization presented in semilogarithmic scale.
The regression line indicates an elimination half-life of 16 h. The figure includes the data including the first negative sample set to a value of 0.9 μg/L.
The detectability of EtG in whole blood vs. urine was compared for the entire set of paired samples (n=255). Overall, 78% of the cases agreed concerning the qualitative outcome (i.e. positive/negative), with 76% positive whole-blood EtG results and 68% urine EtG positive. In 39 cases with a positive whole blood but a negative urine EtG result, the urinary creatinine concentration was 2.3-fold lower than in the 17 opposite cases, indicating that urine dilution was an important factor for the deviant results.
Study of EtG in samples from social drinkers
EtG was measured in paired serum and urine specimens collected from 100 patients admitted to hospital for treatment of other causes than drug abuse (study 2). EtG was positive in 40 serum and 43 urine samples and in 39 cases the results were in agreement. In the deviant cases testing positive for EtG in urine but negative in serum, the mean creatinine concentration was 6.7-fold higher than in the sample with opposite results.
Serum vs. urine EtG concentrations
For this evaluation, data from study 1, day 1 and study 2 were combined. For the entire set of paired serum and urine EtG measurements (n=79), the serum and creatinine normalized urine concentrations were significantly correlated (Figure 4). The mean urine/serum EtG concentration ratio was 255±264 (SD, median 155) and it was not concentration dependent.

The correlation between EtG in serum and urine presented in logarithmic scale.
Data are combined from day 1 of study 1 and positive cases from study 2. The urine concentrations were normalized using the creatinine concentrations, which increased the correlation coefficient from 0.790 to 0.907. The statistical calculations were with non-logarithmic data.
Serum and blood EtG vs. breath ethanol concentration
Both the serum and whole-blood EtG concentrations were weakly (r=0.32 and 0.36, respectively) but significantly (p=0.027 and 0.012) correlated with the breath ethanol concentration on admission to hospital, and so was the EtG detection time in whole blood (r=0.45; p<0.01).
Discussion
EtG was reported as a minor ethanol metabolite already in the 1950s [29], but it was following the work of Schmitt et al. in 1995 [15] that EtG was proposed as a biomarker of recent alcohol consumption [30]. Since then, urine measurement of EtG has been established as a routine parameter in clinical and forensic drug testing [31], [32] and in clinical trials [33]. Forensic applications, however, have mainly focused on blood as the specimen. In traffic medicine, EtG can be used as an indicator of hangover [12] and in post-mortem investigations as a valuable complement to ethanol measurement [13].
In the present study, a method for measuring EtG in serum and whole-blood samples with more than 10-fold improved sensitivity [15], [16], [17], [18], [19], [20], [21], [22] was successfully developed. The method is based on a simple sample preparation procedure that easily can be automated. The method validation demonstrated no interference from matrix in the measuring range, and the accuracy and imprecision were within acceptable limits. However, due to a biological background near the LLOQ, the decision limit was set slightly higher. The validation results further supported that whole-blood EtG measurement could be done using serum calibrators. The robustness of the method in routine use was confirmed by results from the internal quality control system and by participation in a proficiency test program.
The concentrations and pharmacokinetics of EtG in serum and whole blood after a single ethanol intake are well documented [23], [24], [34], [35]. In summary, the EtG concentration peaks a few hours later than ethanol and it is eliminated with first-order kinetics and a terminal half-life of ~2.5 h [23], [24], [34], [35]. Based on this, the observed correlation between the whole-blood and serum EtG concentrations and the breath ethanol concentration on admission to hospital, as well as with the detection time, was expected.
The mean ratio of serum and urinary EtG concentrations observed in this study (>100) was in agreement with that calculated from Cmax values after controlled single ethanol dose intake [23], [24]. Also, the serum-to-whole blood ratio has been studied before and the mean ratio of ~1.7 [36] agrees with the present results. The observation that the ratio is concentration dependent has, however, not been reported previously.
EtG is commonly used as a test for recent alcohol drinking using urine as specimen. As EtG is known to be formed in urine post sampling, EtS is used as a parameter to confirm alcohol drinking [4], [5], [6], [7]. When instead using blood, this is not needed. In clinical practice, the urine sampling process is sometimes considered complicated, intrusive and unsafe regarding the validity of the specimen collected. Even if blood collection is more intrusive, it represents a possible specimen in cases when an alternative to urine is needed. Venous blood sampling may be replaced with sampling of capillary blood by finger pricking and collection of dried blood spots [37], [38], making the sampling procedure less intrusive and with no need for a professional phlebotomist. One issue that remains to be studied is the relation between whole-blood and serum concentrations of EtG and exposure to unintentional ethanol exposure, e.g. from hand sanitizers.
Conclusions
A sensitive LC-MS/MS method suitable for routine measurement of EtG in serum and whole-blood samples was developed and evaluated. When the method was applied in clinical studies, it was demonstrated that the detection time for recent alcohol exposure was similar or even slightly longer in blood than in urine, due to the lower measuring range used in blood. Therefore, in situations when a urine sample for measuring EtG to indicate recent alcohol exposure is not available, a blood sample might be equally useful.
-
Author contributions: All authors have accepted responsibility for the entire content of this manuscript and approved its submission.
-
Research funding: None declared.
-
Employment or leadership: None declared.
-
Honorarium: None declared.
-
Competing interests: Authors state no conflict of interest.
-
Informed consent: Informed consent was obtained from all individuals included in this study.
-
Ethical approval: Both studies were approved by the Ethics Committee at the University of Mainz (Germany).
References
1. Neukamm MA, Bahrami A, Auwärter V, Mehne FM, Höss E. Evaluation of KIMS immunoassays on a cobas c 501 analyzer for drugs of abuse and ethyl glucuronide testing in urine for forensic abstinence control. Drug Test Anal 2016;9:1217–33.10.1002/dta.2154Search in Google Scholar PubMed
2. Böttcher M, Beck O, Helander A. Evaluation of a new immunoassay for urinary ethyl glucuronide testing. Alcohol Alcohol 2008;43:46–8.10.1093/alcalc/agm153Search in Google Scholar PubMed
3. Helander A, Beck O. Mass spectrometric identification of ethyl sulfate as an ethanol metabolite in humans. Clin Chem 2004;50:936–7.10.1373/clinchem.2004.031252Search in Google Scholar PubMed
4. Weinmann W, Schaefer P, Thierauf A, Schreiber A, Wurst FM. Confirmatory analysis of ethylglucuronide in urine by liquid-chromatography/electrospray ionization/tandem mass spectrometry according to forensic guidelines. J Am Soc Mass Spectrom 2004;15:188–93.10.1016/j.jasms.2003.10.010Search in Google Scholar PubMed
5. Armer JM, Allcock RL. Urine ethyl glucuronide and ethyl sulphate using liquid chromatography-tandem mass spectrometry in a routine clinical laboratory. Ann Clin Biochem 2017;54:60–8.10.1177/0004563216636648Search in Google Scholar PubMed
6. Helander A, Olsson I, Dahl H. Postcollection synthesis of ethyl glucuronide by bacteria in urine may cause false identification of alcohol consumption. Clin Chem 2007;53:1855–7.10.1373/clinchem.2007.089482Search in Google Scholar PubMed
7. Helander A, Hagelberg CA, Beck O, Petrini B. Unreliable alcohol testing in a shipping safety programme. Forensic Sci Int 2009;189:45–7.10.1016/j.forsciint.2009.04.022Search in Google Scholar PubMed
8. Frederick DL. Toxicology testing in alternative specimen matrices. Clin Lab Med 2012;32:467–92.10.1016/j.cll.2012.06.009Search in Google Scholar PubMed
9. Kummer N, Lambert WE, Samyn N, Stove CP. Alternative sampling strategies for the assessment of alcohol intake of living persons. Clin Biochem 2016;49:1078–91.10.1016/j.clinbiochem.2016.05.007Search in Google Scholar PubMed
10. Schmitt G, Droenner P, Skopp G, Aderjan R. Ethyl glucuronide concentration in serum of human volunteers, teetotalers, and suspected drinking drivers. J Forensic Sci 1997;42:1099–102.10.1520/JFS14267JSearch in Google Scholar
11. Høiseth G, Karinen R, Christophersen AS, Olsen L, Normann PT, Mørland J. A study of ethyl glucuronide in post-mortem blood as a marker of ante-mortem ingestion of alcohol. Forensic Sci Int 2007;165:41–5.10.1016/j.forsciint.2006.02.045Search in Google Scholar
12. Høiseth G, Fosen JT, Liane V, Bogstrand ST, Mørland J. Alcohol hangover as a cause of impairment in apprehended drivers. Traffic Inj Prev 2015;16:323–8.10.1080/15389588.2014.938324Search in Google Scholar
13. Krabseth H, Mørland J, Høiseth G. Assistance of ethyl glucuronide and ethyl sulfate in the interpretation of postmortem ethanol findings. Int J Legal Med 2014;128:765–70.10.1007/s00414-014-1031-zSearch in Google Scholar
14. Cabarcos P, Álvarez I, Tabernero MJ, Bermejo AM. Determination of direct alcohol markers: a review. Anal Bioanal Chem 2015;407:4907–25.10.1007/s00216-015-8701-7Search in Google Scholar
15. Schmitt G, Aderjan R, Keller T, Wu M. Ethyl glucuronide: an unusual ethanol metabolite in humans. Synthesis, analytical data, and determination in serum and urine. J Anal Toxicol 1995;19:91–4.10.1093/jat/19.2.91Search in Google Scholar
16. Nishikawa M, Tsuchihashi H, Miki A, Katagi M, Schmitt G, Zimmer H, et al. Determination of ethyl glucuronide, a minor metabolite of ethanol, in human serum by liquid chromatography-electrospray ionization mass spectrometry. J Chromatogr B 1999;726:105–10.10.1016/S0378-4347(99)00008-0Search in Google Scholar
17. Janda I, Alt A. Improvement of ethyl glucuronide determination in human urine and serum samples by solid-phase extraction. J Chromatogr B 2001;758:229–34.10.1016/S0378-4347(01)00186-4Search in Google Scholar
18. Krivánková L, Caslavska J, Malásková H, Gebauer P, ThormannW. Analysis of ethyl glucuronide in human serum by capillary electrophoresis with sample self-stacking and indirect detection. J Chromatogr A 2005;1081:2–8.10.1016/j.chroma.2004.11.099Search in Google Scholar PubMed
19. Morini L, Politi L, Zucchella A, Polettini A. Ethyl glucuronide and ethyl sulphate determination in serum by liquid chromatography-electrospray tandem mass spectrometry. Clin Chim Acta 2007;376:213–9.10.1016/j.cca.2006.08.024Search in Google Scholar PubMed
20. Nováková M, Krivánková L. Determination of ethyl glucuronide in human serum by hyphenation of capillary isotachophoresis and zone electrophoresis. Electrophoresis 2008;29:1694–700.10.1002/elps.200700663Search in Google Scholar PubMed
21. Caslavska J, Jung B, Thormann W. Confirmation analysis of ethyl glucuronide and ethyl sulfate in human serum and urine by CZE-ESI-MS(n) after intake of alcoholic beverages. Electrophoresis 2011;32:1760–4.10.1002/elps.201000651Search in Google Scholar
22. Lostia AM, Vicente JL, Cowan DA. Measurement of ethyl glucuronide, ethyl sulphate and their ratio in the urine and serum of healthy volunteers after two doses of alcohol. Alcohol Alcohol 2013;48:74–82.10.1093/alcalc/ags108Search in Google Scholar PubMed
23. Høiseth G, Bernard JP, Karinen R, Johnsen L, Helander A, Christophersen AS, et al. A pharmacokinetic study of ethyl glucuronide in blood and urine: applications to forensic toxicology. Forensic Sci Int 2007;172:119–24.10.1016/j.forsciint.2007.01.005Search in Google Scholar PubMed
24. Høiseth G, Yttredal B, Karinen R, Gjerde H, Mørland J, Christophersen A. Ethyl glucuronide concentrations in oral fluid, blood, and urine after volunteers drank 0.5 and 1.0 g/kg doses of ethanol. J Anal Toxicol 2010;34:319–24.10.1093/jat/34.6.319Search in Google Scholar PubMed
25. Oppolzer D, Barroso M, Gallardo E. Bioanalytical procedures and developments in the determination of alcohol biomarkers in biological specimens. Bioanalysis 2016;8:229–51.10.4155/bio.15.240Search in Google Scholar PubMed
26. Peters FT, Hartung M, Herbold M, Schmitt X, Daldrup T, Mußhoff F. Anforderungen an die Validierung von Analysenmethoden. Toxichem Krimtech 2009;76:142–76. English translation is available: https://www.gtfch.org/cms/images/stories/files/Appendix%20B%20GTFCh%2020090601.pdf.Search in Google Scholar
27. Matuszewski BK, Constanzer ML, Chavez-Eng CM. Strategies for the assessment of matrix effect in quantitative bioanalytical methods based on HPLC-MS/MS. Anal Chem 2003;75:3019–30.10.1021/ac020361sSearch in Google Scholar PubMed
28. Liu Y, Zhang X, Li J, Huang Z, Lin Z, Wang J, et al. Stability of ethyl glucuronide, ethyl sulfate, phosphatidylethanols and fatty acid ethyl esters in postmortem human blood. J Anal Tox 2018;42:346–52.10.1093/jat/bky010Search in Google Scholar PubMed
29. Kamil IA, Smith JN, Williams RT. A new aspect of ethanol metabolism: isolation of ethyl-glucuronide. Biochem J 1952;51:32–3.Search in Google Scholar
30. Seidl S, Wurst FM, Alt A. Ethyl glucuronide – a biological marker for recent alcohol consumption. Addict Biol 2001;6:205–12.10.1080/13556210120056535Search in Google Scholar PubMed
31. Palmer RB. A review of the use of ethyl glucuronide as a marker for ethanol consumption in forensic and clinical medicine. Semin Diagn Pathol 2009;26:18–27.10.1053/j.semdp.2008.12.005Search in Google Scholar PubMed
32. Maenhout TM, De Buyzere ML, Delanghe JR. Non-oxidative ethanol metabolites as a measure of alcohol intake. Clin Chim Acta 2013;415:322–9.10.1016/j.cca.2012.11.014Search in Google Scholar PubMed
33. Jatlow PI, Agro A, Wu R, Nadim H, Toll BA, Ralevski E, et al. Ethyl glucuronide and ethyl sulfate assays in clinical trials, interpretation, and limitations: results of a dose ranging alcohol challenge study and 2 clinical trials. Alcohol Clin Exp Res 2014;38:2056–65.10.1111/acer.12407Search in Google Scholar PubMed PubMed Central
34. Droenner P, Schmitt G, Aderjan R, Zimmer H. A kinetic model describing the pharmacokinetics of ethyl glucuronide in humans. Forensic Sci Int 2002;126:24–9.10.1016/S0379-0738(02)00025-7Search in Google Scholar
35. Halter CC, Dresen S, Auwaerter V, Wurst FM, Weinmann W. Kinetics in serum and urinary excretion of ethyl sulfate and ethyl glucuronide after medium dose ethanol intake. Int J Legal Med 2008;122:123–8.10.1007/s00414-007-0180-8Search in Google Scholar PubMed
36. Høiseth G, Morini L, Polettini A, Christophersen AS, Johnsen L, Karinen R, et al. Serum/whole blood concentration ratio for ethylglucuronide and ethyl sulfate. J Anal Toxicol 2009;33:208–11.10.1093/jat/33.4.208Search in Google Scholar PubMed
37. Hernández Redondo A, Schroeck A, Kneubuehl B, Weinmann W. Determination of ethyl glucuronide and ethyl sulfate from dried blood spots. Int J Legal Med 2013;127:769–75.10.1007/s00414-012-0815-2Search in Google Scholar PubMed
38. Lenk G, Sandkvist S, Pohanka A, Stemme G, Beck O, Roxhed N. A disposable sampling device to collect volume-measured DBS directly from a fingerprick onto DBS paper. Bioanalysis 2015;7:2085–94.10.4155/bio.15.134Search in Google Scholar PubMed
©2020 Michael Böttcher et al., published by De Gruyter, Berlin/Boston
This work is licensed under the Creative Commons Attribution 4.0 International License.
Articles in the same Issue
- Frontmatter
- Hematology
- Diagnostic work up of anemic patients: role of iron deficiency
- Oncological Diagnostics/Liquid Profiling
- Evaluation of alpha-l-fucosidase for the diagnosis of hepatocellular carcinoma based on meta-analysis
- Pediatric Laboratory Medicine
- Reference values of plasma homocysteine in Cuban children and adults
- Infectiology and Microbiology
- Prevalence of metallo-β-lactamase genes among Pseudomonas aeruginosa isolated from various clinical samples in China
- Original Articles
- Changes of serum neopterin and its significance as biomarker in prediction the prognosis of patients with acute pancreatitis
- Sensitive determination of ethyl glucuronide in serum and whole blood: detection time after alcohol exposure compared with urine
- Investigation of the rapid immunochromatographic test performance in the diagnosis of syphilis; comparison of four serological methods