Microvesicles derived from bone marrow and peripheral blood can reflect tumor load in multiple myeloma
-
Nanhao Meng


To the editor
Multiple myeloma (MM) is a malignant tumor of plasma cells that cannot be completely cured. Although the development of revolutionary immunotherapies has dramatically improved outcomes of MM patients,[1] the residual tumor load often leads to relapse in patients who have achieved complete response (CR).[2] Currently, the multicolor flow cytometry and next-generation sequencing are mainly used to monitor MM tumor load in clinical practice, in particular, the EuroFlow consortium has developed a highly sensitive and fully standardized approach using the next-generation flow (NGF).[3] However, due to the focal distribution of myeloma cells in the bone marrow cavity, these existing methods may show false-negative test results.[3] To address this possible false negative situation, we tried to use circulating microvesicles to reflect MM tumor load. In previous studies, we have found that the microvesicles derived from MM cells in the bone marrow can reflect MM tumor load.[4] Furthermore, this was the first study to explore paired bone marrow and peripheral blood samples and the first one to investigate the value of GPRC5D and BCMA double-positive microvesicles in monitoring MM tumor load.
This study included 311 MM patients (Supplementary Table S1) with tumor load assessed by NGF, and whose clinical efficacies were evaluated as CR. Patients were grouped into a high tumor load (H-TL) and a low tumor load (L-TL) group based on NGF test results at a threshold of 10-4 or 10-5.[5,6] Bone marrow and remaining peripheral blood samples were collected after clinical examination. The microvesicles were obtained through ultracentrifugation and labeled myeloma cell-derived microvesicles with the characteristic myeloma markers GPRC5D, BCMA, CD138, and CD319. The number of microvesicles was detected by flow-cytometry, as described in detail in our previous study[4] (Supplementary Material S1, Supplementary Material S2). The differences in the numbers of microvesicles were compared between the L-TL and H-TL groups and the ROC curve analysis was performed on microvesicles to distinguish H-TL patients from L-TL patients.
For bone marrow samples: when 10-4 was used as the threshold, the numbers of CD41a-Phosphatidylserine+(Ps+), Ps+CD41a−CD138+, Ps+CD41a−BCMA+, Ps+CD41a−CD319+, and Ps+CD41a− GPRC5D+microvesicles were all higher in the H-TL group (n = 174) than the L-TL group (n = 137) (P < 0.001) (Figure 1A-A1 and Supplementary Table S2). Then, ROC curves were performed on bone marrow microvesicles labeled with Ps+CD41a−CD138+, Ps+CD41a−BCMA+, Ps+CD41a−CD319+, Ps+CD41a−GPRC5D+ to distinguish H-TL patients from L-TL patients. The AUC of these microvesicles were 0.8222, 0.9054, 0.7812, 0.9159 (P < 0.001), with sensitivities of 78.74%, 83.24%, 93.10%, 89.66%, and specificities of 75.18%, 86.13%, 56.93%, 78.83%, respectively (Figure 1A-A1 and Table 1). It suggested that BCMA and GPRC5D-positive microvesicles can reflect MM tumor load well in bone marrow (AUC > 0.9).
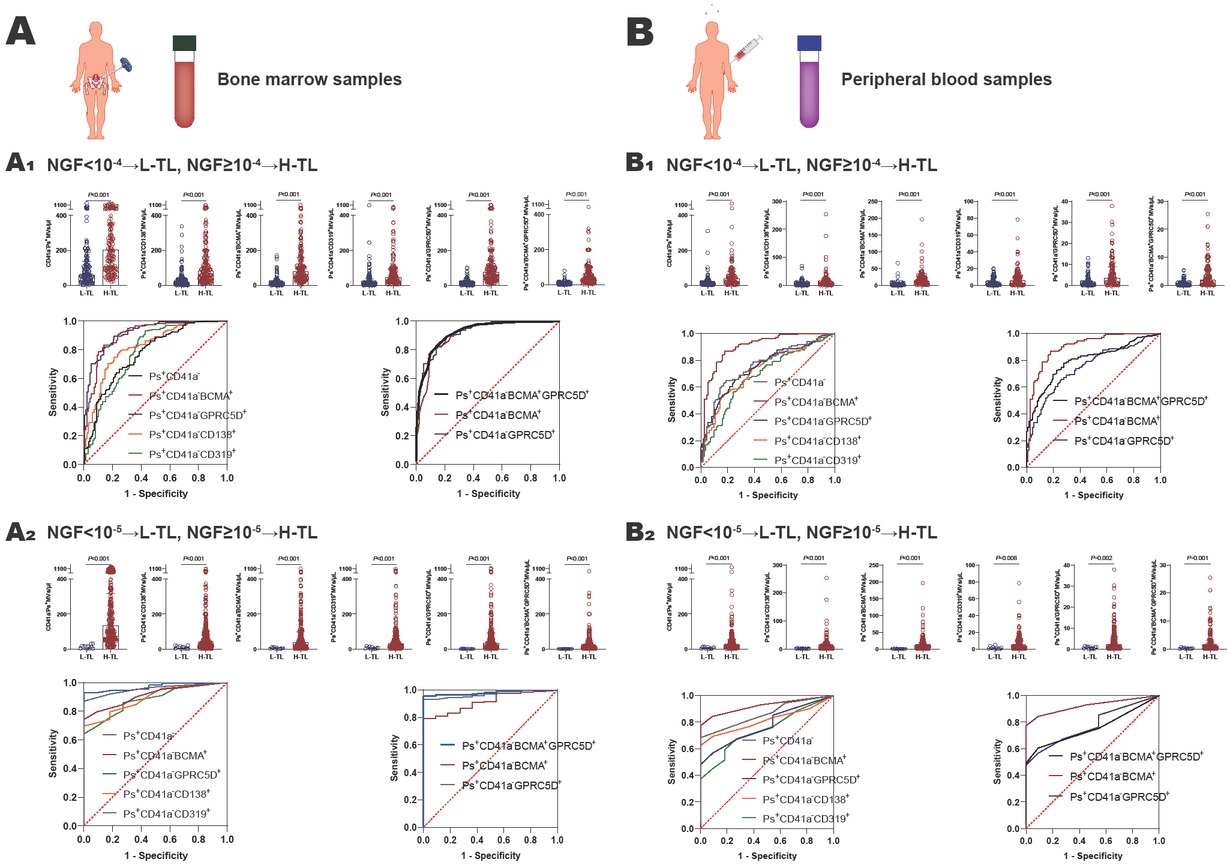
The value of microvesicles in bone marrow and peripheral blood in monitoring MM tumor load. A Bone marrow samples: A1 NGF = 10-4 as the threshold, the number of MM cell-derived microvesicles from bone marrow was significantly higher in H-TL group compared with in L-TL group, and the ROC curves were analyzed Ps+CD41a−, Ps+CD41a−CD138+, Ps+CD41a−BCMA+, Ps+CD41a−CD319+, Ps+CD41a−GPRC5D+, and Ps+CD41a−BCMA+GPRC5D+microvesicles from bone marrow to distinguish the H-TL patients from L-TL patients; A2 NGF = 10-5 as the threshold, the number of MM cell-derived microvesicles from bone marrow was significantly higher in H-TL group compared with in L-TL group, and the ROC curves were analyzed Ps+CD41a−, Ps+CD41a−CD138+, Ps+CD41a−BCMA+, Ps+CD41a−CD319+, Ps+CD41a−GPRC5D+, and Ps+CD41a−BCMA+GPRC5D+microvesicles from bone marrow to distinguish the H-TL patients from L-TL patients. B Peripheral blood samples: B1 NGF=10-4 as the threshold, the number of MM cell-derived microvesicles from peripheral blood was significantly higher in H-TL group compared with in L-TL group, and the ROC curves were analyzed Ps+CD41a−, Ps+CD41a−CD138+, Ps+CD41a−BCMA+, Ps+CD41a−CD319+, Ps+CD41a− GPRC5D+, and Ps+CD41a−BCMA+GPRC5D+microvesicles from peripheral blood to distinguish the H-TL patients from L-TL patients; B2 NGF=10-5 as the threshold, the number of MM cell-derived microvesicles from peripheral blood was significantly higher in H-TL group compared with in L-TL group, and the ROC curves were analyzed Ps+CD41a−, Ps+CD41a−CD138+, Ps+CD41a−BCMA+, Ps+CD41a−CD319+, Ps+CD41a−GPRC5D+, and Ps+CD41a−BCMA+GPRC5D+microvesicles from peripheral blood to distinguish the H-TL patients from L-TL patients. NGF: next-generation flow; L-TL: low tumor load; H-TL: high tumor load; MVs: microvesicles; Ps: phosphatidylserine; AUC: area under the curve.
The AUC values of ROC curves
| Optimal |
||||||
|---|---|---|---|---|---|---|
| Group | AUC (95%CI) | P value | Cut off points, μL | Sensitivity, % (95%CI) | Specificity, % (95%CI) | |
| < 10-4 vs. ≥ 10-4 (Bone marrow) | CD41a-Ps+ | 0.7733 (0.7210-0.8255) | < 0.001 | 134.3 | 66.67 (59.37–73.24) | 75.18 (67.33–81.66) |
| Ps+CD41a-CD138+ | 0.8222 (0.7757-0.8688) | < 0.001 | 35.55 | 78.74 (72.07–84.16) | 75.18 (67.33–81.66) | |
| Ps+CD41a-BCMA+ | 0.9054 (0.8712-0.9396) | < 0.001 | 30.09 | 83.24 (76.96–88.07) | 86.13 (79.35–90.94) | |
| Ps+CD41a-CD319+ | 0.7812 (0.7277-0.8346) | < 0.001 | 13.90 | 93.10 (88.33–96.01) | 56.93 (48.57–64.93) | |
| Ps+CD41a-GPRC5D+ | 0.9159 (0.8852-0.9467) | < 0.001 | 21.18 | 89.66 (84.24–93.36) | 78.83 (71.25–84.84) | |
| Ps+CD41a-BCMA+GPRC5D+ | 0.9248 (0.8960-0.9536) | < 0.001 | 17.16 | 80.46 (73.79–85.67) | 90.51 (84.44–94.37) | |
| < 10-5 vs. ≥ 10-5 (Bone marrow) | CD41a-Ps+ | 0.9691 (0.9448-0.9933) | < 0.001 | 30.83 | 89.67 (85.71–92.62) | 63.64 (35.38–84.83) |
| Ps+CD41a-CD138+ | 0.8855 (0.8249-0.9460) | < 0.001 | 20.85 | 73.33 (68.06–78.02) | 81.82 (52.30–96.77) | |
| Ps+CD41a-BCMA+ | 0.9133 (0.8643-0.9624) | < 0.001 | 10.50 | 79.00 (74.04–82.23) | 90.90 (60.20–98.30) | |
| Ps+CD41a-CD319+ | 0.8818 (0.8179-0.9457) | < 0.001 | 16.81 | 68.00 (62.52–73.02) | 72.73 (43.44–90.25) | |
| Ps+CD41a-GPRC5D+ | 0.9715 (0.9507-0.9923) | < 0.001 | 1.840 | 93.00 (89.54–95.38) | 90.91 (62.26–99.53) | |
| Ps+CD41a-BCMA+GPRC5D+ | 0.9800 (0.9646-0.9954) | < 0.001 | 1.005 | 95.67 (92.73–97.45) | 90.91 (62.26–99.53) | |
| < 10-4 vs. ≥ 10-4 (Peripheral blood) | CD41a-Ps+ | 0.7564 (0.6954-0.8175) | < 0.001 | 25.78 | 64.89 (56.39–72.53) | 81.08 (72.80–87.28) |
| Ps+CD41a-CD138+ | 0.7242 (0.6605-0.7880) | <0.001 | 10.23 | 52.67 (44.17–61.02) | 84.68 (76.84–90.21) | |
| Ps+CD41a-BCMA+ | 0.9015 (0.8620-0.9409) | < 0.001 | 4.570 | 87.20 (80.20–91.74) | 81.98 (73.80–88.02) | |
| Ps+CD41a-CD319+ | 0.6855 (0.6185-0.7525) | < 0.001 | 3.640 | 64.12 (55.61–71.83) | 69.37 (60.27–77.18) | |
| Ps+CD41a-GPRC5D+ | 0.7470 (0.6857-0.8082) | < 0.001 | 2.150 | 64.89 (56.39–72.53) | 74.77 (65.96–81.93) | |
| Ps+CD41a-BCMA+GPRC5D+ | 0.7961 (0.7400-0.8521) | < 0.001 | 0.985 | 72.52 (64.32–79.77) | 77.48 (68.86–84.25) | |
| < 10-5 vs. ≥ 10-5 (Peripheral blood) | CD41a-Ps+ | 0.8617 (0.7889-0.9344) | < 0.001 | 12.66 | 70.13 (63.94–75.66) | 72.73 (43.44–90.25) |
| Ps+CD41a-CD138+ | 0.8245 (0.7583-0.8907) | < 0.001 | 3.430 | 65.37 (59.03–71.21) | 81.82 (62.26–99.53) | |
| Ps+CD41a-BCMA+ | 0.9282 (0.8876-0.9687) | < 0.001 | 3.415 | 65.37 (59.03–71.21) | 84.85 (74.12–99.00) | |
| Ps+CD41a-CD319+ | 0.7320 (0.6295-0.8345) | 0.009 | 5.005 | 43.72 (37.48–50.17) | 63.64 (43.44–84.83) | |
| Ps+CD41a-GPRC5D+ | 0.7719 (0.6772-0.8667) | 0.002 | 1.560 | 55.41 (48.96–61.68) | 81.82 (52.30–96.77) | |
| Ps+CD41a-BCMA+GPRC5D+ | 0.7757 (0.6901-0.8613) | 0.002 | 0.725 | 58.87 (52.43–65.02) | 99.91 (74.12–99.53) | |
AUC: area under the curve; Ps: phosphatidylserine.
In our previous study, we found the double-positive microvesicles (such as Ps+CD41a− CD138+BCMA+microvesicles) were less valuable in monitoring MM tumor load than single-positive microvesicles (such as Ps+CD41a−CD138+ and Ps+CD41a− BCMA+). This is mainly because the number of double-positive microvesicles extremely reduced.[4] However, the expression of GPRC5D and BCMA in myeloma are mutually exclusive.[5,7] Thus, we explored whether Ps+CD41a− BCMA+GPRC5D+microvesicles could be a better marker. The AUC of Ps+CD41a−BCMA+GPRC5D+microvesicles was 0.9248, with sensitivity of 80.46% and specificity of 90.51% (Figure 1A-A1, Table 1). It suggested that the number of Ps+CD41a−BCMA+GPRC5D+microvesicles in bone marrow is a better marker of MM tumor load (AUC value maximum). Mechanistically, we inferred that during vesicle formation, BCMA-positive microvesicles and GPRC5D-positive microvesicles may be more likely to fuse with each other, although the expression of BCMA and GPRC5D in myeloma cells are mutually exclusive. Therefore, the mutually exclusive expression on cells may lead to dual-positive microvesicles representing a broader tumor subpopulation. Of course, this hypothesis requires further research to confirm in the future.
When 10-5 was used as the threshold, the numbers of Ps+CD41a-, Ps+CD41a−CD138+, Ps+CD41a−BCMA+, Ps+CD41a−CD319+, Ps+CD41a−GPRC5D+ and Ps+CD41a− BCMA+GPRC5D+microvesicles were all higher in H-TL group (n = 300) than L-TL group (n = 11)(P < 0.001) (Figure 1A-A2, Supplementary Table S2). And the AUC of these microvesicles were 0.8855, 0.9133, 0.8818, 0.9715, 0.9800 (P < 0.001), with sensitivities of 73.33%, 79.00%, 68.00%, 93.00%, 95.67%, and specificities of 81.82%, 90.90%, 72.73%, 90.91%, 90.91%, respectively (Figure 1A-A2, Table 1).
For peripheral blood samples: when NGF = 10-4 was used as the threshold, the numbers of CD41a−Ps+, Ps+CD41a−CD138+, Ps+CD41a−BCMA+, Ps+CD41a− CD319+, Ps+CD41a−GPRC5D+ and Ps+CD41a− BCMA+GPRC5D+microvesicles were all higher in H-TL group (n = 111) than L-TL group (n = 131) (P < 0.001) (Figure 1B-B1, Supplementary Table S2). The AUC of these microvesicles were 0.7242, 0.9015, 0.6855, 0.7470, 0.7961 (P < 0.001), with sensitivities of 52.67%, 87.20%, 64.12%, 64.89%, 75.52%, and specificities of 84.68%, 81.98%, 69.37%, 74.77%, 77.48%, respectively (Figure 1B-B1, Table 1). When NGF = 10-5 was used as the threshold. The numbers of these microvesicles were also significantly higher in H-TL group (n = 111) than in L-TL group (n = 131) (P < 0.01) (Figure 1B-B1, Supplementary Table S2). And the AUC of these microvesicles were 0.8245, 0.9282, 0.7320, 0.7719, 0.7757 (P < 0.01), with sensitivities of 65.37%, 65.37%, 43.72%, 55.41%, 58.87%, and specificities of 81.82%, 84.85%, 63.64%, 81.82%, 99.91%, respectively (Figure 1B-B2, Table 1). We noticed that the lower AUC score for peripheral blood MVs compared to that for bone marrow, which suggested that peripheral blood may be less reliable. We believed it may be related to the dilution effect of peripheral blood relative to bone marrow, the half-life of microvesicles, and the depletion of microvesicles in peripheral blood samples during storage.
In conclusion, the number of microvesicles in both bone marrow samples and peripheral blood samples can reflect MM tumor load and serve as a useful complement to existing tumor load monitoring methods to compensate for false negatives. Specifically, when using bone marrow samples, the selection of Ps+CD41a−BCMA+, Ps+CD41a−GPRC5D+, and Ps+CD41a−BCMA+GPRC5D+ microvesicles were all effective in reflecting tumor load, with AUC above 0.9, and Ps+CD41a−BCMA+GPRC5D+microvesicles were the most effective, with AUC maximum; when using peripheral blood samples, the selection of Ps+CD41a−BCMA+microvesicles can reflect the tumor load better, with AUC above 0.9. It appears that BCMA can be used as an effective member in bone marrow and peripheral blood samples, but GPRC5D combined BCMA can be more effective than BCMA alone in bone marrow. The underlying mechanisms still need further study. However, the current results are only based on the single center data. It is crucial to establish a standard system. We hope to conduct further research using data from multiple centers, and to follow up over a longer period. Furthermore, clear standards need to be established for sample collection, storage, preparation, and flow cytometry monitoring strategies, all these standards should be validated across multiple laboratories. These will facilitate the clinical application of this technology. To create a standard system for microvesicle detection can more usefully promote the monitoring of MM tumor load in the future.
Funding statement: This work was supported by Tianjin Health Research Project (Grant No. TJWJ2023XK003), State Key Laboratory of Experimental Hematology (Grant No. 24ZXZSSS00030), Tianjin Science and Technology Planning Project (Grant No. 24ZXGQSY00020).
Supplementary Information
Supplementary materials are only available at the official site of the journal (www.intern-med.com).
Acknowledgements
None.
-
Author Contributions:
Conceptualization: LZY and RF; Data curation: NHM; Formal analysis: NHM and YS; Funding acquisition: ZYL and RF; Investigation: NHM, YS, and YC, Methodology: NHM; Project administration: RF; Resources: RF; Supervision: ZYL and RF; Validation: HL and KD; Visualization: WH,JFJ and PFP; Writing-original draft: NHM; Writing-review & editing: NHM, ZYL, and RF. All authors reviewed the manuscript.
-
Ethical Approval:
The study was performed according to the Declaration of Helsinki and approved by the Ethics Committee of Tianjin Medical University General Hospital (Approval No. IRB2023-KY-251).
-
Informed Consent:
Written informed consent was obtained from individual or guardian participants.
-
Conflict of Interest:
The authors declare that they have no competing interests.
-
Use of Large Language Models, AI and Machine Learning Tools:
None declared.
-
Data Availability Statement:
The datasets used and analyzed during the current study are available from the corresponding author on reasonable request.
References
1 Malard F, Neri P, Bahlis NJ, Terpos E, Moukalled N, Hungria VTM, et al. Nat Rev Dis Primers 2024;10:45.10.1038/s41572-024-00529-7Search in Google Scholar PubMed
2 Barlogie B, Crowley J. Could CR mean cure? Blood 2011;118:483.10.1182/blood-2011-05-350322Search in Google Scholar PubMed
3 Medina A, Puig N, Flores-Montero J, Jimenez C, Sarasquete ME, Garcia-Alvarez M, et al. Comparison of next-generation sequencing (NGS) and next-generation flow (NGF) for minimal residual disease (MRD) assessment in multiple myeloma. Blood Cancer J 2020;10:108.10.1038/s41408-020-00377-0Search in Google Scholar PubMed PubMed Central
4 Liu ZY, Meng NH, Cao PP, Peng FP, Luo JY, Wang H, et al. Detection of myeloma cell-derived microvesicles: a tool to monitor multiple myeloma load. Exp Hematol Oncol 2023;12:26.10.1186/s40164-023-00392-4Search in Google Scholar PubMed PubMed Central
5 Takamatsu H. Clinical value of measurable residual disease testing for multiple myeloma and implementation in Japan. Int J Hematol 2020;111:519-529.10.1007/s12185-020-02828-7Search in Google Scholar PubMed
6 Hedley BD, Keeney M. Technical issues: flow cytometry and rare event analysis. Int J Lab Hematol 2013;35:344-350.10.1111/ijlh.12068Search in Google Scholar PubMed
7 Lee H, Ahn S, Maity R, Leblay N, Ziccheddu B, Truger M, et al. Mechanisms of antigen escape from BCMA- or GPRC5D-targeted immunotherapies in multiple myeloma. Nat Med 2023;29:2295-2306.10.1038/s41591-023-02491-5Search in Google Scholar PubMed PubMed Central
© 2026 Nanhao Meng, Zhaoyun Liu, Yan Shi, Chun Yang, Hao Wang, Yanran Luo, Hui Liu, Kai Ding, Fengjuan Jiang, Fengping Peng, Rong Fu, published by De Gruyter on behalf of Scholar Media Publishing
This work is licensed under the Creative Commons Attribution 4.0 International License.
Articles in the same Issue
- Perspective
- Reframing sepsis research through translational integrative models
- Feel the force: Biomechanical homeostasis of the cardiovascular system
- Commentary
- "Zombie virus" like pyroptosis: Extracellular vesicles spread pyroptosis by transferring functional N-GSDMD pore
- Review Article
- The double-positive cells in the tumor microenvironment
- Migrasome as a novel organelle: Biogenesis, physiological functions, and therapeutic potential
- Original Article
- Association between free fatty acids and adverse outcomes in patients with and without diabetes undergoing percutaneous coronary intervention
- Focal adhesion kinase inhibition enhances response to checkpoint immunotherapy in hepatocellular carcinoma
- Effects of T2-high asthma heterogeneity and inhaled corticosteroid on airway and metabolic profiles: A multi-omic approach
- Methyltransferase like 3 promotes thyroid folliculogenesis via coordinating cell differentiation and polarization
- PFKP binding AMOTL1 promotes tumor aerobic glycolysis and epithelial-mesenchymal transition by modulating Hippo pathway in head and neck cancer
- Add-on PD-1 inhibitor with Peg-IFNα therapy favors functional cure of chronic hepatitis B patients
- Therapeutic potential of TMSC-Exo for non-alcoholic fatty liver disease using the liver-on-a-chip model
- Letter to Editor
- Expression and clinical significance of growth differentiation factor-15 in vascular cognitive impairment based on bioinformatic analysis
- Application of machine learning in risk stratification of obesity-related osteoarthritis: A study based on a nationally representative sample
- Associations of the triglyceride-glucose index, triglyceride glucose-body mass index, waist-triglyceride index and modified triglyceride-glucose indices with mortality in cardiovascular-kidney-metabolic syndrome stages 0–4: Evidence from NHANES 1999–2020
- Microvesicles derived from bone marrow and peripheral blood can reflect tumor load in multiple myeloma