The impact of imbalanced groups in UEFA Euro 1980–2024 and comparison with the FIFA World Cup
-
Michael A. Lapré

 and
Julia G. Amato
and
Julia G. Amato

Abstract
Prior research found significant competitive imbalance in FIFA World Cup tournaments because FIFA does not allocate World Cup slots to continental confederations in proportion to the distribution of the best teams in the world. Since the UEFA Euro only consists of teams from Europe, it should be much easier for UEFA to create competitive balance. We empirically investigate competitive imbalance between groups at the UEFA Euro tournaments from 1980 through 2024. We find that competitive imbalance at the Euro is just as bad as it is in the World Cup. We also find that the impact of competitive imbalance on the probability of reaching the quarterfinals is the same across the World Cup and the Euro. UEFA creates competitive imbalance by sometimes protecting multiple low-ranked hosts and, most importantly, using inadequate methods to rank teams. We recommend that UEFA adopt an Elo rating system to rank teams.
1 Introduction
The two biggest soccer tournaments in the world are the FIFA World Cup and the UEFA European Championship. Féderation Internationale de Football Association (FIFA) organizes the World Cup every four years. Union of European Football Associations (UEFA) organizes its European Championship, or Euro for short, every four years between successive World Cups. Both the World Cup and the Euro consist of a qualification phase and a tournament phase. In the qualification phase – held in the two years preceding the tournament phase – teams compete in groups to qualify for the tournament phase. Currently, the tournament phase consists of a group stage and a knockout stage. Table 1 shows the evolution of the Euro tournament since its inception in 1960. For example, in the Euro 2024, 24 qualified teams were allocated to 6 groups of 4 teams each. Round-robin play in the groups identified the 16 teams advancing to the knockout stage.
Format of the UEFA European Championship tournament, or the “Euro.”
| Years | Number of teams | Group stage | Number of teams in knockout stage |
|---|---|---|---|
| 1960–1976 | 4 | n/a | 4 |
| 1980 | 8 | 2 groups of 4 | 2 |
| 1984–1992 | 8 | 2 groups of 4 | 4 |
| 1996–2012 | 16 | 4 groups of 4 | 8 |
| 2016–2024 | 24 | 6 groups of 4 | 16 |
-
n/a, not applicable.
For soccer tournaments, it is crucial to create competitive excitement (Haan et al. 2007). Uncertainty about the result of a soccer game generates competitive excitement, which in turn attracts fans (Koning 2000; Scarf and Yusof 2011). Uncertainty about the outcome of a game is higher when teams are of similar strength (Koning 2000). In the group stage of the World Cup and the Euro, groups should be balanced, meaning groups should have similar levels of competition (Guyon 2015; Guyon 2018b). If groups are imbalanced, it is easier for a team in a weak group to advance to the knockout stage compared to teams playing in a tough group, which is considered unfair (Laliena and López 2019). Thus, tournament organizers should create competitive balance across groups to enhance fairness (Guyon 2015).
Lapré and Palazzolo (2023) empirically investigate competitive imbalance in FIFA World Cup tournaments from 1954 through 2022. The authors find (i) significant imbalance between groups, and (ii) that playing against opponents of different strength in the group significantly changes the probability of reaching the quarterfinals. While FIFA has made some progress in terms of addressing factors that cause imbalance, two important factors remain unaddressed. First, FIFA protects lowly ranked host nations. Second, FIFA does not allocate World Cup slots to continental confederations in proportion to the distribution of best teams in the world. Csató (2023c) shows with simulations that qualification for the World Cup is unfair – it is easier to qualify from some confederations than from others. The main reason is the obscure allocation of qualifying slots to the continental confederations. Krumer and Moreno-Ternero (2023) and Csató et al. (2025) propose objective allocation rules for the FIFA World Cup slots. Because UEFA does not have to allocate Euro slots to different continents – all teams are from Europe – in theory it should be much easier for UEFA to create competitive balance. Therefore, in this paper, we empirically investigate competitive imbalance in Euro tournaments going back to 1980 when UEFA introduced the group stage.
Table 2 shows the evolution of the draw procedure UEFA has used to create groups for the Euro. Since 2000, UEFA has placed teams in four pots. Groups are created by drawing one team from each pot. Pot 1 consists of seeded teams: the host(s), through 2016 the winner of the previous Euro (titleholders), and the highest ranked teams. Seeds are protected since they cannot play each other in the group stage. Table 2 details how UEFA has used different ranking schemes to allocate teams to pots 2 through 4.
Evolution of the draw procedure to create groups for Euro tournaments with at least 4 groups.
| Years | Seeds in Pot 1 | Pots 2, 3, and 4 |
|---|---|---|
| 1996 | Host, titleholder, highest ranked teams | All unseeded teams in pot 2 (no pots 3 and 4) |
| 2000–2008 | Host(s), titleholder, highest ranked team(s) | Pots 2–4 based on average points per game for games in: previous World Cup qualifying group and current Euro qualifying group |
| 2012–2016 | Host(s), titleholder, highest ranked team(s) | Pots 2–4 based on average points per game for games in: current Euro qualifying group (40 %), previous World Cup qualifying group and tournament (40 %), and previous Euro qualifying group and tournament (20 %) |
| 2020 | Highest ranked qualifying-group winners (none of the 9 hosts were seeded) | Group winners and runners-up were separately ranked based on points and goal difference in Euro qualifying groups (ignoring games played against 6th placed teams). Pots 2–4 seeded in the following order: (i) remaining qualifying-group winners, (ii) qualifying-group runners-up, and (iii) play-off winners. |
| 2024 | Host, highest ranked qualifying-group winners | See 2020 |
-
In 2000, 2008, and 2012 two countries co-hosted the Euro and both co-hosts were seeded. “Titleholder” refers to the champion of the previous Euro. Points per game: 3 for a win, 1 for a draw, 0 for a loss.
We apply the same method Lapré and Palazzolo (2023) used for the World Cup. We find that (i) competitive imbalance is the same across the World Cup and the Euro, and (ii) the impact of imbalance on the probability of reaching the quarterfinals is also the same across the World Cup and the Euro. Even though UEFA does not have to allocate Euro slots to different continents, UEFA creates competitive imbalance by sometimes protecting multiple low-ranked hosts and, most significantly, using inadequate systems to rank qualified teams.
The remainder of the paper is organized as follows. In Section 2, we review related research. In Section 3, we assess imbalance across groups. First, we calculate group strength as the average Elo rating of the teams at the time of the draw. Second, for each team, we calculate group opponents rating by averaging the Elo ratings of the opponents in the group. Third, we compare the imbalance in the Euro with the imbalance in the World Cup. In Section 4, we use logistic regression to estimate the impact of group opponents rating on the probability of reaching the quarterfinals and the semifinals. We also compare the impact of group opponents rating across the Euro and the World Cup. In Section 5, we verify that the Elo rating is a more accurate predictor of success at the Euro than the ranking used by UEFA. We also discuss progress by FIFA and UEFA in terms of reducing competitive imbalance and conclude with policy recommendations.
2 Related research
As the World Cup is the most prestigious soccer tournament, scholars have not studied the Euro to the same extent as the World Cup. However, some scholars have used the Euro tournament as a context to (i) predict all matches in a tournament (Groll and Abedieh 2013), (ii) obtain winning probabilities for all participating teams (Groll et al. 2018), and (iii) identify success factors for national teams (Renner et al. 2025). Several issues related to tournament design can induce competitive imbalance at the Euro. A rich body of literature has studied various aspects of tournament design. Csató (2021) and Devriesere et al. (2025) provide excellent reviews of the literature on tournament design. Few studies have empirically investigated imbalance between groups. Lapré and Palazzolo (2022) empirically find substantial imbalance between groups in the FIFA Women’s World Cup tournaments from 1991 through 2019 and the imbalance significantly affects the probability of reaching the quarterfinals. Lapré and Palazzolo (2023) document similar empirical findings in the FIFA Men’s World Cup tournaments from 1954 through 2022.
To identify the highest ranked teams as seeds and to create pots based on team strength, organizers need to use an appropriate ranking mechanism. Lasek et al. (2013) study the predictive power of several ranking methods. The authors find that Elo rating systems based on an update formula are the most accurate methods outperforming among others the former FIFA Men’s World Ranking procedure. For reviews of rating methods, see Koning (2017), Van Eetvelde and Ley (2019), and Groll et al. (2020). Tenni et al. (2025) evaluate the ranking algorithm used by Fédération Internationale de Volleyball (FIVB) and identify performance improvements for the FIVB ranking algorithm. Csató (2024) investigates the method used by UEFA to rate clubs in the Champions League and identifies an Elo method that outperforms UEFA’s method in terms of predictive accuracy.
In ranking the participating Euro teams, UEFA has placed significant importance on matches in the qualifying groups prior to the Euro (Table 2). However, the host team(s) are automatically qualified. So, any performance indication of the host team(s) is ignored. Prior to 2018, FIFA has also struggled to accurately rate the host teams (Cea et al. 2020; Kaminski 2022).
The 2016–2024 Euros featured a group stage with 24 teams, followed by a knockout stage starting with 16 teams – 6 group winners, 6 runners-up, and 4 third-placed teams. Guyon (2018b) and Csató (2021) identify several fairness issues in these 24-team tournament designs: group advantage, lack of win incentive, and arbitrary choices. UEFA has used the work of Guyon (2018b) to modify the knockout stage of the 2016 Euro for the 2020 and 2024 Euros to minimize group advantage. Tournaments with a group stage followed by a knockout stage, such as the Euro, can induce tanking: a team that is already qualified for the knockout stage could be tempted to deliberately lose a match to obtain a more favorable matchup in the knockout stage (Stronka 2020). Chater et al. (2021) propose optimal schedules to reduce match fixing in the last round of the group stage. Csató (2025a) develops a model to quantify the risk of tanking in multi-stage tournaments. The author finds that more radical interventions are required to prevent tanking, notably dynamic scheduling (e.g., Guajardo and Krumer 2024), opponent choice (e.g., Hall and Liu 2024), or randomized tie-breaking (Stronka 2024).
Berker (2014) and Csató (2025b) analyze the effects of the tie-breaking rules for the 2012 and 2024 Euros, respectively. Berker (2014) finds that UEFA’s use of head-to-head results as a tie breaker in the group stage can make a huge difference. To mitigate collusion, Csató (2025b) recommends using goal difference as the primary tie-breaking rule rather than head-to-head results.
Papers investigating draw procedures have largely focused on the World Cup, because FIFA imposes geographic (continental) constraints on the draw. FIFA constrains each group to have at least one and at most two UEFA teams, while all other teams in the group should be from different continental confederations. In the past, FIFA based pots on continents rather than team strength, resulting in groups of unequal strength, lack of fairness, and increased chances that certain teams ended up in stronger groups (Guyon 2015). Guyon (2015), Laliena and López (2019), and Cea et al. (2020) all propose better draw procedures to create competitive balance while taking geographic constraints into account. Inspired by Guyon (2015), since 2018, FIFA has moved from continent-based pots to ranking-based pots (Guyon 2018a). UEFA, however, does not have to deal with geographic constraints since all teams are from Europe. Motivated by FIFA’s initial plan to have groups of three teams for the 2026 World Cup, Laliena and López (2025) propose draw procedures for sports tournaments that will achieve balanced groups of three teams.
A draw is uniform if all valid draws are equally likely. Roberts and Rosenthal (2024) show that the FIFA World Cup draw procedure does not have a uniform distribution. Csató (2025c) studies the impact of the biased FIFA World Cup draw on the probability of advancing to the knockout stage. The author also evaluates the fairness of the draw and finds that – compared to all possible draw orders – the draw order used in the 2018 FIFA World Cup was optimal. Csató (2025d) provides a theoretical explanation of this optimality. For the 2022 World Cup, FIFA performed the draw when three play-off winners were still unknown. FIFA placed the play-off winners in Pot 4. UEFA followed the same procedure for the 2024 Euro. However, placing the play-off spots in pots according to the highest-ranked potential winner improves competitive balance across groups (Csató 2023a).
3 Imbalance in groups
To assess competitive imbalance, first we calculate group strength for all groups at the Euro (Section 3.1) as well as group opponents rating for all teams at the Euro (Section 3.2). Second, we compare the variation in group strength and group opponents rating at the Euro with the World Cup in Section 3.3.
3.1 Group strength
To assess imbalance in groups at the Euro, we follow the method Lapré and Palazzolo (2023) used to assess imbalance in groups at the World Cup. Consequently, this section draws heavily from Lapré and Palazzolo (2023). First, for each Euro, we use World Football Elo Ratings (eloratings.net) to assess the strength for the participating teams at the time of the draw. As Elo ratings use a low volatility index, Elo ratings are well suited to assess team strength in empirical analysis over long periods of time (Gásquez and Royuela 2016). Scholars have extensively used Elo ratings (Cea et al. 2020; Csató 2022, 2023a,b; Gásquez and Royuela 2016; Lapré and Palazzolo 2023; Lasek et al. 2013; Lasek et al. 2016). Gomes de Pinho Zanco et al. (2024) provide a comprehensive analysis of the Elo method. Szczecinski and Djebbi (2020) improve on the Elo algorithm by modeling draws. Szczecinski (2022) further generalizes the Elo algorithm by modeling the margin of victory. FIFA has also adopted the Elo method since 2018 in their FIFA Men’s World Ranking, but Szczecinski and Roatis (2022) note that FIFA’s method can be improved by taking home advantage and goal difference into account.
Let
where W is the actual match outcome from team i’s perspective (1 for a win, 0.5 for a draw, and 0 for a loss) and the win expectancy on a neutral field is:
Win expectancy is modified if one team is playing at home by adding 100 points to the rating for the home team (eloratings.net/about).
For each of the 12 Euro tournaments since 1980, we collected Elo ratings for all participating teams at the time of the draw from international-football.net. Let r
it
be the Elo rating for team i on the date of the draw for Euro t. To incorporate home advantage, we increase the rating for the host team by 100 (Csató 2023a, 2025c; Lapré and Palazzolo 2023). Next, we use the team ratings to calculate group strength. For each group G
t
in Euro t, we calculate group strength

Group strength. Number of groups in 1980–1992: 2, 1996–2012: 4, 2016–2024: 6. A: Group strength calculated as the average Elo rating of all four teams in the group. B: Group strength calculated as the average Elo rating of the best three teams in the group.

Range in group strength. Number of groups in 1980–1992: 2, 1996–2012: 4, 2016–2024: 6.
To interpret Elo ratings for Euro teams we calculate several averages. During 1996–2024 (the years which featured quarterfinals), the average Elo rating for all quarterfinalists is 1,931 compared to 1,870 for all teams. So, the difference between an average Euro participant and an average quarterfinalist is 61 Elo rating points. Euro 1980 resulted in a top 4. Euro 1984 was the first tournament to feature semifinals. During 1980–2024, the average Elo rating for all semifinalists (or top 4) is 1,968 compared to 1,881 for all teams. Hence, the difference between an average Euro team and an average semifinalist is 87 Elo rating points. The range in group strength varies from 20 points in 1984 to 170 points in 2012. For seven of the eight tournaments with quarterfinals (1996–2024), the range in group strength is more than the 61-point difference between an average team and an average quarterfinalist. The extent of competitive imbalance has grown since the expansion to 16 teams in 1996 but shrank somewhat with the expansion to 24 teams in 2016. Our observations are similar when we consider
3.2 Group opponents rating
Following Lapré and Palazzolo (2023), we calculate group opponents rating for team i in Euro t as
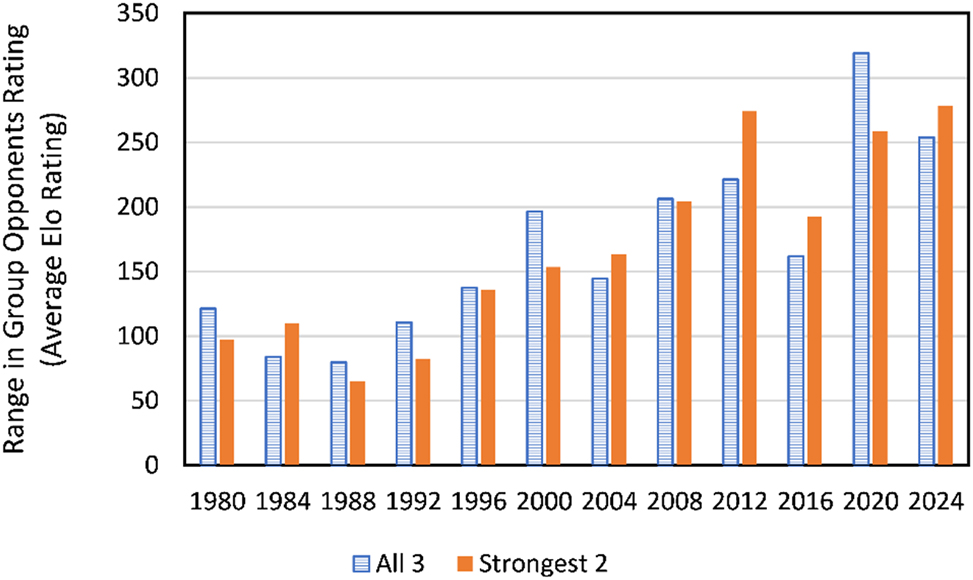
Range in group opponents rating. Number of groups in 1980–1992: 2, 1996–2012: 4, 2016–2024: 6.
3.3 Comparison of imbalance with FIFA World Cup
How does the variation in group strength for the Euro compare with the FIFA World Cup? We use the data on the 1954–2022 FIFA World Cup tournaments from Lapré and Palazzolo (2023). We perform several robust tests for the equality of variances in group strength across the World Cup and the Euro. Levene introduced a robust W 0 test statistic that does not assume that the underlying populations are from a Gaussian distribution (Brown and Forsythe 1974). Brown and Forsythe (1974) proposed alternative formulations for Levene’s test statistic that use more robust estimators of central tendency instead of the mean. The first alternative (W 50) replaces the mean with the median, while the second alternative replaces the mean with the 10 % trimmed mean (W 10). Table 3 reports all three robust tests of the equality of variance in group strength between the World Cup sample and the Euro sample. Clearly, all p-values are greater than 0.05. So, we cannot reject the null hypothesis that the variance in group strength is equal across the World Cup and the Euro. We arrive at the same conclusion for the group strength based on all four teams in the group or the strongest three teams in the group.
Robust variance test for group strength: World Cup versus Euro.
| Organizer | Number of observations | Years | Group strength all 4 teams | Group strength strongest 3 teams | ||
|---|---|---|---|---|---|---|
| Mean
|
Std. dev.
|
Mean
|
Std. dev.
|
|||
| FIFA | 108 | 1954–2022 | 1,841.7 | 46.92 | 1,894.3 | 51.18 |
| UEFA | 46 | 1980–2024 | 1,881.2 | 56.26 | 1,923.9 | 58.59 |
| Test statistic | p value | Test statistic | p value | |||
| W 0 = 2.47 | p = 0.118 | W 0 = 2.16 | p = 0.144 | |||
| W 50 = 2.52 | p = 0.115 | W 50 = 1.90 | p = 0.171 | |||
| W 10 = 2.45 | p = 0.120 | W 10 = 2.19 | p = 0.141 | |||
Our conclusion is robust for different subsamples as well. If we compare group strength for the 16-team World Cups (1954–1978) and the 16-team Euros (1996–2012), the variances are not statistically significantly different. We reach the same conclusion comparing the 24-team World Cups (1982–1994) and the 24-team Euros (2016–2024). Lastly, we also reach the same conclusion if we compare recent World Cups and Euros since 1998.
Next, we compare the variance in group opponents rating between the World Cup and the Euro. Table 4 shows that variances are not statistically significantly different regardless of whether we consider all three opponents or only the strongest two opponents in the group. In conclusion, the competitive imbalance in the Euro is just as large as it is in the World Cup.
Robust variance test for group opponents rating: World Cup versus Euro.
| Organizer | Number of observations | Years | Group opponents rating all 3 teams | Group opponents rating strongest 2 teams | ||
|---|---|---|---|---|---|---|
| Mean goppr it | Std. dev. goppr it | Mean
|
Std. dev.
|
|||
| FIFA | 432 | 1954–2022 | 1,841.7 | 63.43 | 1,906.2 | 70.52 |
| UEFA | 184 | 1980–2024 | 1,881.2 | 67.00 | 1,934.1 | 70.99 |
| Test statistic | p value | Test statistic | p value | |||
| W 0 = 0.635 | p = 0.426 | W 0 = 0.064 | p = 0.801 | |||
| W 50 = 0.635 | p = 0.426 | W 50 = 0.062 | p = 0.803 | |||
| W 10 = 0.642 | p = 0.423 | W 10 = 0.043 | p = 0.836 | |||
4 Impact of imbalanced groups
Following Lapré and Palazzolo (2023), we empirically investigate the impact of group opponents rating on two measures of success at the Euro. Our first measure of success is reaching the quarterfinals for the tournaments in 1996–2024. Our second measure of success is reaching the semifinals (or top 4 in 1980) for the tournaments 1980–2024.
4.1 Impact of group opponents rating on reaching the quarterfinals
The first dependent variable is QF
it
= 1 if team i reached the quarterfinals in Euro t, and 0 otherwise. Several factors can influence a team’s probability to reach the quarterfinals. First, we control for the number of teams, N
t
, in Euro t. Second, seeded teams are supposed to be the stronger teams. Seeded teams avoid playing each other in the group stage. We control for the potential benefit of being seeded (Monks and Husch 2009) with S
it
= 1 if team i was a seeded team in Euro t. Third, we control for the strength of team i in Euro t with r
it
. As mentioned in Section 3, home advantage for the host is included in the host rating. However, to test if there is an effect not captured by the extra 100 Elo points, we also include a host dummy H
it
= 1 if team i was a (co-)host for Euro t. For our key independent variable of interest, group opponents rating for team i in Euro t, we use both goppr
it
and
A negative value for β 1 means that a team playing in a Euro with more teams has a lower probability of reaching the quarterfinals. A positive value for β 2 means that a seeded team has a higher probability of reaching the quarterfinals. A positive value for β 3 means that a higher quality team has a higher probability of reaching the quarterfinals. A significant estimate for β 4 means that there is a home advantage effect not captured by the extra 100 Elo points included in the team rating. A negative value for β 5 implies that a team playing against higher quality opponents in the group stage has a lower probability of reaching the quarterfinals.
To avoid overfitting in logistic regression, Hosmer et al. (2013) recommend at least 10 observed events per independent variable. For the 8 Euros in years 1996–2024, we have 8 × 8 = 64 quarterfinal observations. Following the rule of 10 events per variable, we can include at most 6 independent variables. As we include only 5 independent variables in the full model, we are not at risk of overfitting.
Table 5 shows the results of the logistic regression for reaching the quarterfinals. In Model (1), the negative and statistically significant estimate for β 1 indicates that more teams in a tournament reduces the probability of reaching the quarterfinals. The insignificant estimate for β 2 means that seeded teams do not have a higher probability of reaching the quarterfinals. The positive and statistically significant estimate for β 3 indicates that stronger teams have a higher probability of reaching the quarterfinals. The insignificant estimate for β 4 means that any home advantage effect is not statistically significantly different from the extra 100 Elo points included in the team rating. The negative and statistically significant estimate for β 5 means that playing against stronger opponents in the group reduces the probability of reaching the quarterfinals. Model (2) shows that the impact of group opponents rating is robust if we measure group opponents ratings by averaging the ratings of the two strongest opponents in the group.
Logistic regression models for reaching the quarterfinals in the Euro: 1996–2024.
| (1) | (2) | (3) | (4) | |
|---|---|---|---|---|
| Constant, β 0 | 3.157 (7.734) | 0.892 (6.718) | 3.759 (7.671) | 1.258 (6.641) |
| Number of teams, β 1 | −0.116* (0.054) | −0.087 (0.049) | −0.119* (0.053) | −0.090 (0.049) |
| Seed, β 2 | 0.367 (0.549) | 0.291 (0.557) | ||
| Team rating, β 3 | 0.0070*** (0.0020) | 0.0073*** (0.0020) | 0.0071*** (0.0017) | 0.0073*** (0.0017) |
| Host, β 4 | −0.655 (0.652) | −0.679 (0.659) | ||
| Group opponents rating (all 3), β 5 | −0.0077* (0.0035) | −0.0081* (0.0033) | ||
| Group opponents rating (best 2), β 5 | −0.0069* (0.0029) | −0.0070* (0.0028) | ||
| LR χ 2 | 38.12*** | 38.59*** | 37.03*** | 37.50*** |
| McFadden Pseudo R 2 | 0.184 | 0.187 | 0.179 | 0.181 |
| Area under ROC | 0.779 | 0.780 | 0.777 | 0.777 |
| Number of observations | 152 | 152 | 152 | 152 |
-
Dependent variable: reaching the quarterfinals. Standard errors in parentheses. *Significant at 0.05, **at 0.01, and ***at 0.001.
Next, we quantify the impact of group opponents rating on the probability of reaching the quarterfinals. In Model (3) in Table 5, we re-estimate Model (1) without the insignificant seed and host variables. Let
In Section 3, we calculated that an average team for the 1996–2024 Euros has an Elo rating of 1,870 and the difference between an average team and an average quarterfinalist is 61 points. Note that 61 points is smaller than the observed ranges in Figure 3 for 1996–2024. Next, we compare an average team facing average opponents versus average quarterfinalists in the group, i.e., an increase in group opponents rating of 61 points. A change in group opponents rating from 1,870 to 1,931 drastically decreases the probability of reaching the quarterfinals. In a 16-team Euro, we find that an increase in group opponents rating from 1,870 to 1,931 decreases
The estimates in Table 5 for the Euro are similar to the estimates for the FIFA World Cup obtained by Lapré and Palazzolo (2023). We formally test whether the impact of group opponents rating on the probability of reaching the quarterfinals is the same across the World Cup and the Euro. First, we pool the observations from the Euro with the observations from the World Cup 1954–2022 (Lapré and Palazzolo 2023). We estimate Models (3) and (4) in Table 5 for the pooled dataset. (The seed variable was not significant for the World Cup. If we include the host variable, it is not significant either.) Models (1) and (2) in Table 6 report the results. Second, we define D Euro = 1 if an observation was from the Euro, 0 if the observation was from the World Cup. We test for a change in slope parameters for the Euro observations by estimating:
Pooled logistic regression models for reaching the quarterfinals in the 1954–2022 World Cup and the Euro 1996–2024.
| (1) | (2) | (3) | (4) | |
|---|---|---|---|---|
| Constant, β 0 | 4.686 (4.323) | 1.861 (3.960) | 5.573 (5.371) | 2.213 (4.955) |
| Number of teams, β 1 | −0.098*** (0.018) | −0.088*** (0.017) | −0.100*** (0.020) | −0.095*** (0.020) |
| Team rating, β 3 | 0.0077*** (0.0009) | 0.0078*** (0.0009) | 0.0078*** (0.0011) | 0.0080*** (0.0011) |
| Group opponents rating (all 3), β 5 | −0.0094*** (0.0019) | −0.0100*** (0.0023) | ||
| Group opponents rating (best 2), β 5 | −0.0078*** (0.0016) | −0.0081*** (0.0020) | ||
| D Euro, β 01 | −1.814 (9.364) | −0.954 (8.286) | ||
| Number of teams × D Euro, β 11 | −0.020 (0.057) | 0.005 (0.053) | ||
| Team rating × D Euro, β 31 | −0.0007 (0.0021) | −0.0007 (0.0021) | ||
| Group opponents rating (all 3) × D Euro, β 51 | 0.0018 (0.0040) | |||
| Group opponents rating (best 2) × D Euro, β 51 | 0.0011 (0.0034) | |||
| LR χ 2 | 184.25*** | 182.20*** | 185.08*** | 183.04*** |
| McFadden Pseudo R 2 | 0.241 | 0.238 | 0.242 | 0.239 |
| Area under ROC | 0.820 | 0.817 | 0.820 | 0.818 |
| Number of observations | 584 | 584 | 584 | 584 |
-
Dependent variable: reaching the quarterfinals. Standard errors in parentheses. *Significant at 0.05, **at 0.01, and ***at 0.001.
The results in Models (3) and (4) in Table 6 show that none of the interaction terms with D Euro are statistically significantly different from zero. Consequently, the impact of group opponents rating on the probability of reaching the quarterfinals is the same across the World Cup and the Euro.
4.2 Impact of group opponents rating on reaching the semifinals
Our second dependent variable is SF it = 1 if team i reached the semifinals in Euro t, and 0 otherwise. Table 7 shows the logistic regression results. For the 12 Euros from 1980 through 2024, we have 12 × 4 = 48 semifinal observations. Applying the rule of 10 events per variable, we can include at most 4 independent variables. In Model (1), the estimate for β 5 is not significant. So, in contrast to the quarterfinal analysis, a higher group opponents rating does not reduce the probability of reaching the semifinals. This finding is robust in Model (2) when we use only the two strongest opponents in the group to calculate group opponents rating. Seeding information is available since 1992. When we include Seed and Host in Models (3) and (4) in Table 7, neither variable is significant; none of our conclusions change. The findings in Table 7 for the Euro match the findings for the World Cup in Lapré and Palazzolo (2023). In the World Cup, group opponents rating did not significantly affect the probability of reaching the semifinals either.
Logistic regression models for reaching the semifinals in the Euro.
| (1) | (2) | (3) | (4) | |
|---|---|---|---|---|
| Constant, β 0 | −13.106 (8.365) | −14.405 (7.418) | −15.083 (9.189) | −15.648 (8.120) |
| Number of teams, β 1 | −0.098* (0.041) | −0.092* (0.038) | −0.095 (0.055) | −0.090 (0.051) |
| Seed, β 2 | 0.111 (0.557) | 0.100 (0.562) | ||
| Team rating, β 3 | 0.0096*** (0.0020) | 0.0096*** (0.0020) | 0.0099*** (0.0025) | 0.0099*** (0.0025) |
| Host, β 4 | 0.735 (0.628) | 0.728 (0.628) | ||
| Group opponents rating (all 3), β 5 | −0.0024 (0.0034) | −0.0018 (0.0039) | ||
| Group opponents rating (best 2), β 5 | −0.0018 (0.0029) | −0.0016 (0.0033) | ||
| LR χ 2 | 43.12*** | 43.01*** | 37.95*** | 37.95*** |
| McFadden Pseudo R 2 | 0.204 | 0.204 | 0.222 | 0.222 |
| Area under ROC | 0.804 | 0.804 | 0.813 | 0.813 |
| Number of observations | 184 | 184 | 160 | 160 |
-
Dependent variable: reaching the semifinals. Standard errors in parentheses. *Significant at 0.05, **at 0.01, and ***at 0.001.
5 Discussion and conclusion
In Section 3, we found that competitive imbalance in the Euro is just as bad as in the World Cup. In Section 4, we found that the impact of competitive imbalance is not statistically different across the World Cup and the Euro. Currently, the biggest contributing factor to competitive imbalance in the World Cup is that FIFA’s allocation of confederation slots does not align with the distribution of the best teams in the world. Even though UEFA does not have the complication of allocating slots to different continents, why does UEFA perform just as poorly as FIFA in terms of competitive imbalance? We identify two reasons.
First, for some Euros, UEFA made multiple low-ranked hosts seeds. Making a low-ranked host a seed increases competitive imbalance between groups (Lapré and Palazzolo 2023). For example, in Euro 2012 the two hosts – Poland and Ukraine – had the lowest Elo ratings among the 16 participants. Since both Poland and Ukraine were seeds, their two groups were significantly weaker than the other two groups. Similarly, in Euro 2008 seeded hosts Switzerland and Austria were the 12th and 16th ranked teams among the 16 participants.
The main reason why UEFA does not outperform FIFA in terms of competitive balance is the inadequacy of the ranking methods UEFA has used in the draw (Table 2). Similarly, for the UEFA Champions League, the most prestigious UEFA club competition, Csató (2024) shows that the Football Club Elo Rating robustly outperforms the currently used UEFA club coefficients in terms of predictive accuracy. In the 2000–2008 era, UEFA ranked teams based on the average points per game (3 for a win, 1 for a draw, 0 for a loss) for games played in the previous World Cup qualifying group and the current Euro qualifying group. Rankings should capture how a team stacks up against all other teams. UEFA, on the other hand, was only focused on games played within the qualifying group of a team. Crucially, all games with common opponents outside the group were ignored. There was no accounting for how strong a particular group was. Lastly, if a team wrapped up qualifying before all group matches were played, there was a reduced incentive to perform in the last qualifying games, which in turn could diminish the value of the final group standing – this is a common concern in the operations research literature (Chater et al. 2021; Csató et al. 2024).
In the 2012–2016 years, UEFA based the ranking on games in the current Euro qualifying group (40 %), the previous World Cup qualifying group and tournament (40 %), and the previous Euro qualifying group and tournament (20 %). While including tournament games was an improvement, several issues remained. Ranking points did not consider the strength of the opponent, many games were still ignored, and there was no justification for the weights.
In the 2020–2024 years, UEFA regressed and ranked teams based on average points per game for games in the current Euro qualifying group only. This ranking method has the same serious flaws as the 2000–2008 ranking method. Moreover, this method ignores even more games.
5.1 Predictive accuracy: UEFA ranking versus Elo rating
Next, we verify that the Elo rating is a more accurate predictor of success at the Euro than the UEFA ranking. We follow an approach similar to Csató (2024) who compares the predictive accuracy of UEFA club coefficients and football club Elo ratings in UEFA Champions League games. In the Euro, except for games featuring a (co-)host, both teams play on a neutral field. Therefore, we remove games featuring (co-)hosts in our prediction study. The 2020 Euro (held in 2021 because of the COVID-19 pandemic) was unusual as it featured 9 co-hosts (as opposed to the usual one host or two co-hosts). We also remove the 2020 Euro games in our prediction study. Lastly, following Csató (2024), we remove games that resulted in a draw in the group stage.
UEFA started ranking teams in 2000. So, we focus on 6 Euro tournaments: 2000–2016 and 2024. These tournaments had 226 games combined, of which 38 games featured a (co-)host. Of the remaining 188 games played on a neutral field, 40 games were group games that ended in a draw. Thus, our sample consists of 148 games played on a neutral field won by one team. For each game, by convention, we label the first team listed as the “home” team and the second team listed as the “away” team. The dependent variable is 1 if the home team won the game, 0 if the away team won the game. The first independent variable – UEFA ranking predicts win – is 1 if the UEFA ranking for the home team is higher than for the away team, 0 otherwise. The second independent variable – Elo rating predicts win – is 1 if the Elo rating for the home team is higher than for the away team, 0 otherwise.
Models (1) and (2) in Table 8 show that the prediction based on the Elo rating has a higher McFadden Pseudo R 2, higher percentage correctly classified, and a higher area under ROC. Furthermore, if we include both independent variables in Model (3), the prediction based on the UEFA ranking is not significant whereas the prediction based on the Elo rating is significant. Together, Models (1)–(3) suggest that the Elo rating is a more accurate predictor of success at the Euro than the ranking used by UEFA.
Logistic regression models for winning games in the 2000–2016 and 2024 Euro.
| (1) | (2) | (3) | (4) | |
|---|---|---|---|---|
| Constant | −0.717** (0.266) | −0.968*** (0.270) | −1.061*** (0.298) | −0.164 (0.183) |
| UEFA ranking predicts win | 1.152*** (0.348) | 0.338 (0.432) | ||
| Elo rating predicts win | 1.680*** (0.361) | 1.493*** (0.428) | ||
| Elo rating difference | 0.0054*** (0.0012) | |||
| LR χ 2 | 11.50*** | 23.75*** | 24.35*** | 27.80*** |
| McFadden Pseudo R 2 | 0.056 | 0.116 | 0.119 | 0.136 |
| Correctly classified | 63.5 % | 69.6 % | 69.6 % | 66.9 % |
| Area under ROC | 0.637 | 0.697 | 0.710 | 0.741 |
| Number of observations | 148 | 148 | 148 | 148 |
-
Dependent variable: the home team wins the game. Standard errors in parentheses. *Significant at 0.05, **at 0.01, and ***at 0.001.
As rankings are based on ratings, the difference in Elo ratings for two teams contains additional information beyond merely noting which team has the highest Elo rating. In Model (4), we use the difference in Elo ratings as the independent variable. Similar to Model (2), Model (4) outperforms Model (1). Compared to Model (2), Model (4) has a higher Pseudo R 2 (0.136 vs. 0.116) and a higher area under ROC (0.741 vs. 0.697), but a lower percentage correctly classified (66.9 % vs. 69.6 %). We cannot perform a similar analysis for UEFA ratings, because the 2024 UEFA rankings do not monotonically increase with the points in the qualifying groups as UEFA has ranked first the group winners and subsequently the group runners-up. Hence, some group winners are ranked higher than some group runners-up even though they obtained fewer points in the qualifying groups. Appendix A.1 shows that the findings in Table 8 are robust if we (i) split the sample into three periods corresponding to the UEFA ranking methods: 2000–2008, 2012–2016, and 2024, (ii) include the 21 games from the 2020 Euro played on a neutral field that did not end in a draw, and (iii) omit the 11 knockout-stage games decided by a penalty shootout.
5.2 UEFA versus FIFA progress
As mentioned in Section 3, scholars have extensively used World Elo Ratings to rank soccer teams. Next, we evaluate the gap between FIFA and UEFA ranking mechanisms on the one hand, and World Elo Ratings on the other hand. For each World Cup and Euro since 1998, we rank participating teams from 1 through N t using (i) the organizer’s ranking mechanism, and (ii) the World Elo ratings. Figure 4 shows the correlation between the organizer’s rank and the World Elo rank. The correlation between the FIFA rank and the World Elo rank has increased over time. While FIFA rankings were flawed for a long time (Lapré and Palazzolo 2023), FIFA adopted an Elo method for their World ranking in 2018. The 2022 World Cup was the first World Cup for which FIFA used their Elo method. This change likely contributed to the highest correlation of 91 % observed in Figure 4. UEFA improved the correlation between the UEFA rank and the World Elo rank in 2012 and 2016, but with the switch to an inferior ranking method, the correlation in 2024 was as low as 57 %.

Correlation between World Elo Rank and organizer’s rank of participating teams by tournament at the time of the draw. Squares indicate FIFA, diamonds indicate UEFA. Lines indicate one standard error below and above the Pearson correlation coefficient. The 2000 correlation is not significant. All other correlations are significant at 0.05.
To visualize what these correlations mean, Figure 5 shows scatterplots of the organizer’s rank against the World Elo rank for the 2022 World Cup and the Euro 2024. Even a correlation of 91 % is far from perfect (when all points fall on the 45-degree line). Indeed, as Szczecinski and Roatis (2022) point out, FIFA could still improve the predictive capacity of their Elo algorithm by taking home advantage and goal differential into account. The correlation of 57 % for the Euro 2024 is terrible. Group D (France, Netherlands, Austria, Poland) were all above the 45-degree line, meaning that UEFA underrated the strength of all four teams in group D. Indeed, group D was the toughest group (average Elo rating of 1,906), and two teams (France and Netherlands) reached the semifinals. Group E (Belgium, Ukraine, Romania, Slovakia) was the weakest group (average Elo rating of 1,794). Romania and Slovakia were severely overrated by UEFA whereas Ukraine was underrated. None of the teams from group E won a single game in the knockout stage.

Correlation between World Elo Rank and organizer’s rank of participating teams in the 2022 FIFA World Cup (0.91) versus the UEFA Euro 2024 (0.57) at the time of the draw. For Euro 2024, squares denote teams in group D; triangles denote teams in group E.
In Table 9, we list the seven policy recommendations Lapré and Palazzolo (2023) proposed for FIFA to avoid substantial competitive imbalance in the World Cup. Table 9 compares the progress FIFA and UEFA have made so far. Both FIFA and UEFA still make the host a seed. Both organizers have also recently started to perform the draw when not all participating teams are known. We recommend abolishing this practice. If, however, FIFA and UEFA continue with this practice, they should at least adopt Csató’s (2023a) solution.
Draw procedure recommendations from Lapré and Palazzolo (2023) for FIFA versus UEFA.
| Recommendation | FIFA | UEFA | |
|---|---|---|---|
| 1. | Use recent performance to assess team strength | Adopted in 2010 | Adopted in 2020 |
| 2. | Use an Elo rating system | Adopted in 2022, but could still improve | Needs to fix |
| 3. | Build pots based on team strength | Adopted in 2018 | Adopted in 2000 |
| 4. | Adopt a draw procedure developed to create balanced and geographically diverse groups | Adopted Guyon (2015) in 2018, but still needs to fix the non-uniform distribution | Not applicable |
| 5. | Do not make the host(s) a seed by default | Needs to fix | Needs to fix |
| 6. | Allocate confederation slots more closely aligned with the distribution of the best teams in the world |
Needs to fix | Not applicable |
| 7. | Do not perform the draw until all participating teams are known | Needs to fix | Needs to fix |
For the 2024 Euro, Table 15 in Appendix A.2 shows a comparison of the composition of the pots from the official UEFA regime with the composition of the pots formed strictly based on Elo ratings. Figure 6 shows the average pot strength for these two regimes. The Elo regime creates pots which are monotonically decreasing in strength. Under the UEFA regime, however, Pot 2 was even weaker than Pots 3 and 4!

Strength of pots according to the official UEFA seeding regime and a seeding regime based on World Elo Ratings for the 2024 Euro.
The greatest contributing factor to creating competitive imbalance at the World Cup is FIFA’s allocation of confederation slots. UEFA does not have to deal with this complication. So, it is even more surprising that (i) competitive imbalance at the Euro is just as bad as at the World Cup, and (ii) the impact of competitive imbalance is the same across the Euro and the World Cup. The main culprit is the poor rating mechanism UEFA uses to rank participating teams. UEFA club competitions suffer from a similar shortcoming (Csató 2024). Just like Csató (2024) recommends UEFA to adopt an Elo method to rate clubs, the fix for the Euro is easy: UEFA should adopt an Elo rating system for national teams, preferably the World Elo rating system, but even the current FIFA ranking would likely be an improvement.
Acknowledgments
The authors gratefully acknowledge Zoe Segal for research assistance and Yasin Alan for suggesting the robust variance tests. The authors thank the Associate Editor and two anonymous reviewers for the thoughtful and constructive feedback during the review process.
-
Research ethics: Not applicable.
-
Informed consent: Not applicable.
-
Author contributions: All authors have accepted responsibility for the entire content of this manuscript and approved its submission.
-
Use of Large Language Models, AI and Machine Learning Tools: None declared.
-
Conflict of interest: The authors state no conflict of interest.
-
Research funding: None declared.
-
Data availability: The datasets used in this study are available from the corresponding author upon reasonable request. The data were derived from the following publicly available resources: https://www.international-football.net/, https://en.wikipedia.org/wiki/UEFA_European_Championship, https://en.wikipedia.org/wiki/FIFA_World_Cup.
A.1 Additional analyses
Table 8 shows that the Elo rating is a more accurate predictor of success at the Euro than the ranking used by UEFA. Table 8 uses a sample for the 2000–2016 and 2024 Euro tournaments. UEFA used different ranking methods during this period (see Table 2). To test the robustness of the findings in Table 8, we split the sample into three periods corresponding to the UEFA ranking methods: 2000–2008, 2012–2016, and 2024. We do not have a lot of observations, but with 59, 56, and 33 observations respectively, it is still feasible to estimate logistic regressions with one or two independent variables. Tables 10–12 show the results for the split-sample analysis.
Table 10 (for 2000–2008) and 12 (for 2024) show the same findings as for Table 8. Models (1) and (2) show that the prediction based on the Elo rating has a higher McFadden Pseudo R 2, higher percentage correctly classified, and a higher area under ROC. Furthermore, if we include both independent variables in Model (3), the prediction based on the UEFA ranking is not significant whereas the prediction based on the Elo rating is significant. These two periods (2000–2008 and 2024) correspond to the weakest UEFA ranking methods as UEFA took only games played in qualifying groups into account.
For 2012–2016, UEFA did incorporate previous World Cup and Euro tournament results, but this ranking method still fell significantly short of an Elo rating. Table 11 shows that the Elo rating significantly predicts winning, whereas the UEFA ranking does not. Taken together, Tables 10–12 help show robustness for the findings reported in Table 8.
As mentioned in the paper, the 2020 Euro was unusual as it featured 9 co-hosts. Of the 51 games, only 21 games (i) were played on a neutral field, and (ii) did not end in a draw. Table 13 shows that our results are robust if we include these 21 games.
Lastly, in the 2000–2016 and 2024 Euro 11 matches were decided by a penalty shootout. Our results are robust if we omit these 11 matches decided by a penalty shootout (Table 14).
Logistic regression models for winning games in the 2000–2008 Euro.
| (1) | (2) | (3) | (4) | |
|---|---|---|---|---|
| Constant | −0.636 (0.412) | −0.965* (0.415) | −1.205* (0.496) | −0.062 (0.292) |
| UEFA ranking predicts win | 1.067* (0.545) | 0.585 (0.606) | ||
| Elo rating predicts win | 1.812** (0.576) | 1.635** (0.600) | ||
| Elo rating difference | 0.0080** (0.0027) | |||
| LR χ 2 | 3.98* | 10.96*** | 11.88** | 13.55*** |
| McFadden Pseudo R 2 | 0.049 | 0.134 | 0.145 | 0.166 |
| Correctly classified | 62.7 % | 71.2 % | 71.2 % | 71.2 % |
| Area under ROC | 0.628 | 0.712 | 0.739 | 0.762 |
| Number of observations | 59 | 59 | 59 | 59 |
-
Dependent variable: the home team wins the game. Standard errors in parentheses. *Significant at 0.05, **at 0.01, and ***at 0.001.
Logistic regression models for winning games in the 2012–2016 Euro.
| (1) | (2) | (3) | (4) | |
|---|---|---|---|---|
| Constant | −0.762 (0.458) | −0.887* (0.449) | −0.843 (0.469) | −0.329 (0.300) |
| UEFA ranking predicts win | 0.999 (0.573) | −0.385 (1.211) | ||
| Elo rating predicts win | 1.267* (0.576) | 1.596 (1.196) | ||
| Elo rating difference | 0.0045** (0.0017) | |||
| LR χ 2 | 3.16 | 5.14* | 5.25** | 7.72** |
| McFadden Pseudo R 2 | 0.041 | 0.067 | 0.068 | 0.100 |
| Correctly classified | 60.7 % | 64.3 % | 64.3 % | 69.6 % |
| Area under ROC | 0.615 | 0.649 | 0.650 | 0.709 |
| Number of observations | 56 | 56 | 56 | 56 |
-
Dependent variable: the home team wins the game. Standard errors in parentheses. *Significant at 0.05, **at 0.01, and ***at 0.001.
Logistic regression models for winning games in the 2024 Euro.
| (1) | (2) | (3) | (4) | |
|---|---|---|---|---|
| Constant | −0.788 (0.540) | −1.099 (0.577) | −1.351* (0.654) | 0.009 (0.399) |
| UEFA ranking predicts win | 1.664* (0.758) | 0.874 (0.885) | ||
| Elo rating predicts win | 2.277** (0.813) | 1.896* (0.885) | ||
| Elo rating difference | 0.0051** (0.0020) | |||
| LR χ 2 | 5.25* | 9.17** | 10.12** | 8.53*** |
| McFadden Pseudo R 2 | 0.115 | 0.201 | 0.221 | 0.187 |
| Correctly classified | 69.7 % | 75.8 % | 75.8 % | 75.8 % |
| Area under ROC | 0.697 | 0.757 | 0.790 | 0.785 |
| Number of observations | 33 | 33 | 33 | 33 |
-
Dependent variable: the home team wins the game. Standard errors in parentheses. *Significant at 0.05, **at 0.01, and ***at 0.001.
Logistic regression models for winning games in the 2000–2024 Euro.
| (1) | (2) | (3) | (4) | |
|---|---|---|---|---|
| Constant | −0.821*** (0.256) | −1.047*** (0.260) | −1.169*** (0.288) | −0.247 (0.173) |
| UEFA ranking predicts win | 1.218*** (0.329) | 0.437 (0.405) | ||
| Elo rating predicts win | 1.676*** (0.340) | 1.436*** (0.402) | ||
| Elo rating difference | 0.0055*** (0.0011) | |||
| LR χ 2 | 14.45*** | 26.71*** | 27.86*** | 32.12*** |
| McFadden Pseudo R 2 | 0.062 | 0.114 | 0.119 | 0.137 |
| Correctly classified | 63.9 % | 69.2 % | 69.2 % | 68.1 % |
| Area under ROC | 0.643 | 0.695 | 0.711 | 0.744 |
| Number of observations | 169 | 169 | 169 | 169 |
-
Dependent variable: the home team wins the game. Standard errors in parentheses. *Significant at 0.05, **at 0.01, and ***at 0.001.
Logistic regression models for winning games in the 2000–2016 and 2024 Euro omitting games decided by a penalty shootout.
| (1) | (2) | (3) | (4) | |
|---|---|---|---|---|
| Constant | −0.693* (0.274) | −0.938*** (0.278) | −1.034*** (0.306) | −0.110 (0.188) |
| UEFA ranking predicts win | 1.197*** (0.361) | 0.361 (0.451) | ||
| Elo rating predicts win | 1.715*** (0.375) | 1.512*** (0.448) | ||
| Elo rating difference | 0.0051*** (0.0012) | |||
| LR χ 2 | 11.53*** | 22.89*** | 23.52*** | 23.64*** |
| McFadden Pseudo R 2 | 0.061 | 0.121 | 0.124 | 0.125 |
| Correctly classified | 64.2 % | 70.1 % | 70.1 % | 69.3 % |
| Area under ROC | 0.643 | 0.701 | 0.714 | 0.732 |
| Number of observations | 137 | 137 | 137 | 137 |
-
Dependent variable: the home team wins the game. Standard errors in parentheses. *Significant at 0.05, **at 0.01, and ***at 0.001.
A.2 Composition of the pots
Table 15 shows the composition of the pots used by UEFA for the 2024 Euro on the left. UEFA did not rank host Germany. Three unknown playoff winners were placed in Pot 4. The UEFA ranking was based on points in the Euro qualifying groups ignoring games played against 6th placed teams. Table 15 shows an alternative composition of the pots on the right based strictly on Elo ratings following the recommendations in Table 9. Even if the draw were to be held when playoff winners were unknown, we would arrive at the same pots following Csató (2023a) (each playoff spot would be placed in the pot according to the team with the highest rating). The playoff winner of Path A (Poland 1710, Wales 1696, Finland 1641, Estonia 1366) would be placed in Pot 4 in the Poland slot; the playoff winner of Path B (Ukraine 1850, Israel 1603, Bosnia and Herzegovina 1485, Iceland 1479) would be placed in Pot 2 in the Ukraine slot; and the playoff winner of Path C (Greece 1729, Georgia 1638, Luxembourg 1520, Kazakhstan 1481) would be placed in Pot 4 instead of Georgia.
Pots for the 2024 Euro draw: official UEFA regime versus Elo-based regime.
| UEFA regime | UEFA rank | UEFA points | Elo rating | Elo-based regime | Elo rank | Elo rating | UEFA pot |
|---|---|---|---|---|---|---|---|
| Pot 1 | 2011 | Pot 1 | 2025 | ||||
| Germanya | – | – | 1886 | France | 1 | 2110 | 1 |
| Portugal | 1 | 24 | 2033 | Portugal | 2 | 2033 | 1 |
| France | 2 | 22 | 2110 | Spain | 3 | 2033 | 1 |
| Spain | 3 | 21 | 2033 | England | 4 | 2015 | 1 |
| Belgium | 4 | 20 | 1990 | Belgium | 5 | 1990 | 1 |
| England | 5 | 20 | 2015 | Netherlands | 6 | 1970 | 3 |
| Pot 2 | 1761 | Pot 2 | 1882 | ||||
| Hungary | 6 | 18 | 1834 | Croatia | 7 | 1952 | 3 |
| Turkey | 7 | 17 | 1766 | Italy | 8 | 1938 | 4 |
| Romania | 8 | 16 | 1674 | Germany | 9 | 1886 | 1 |
| Denmark | 9 | 16 | 1825 | Ukraine | 10 | 1850 | 4 |
| Albania | 10 | 15 | 1632 | Austria | 11 | 1835 | 2 |
| Austria | 11 | 19 | 1835 | Hungary | 12 | 1834 | 2 |
| Pot 3 | 1809 | Pot 3 | 1791 | ||||
| Netherlands | 12 | 18 | 1970 | Denmark | 13 | 1825 | 2 |
| Scotland | 13 | 17 | 1801 | Serbia | 14 | 1802 | 4 |
| Croatia | 14 | 16 | 1952 | Scotland | 15 | 1801 | 3 |
| Slovenia | 15 | 16 | 1710 | Switzerland | 16 | 1792 | 4 |
| Slovakia | 16 | 16 | 1662 | Turkey | 17 | 1766 | 2 |
| Czechia | 17 | 15 | 1757 | Czechia | 18 | 1757 | 3 |
| Pot 4 | 1788 | Pot 4 | 1671 | ||||
| Italy | 18 | 14 | 1938 | Poland | 19 | 1710 | 4 |
| Serbia | 19 | 14 | 1802 | Slovenia | 20 | 1710 | 3 |
| Switzerland | 20 | 11 | 1792 | Romania | 21 | 1674 | 2 |
| Polandb | – | 11 | 1710 | Slovakia | 22 | 1662 | 3 |
| Ukraineb | – | 14 | 1850 | Georgia | 23 | 1638 | 4 |
| Georgiab | – | 8 | 1638 | Albania | 24 | 1632 | 2 |
-
aUEFA did not rank host Germany. bPlay-off winner unknown at the time of the draw. Elo rank is based on the 24 participating teams. Average pot strength in bold.
References
Berker, Y. (2014). Tie-breaking in round-robin soccer tournaments and its influence on the autonomy of relative rankings: UEFA vs. FIFA regulations. Eur. Sport Manag. Q. 14: 194–210, https://doi.org/10.1080/16184742.2014.884152.Search in Google Scholar
Brown, M.B. and Forsythe, A.B. (1974). Robust tests for the equality of variances. J. Stat. Assoc. 69: 364–367, https://doi.org/10.2307/2285659.Search in Google Scholar
Cea, S., Durán, G., Guajardo, M., Sauré, D., Siebert, J., and Zamorano, G. (2020). An analytics approach to the FIFA ranking procedure and the World Cup final draw. Ann. Oper. Res. 286: 199–146.10.1007/s10479-019-03261-8Search in Google Scholar
Chater, M., Arrondel, L., Gayant, J.P., and Laslier, J.F. (2021). Fixing match-fixing: optimal schedules to promote competitiveness. Eur. J. Oper. Res. 294: 673–683, https://doi.org/10.1016/j.ejor.2021.02.006.Search in Google Scholar
Csató, L. (2021). Tournament design: how operations research can improve sports rules. Palgrave Macmillan, Cham.10.1007/978-3-030-59844-0Search in Google Scholar
Csató, L. (2022). Quantifying incentive (in)compatibility: a case study from sports. Eur. J. Oper. Res. 302: 717–726, https://doi.org/10.1016/j.ejor.2022.01.042.Search in Google Scholar
Csató, L. (2023a). Group draw with unknown qualified teams: a lesson from 2022 FIFA World Cup. Int. J. Sports Sci. Coach. 18: 539–551, https://doi.org/10.1177/17479541221108799.Search in Google Scholar
Csató, L. (2023b). How to avoid uncompetitive games? The importance of tie-breaking rules. Eur. J. Oper. Res. 307: 1260–1269, https://doi.org/10.1016/j.ejor.2022.11.015.Search in Google Scholar
Csató, L. (2023c). Quantifying the unfairness of the 2018 FIFA World Cup qualification. Int. J. Sports Sci. Coach. 18: 183–196, https://doi.org/10.1177/17479541211073455.Search in Google Scholar
Csató, L. (2024). Club coefficients in the UEFA Champions league: time for shift to an Elo-based formula. Int. J. Perform. Anal. Sports 24: 119–134, https://doi.org/10.1080/24748668.2023.2274221.Search in Google Scholar
Csató, L. (2025a). Mitigating the risk of tanking in multi-stage tournaments. Ann. Oper. Res. 344: 135–151, https://doi.org/10.1007/s10479-024-06311-y.Search in Google Scholar
Csató, L. (2025b). On head-to-head results as tie-breaker and consequent opportunities for collusion. IMA J. Manag. Math. 36: 215–230, https://doi.org/10.1093/imaman/dpae016.Search in Google Scholar
Csató, L. (2025c). The fairness of the group draw for the FIFA World Cup. Int. J. Sports Sci. Coach. 20: 554–567, https://doi.org/10.1177/17479541241300219.Search in Google Scholar
Csató, L. (2025d). The optimal design of the group draw in sports tournaments, Manuscript. arXiv:2109.13785.Search in Google Scholar
Csató, L., Molontay, R., and Pintér, J. (2024). Tournament schedules and incentives in a double round-robin tournament with four teams. Int. Trans. Oper. Res. 31: 1486–1514, https://doi.org/10.1111/itor.13391.Search in Google Scholar
Csató, L., Kiss, L.M., and Szádoczki, Z. (2025). The allocation of FIFA World Cup slots based on the ranking of confederations. Ann. Oper. Res. 344: 153–173, https://doi.org/10.1007/s10479-024-06091-5.Search in Google Scholar
Devriesere, K., Csató, L., and Goossens, D. (2025). Tournament design: a review from an operational research perspective. Eur. J. Oper. Res. 324: 1–21, https://doi.org/10.1016/j.ejor.2024.10.044.Search in Google Scholar
Gásquez, R. and Royuela, V. (2016). The determinants of international football success: a panel data analysis of the Elo rating. Soc. Sci. Q. 97: 125–141, https://doi.org/10.1111/ssqu.12262.Search in Google Scholar
Gomes de Pinho Zanco, D., Szczecinski, L., Kuhn, E.V., and Seara, R. (2024). Stochastic analysis of the Elo rating algorithm in round-robin tournaments. Digit. Signal Process. 145: 104313, https://doi.org/10.1016/j.dsp.2023.104313.Search in Google Scholar
Groll, A. and Abedieh, J. (2013). Spain retains its title and sets a new record – generalized linear mixed models on european football championship. J. Quant. Anal. Sports 9: 51–66, https://doi.org/10.1515/jqas-2012-0046.Search in Google Scholar
Groll, A., Kneib, T., Mayr, A., and Schauberger, G. (2018). On the dependency of soccer scores – a sparse bivariate Poisson model for the UEFA European football championship 2016. J. Quant. Anal. Sports 14: 65–79, https://doi.org/10.1515/jqas-2017-0067.Search in Google Scholar
Groll, A., Schauberger, G., and Van Eetvelde, H. (2020). Ranking and prediction models for football data. In: Ley, C. and Dominicy, Y. (Eds.), Science meets sports: when statistics are more than numbers. Cambridge Scholars Publishing, Newcastle upon Tyne, pp. 95–122.Search in Google Scholar
Guajardo, M. and Krumer, A. (2024). Tournament design for a FIFA World Cup with 12 four-team groups: every win matters. In: Breuer, M. and Forrest, D. (Eds.), The palgrave handbook on the economics of manipulation in sports. Palgrave Macmillan, Cham, Switzerland, pp. 207–230.10.1007/978-3-031-63581-6_11Search in Google Scholar
Guyon, J. (2015). Rethinking the FIFA World Cup final draw. J. Quant. Anal. Sports 11: 169–182, https://doi.org/10.1515/jqas-2014-0030.Search in Google Scholar
Guyon, J. (2018a). Pourquoi la Coupe du Monde est plus equitable cette année, The Conversation June 13, Available at: https://theconversation.com/pourquoi-la-coupe-du-monde-est-plus-equitable-cette-annee-97948 (Accessed 19 April 2022).Search in Google Scholar
Guyon, J. (2018b). What a fairer 24 team UEFA Euro could look like. J. Sports Anal. 4: 297–317, https://doi.org/10.3233/jsa-180219.Search in Google Scholar
Haan, M., Koning, R.H., and van Witteloostuijn, A. (2007). Competitive balance in national European soccer competitions. In: Albert, J. and Koning, R.H. (Eds.), Statistical thinking in sports. CRC Press, Boca Raton, pp. 63–75.10.1201/9781584888697.ch4Search in Google Scholar
Hall, N.G. and Liu, Z. (2024). Opponent choice in tournaments: winning and shirking. J. Quant. Anal. Sports 20: 67–86, https://doi.org/10.1515/jqas-2023-0030.Search in Google Scholar
Hosmer, D.W., Lemeshow, S., and Sturdivant, R.X. (2013). Applied logistic regression, 3rd ed. John Wiley & Sons, Hoboken, New Jersey.10.1002/9781118548387Search in Google Scholar
Kaminski, M.M. (2022). How strong are soccer teams? The “host paradox” and other counterintuitive properties of FIFA’s former ranking system. Games 13: 22, https://doi.org/10.3390/g13020022.Search in Google Scholar
Koning, R.H. (2000). Balance in competition in Dutch soccer. Stat. 49: 419–431, https://doi.org/10.1111/1467-9884.00244.Search in Google Scholar
Koning, R.H. (2017). Rating of team abilities in soccer. In: Albert, J., Glickman, M.E., Swartz, T.B., and Koning, R.H. (Eds.), Handbook of statistical methods and analyses in sports. CRC Press, Boca Raton, pp. 355–371.Search in Google Scholar
Krumer, A. and Moreno-Ternero, J.D. (2023). The allocation of additional slots for the FIFA World Cup. J. Sports Econ. 24: 831–850, https://doi.org/10.1177/15270025231160757.Search in Google Scholar
Laliena, P. and López, F.J. (2019). Fair draws for group rounds in sport tournaments. Int. Trans. Oper. Res. 26: 439–457, https://doi.org/10.1111/itor.12565.Search in Google Scholar
Laliena, P. and López, F.J. (2025). Draw procedures for balanced 3-team group rounds in sports competitions. Ann. Oper. Res. 346: 2065–2092, https://doi.org/10.1007/s10479-025-06497-9.Search in Google Scholar
Lapré, M.A. and Palazzolo, E.M. (2022). Quantifying the impact of imbalanced groups in FIFA Women’s World Cup tournaments 1991–2019. J. Quant. Anal. Sports 18: 187–199, https://doi.org/10.1515/jqas-2021-0052.Search in Google Scholar
Lapré, M.A. and Palazzolo, E.M. (2023). The evolution of seeding systems and the impact of imbalanced groups in FIFA Men’s World Cup tournaments 1954–2022. J. Quant. Anal. Sports 19: 317–332, https://doi.org/10.1515/jqas-2022-0087.Search in Google Scholar
Lasek, J., Szlávik, Z., and Bhulai, S. (2013). The predictive power of ranking systems in association football. Int. J. Appl. Pattern Recognit. 1: 27–46, https://doi.org/10.1504/ijapr.2013.052339.Search in Google Scholar
Lasek, J., Szlávik, Z., Gagolewski, M., and Bhulai, S. (2016). How to improve a team’s position in the FIFA ranking? A simulation study. J. Appl. Stat. 43: 1349–1368, https://doi.org/10.1080/02664763.2015.1100593.Search in Google Scholar
Monks, J. and Husch, J. (2009). The impact of seeding, home continent, and hosting on FIFA World Cup results. J. Sports Econ. 10: 391–408, https://doi.org/10.1177/1527002508328757.Search in Google Scholar
Renner, V., Görgen, K., Woll, A., Wäsche, H., and Schienle, M. (2025). Success factors in national team football: an analysis of the UEFA EURO 2020. J. Quant. Anal. Sports 21: 73–95, https://doi.org/10.1515/jqas-2023-0026.Search in Google Scholar
Roberts, G.O. and Rosenthal, J.S. (2024). Football group draw probabilities and corrections. Can. J. Stat. 52: 659–677, https://doi.org/10.1002/cjs.11798.Search in Google Scholar
Scarf, P.A. and Yusof, M.M. (2011). A numerical study of tournament structure and seeding policy for the soccer World Cup finals. Stat. Neerl. 65: 43–57, https://doi.org/10.1111/j.1467-9574.2010.00471.x.Search in Google Scholar
Stronka, W. (2020). Anti-tanking pair matching before an elimination phase of a two-phase tournament. Economies 8: 66, https://doi.org/10.3390/economies8030066.Search in Google Scholar
Stronka, W. (2024). Demonstration of the collusion risk mitigation effect of random tie-breaking and dynamic scheduling. Sports Econ. Rev. 5: 100025, https://doi.org/10.1016/j.serev.2024.100025.Search in Google Scholar
Szczecinski, L. (2022). G-Elo: generalization of the Elo algorithm by modeling the discrete margin of victory. J. Quant. Anal. Sports 18: 1–14, https://doi.org/10.1515/jqas-2020-0115.Search in Google Scholar
Szczecinski, L. and Djebbi, A. (2020). Understanding draws in Elo rating algorithm. J. Quant. Anal. Sports 16: 211–220, https://doi.org/10.1515/jqas-2019-0102.Search in Google Scholar
Szczecinski, L. and Roatis, I.I. (2022). FIFA ranking: evaluation and path forward. J. Sports Anal. 8: 231–250, https://doi.org/10.3233/jsa-200619.Search in Google Scholar
Tenni, S., Gomes de Pinho Zanco, D., and Szczecinski, L. (2025). FIVB ranking: misstep in the right direction. J. Quant. Anal. Sports, https://doi/10.1515/jqas-2024-0128.10.1515/jqas-2024-0128Search in Google Scholar
Van Eetvelde, H. and Ley, C. (2019). Ranking methods in soccer. In: Kenett, R.S., Longford, T.N., Piegorsch, W., and Ruggeri, F. (Eds.), Wiley StatsRef: statistics reference online. Springer, Hoboken, New Jersey, pp. 1–9.10.1002/9781118445112.stat08161Search in Google Scholar
© 2025 the author(s), published by De Gruyter, Berlin/Boston
This work is licensed under the Creative Commons Attribution 4.0 International License.