Reference ranges for fetal tricuspid and mitral annular plane systolic excursions
-
Jakkapop Kanjak
 ,
Ratana Komwilaisak
,
Ratana Komwilaisak
 ,
Piyamas Saksiriwuttho
,
Piyamas Saksiriwuttho

Abstract
Objectives
Echocardiography is the standard tool for assessing fetal cardiac function. Tricuspid annular plane systolic excursion (TAPSE) and mitral annular plane systolic excursion (MAPSE) are simple, reliable indicators of systolic function. Many studies have established reference ranges in adult and pediatric populations; however, data remain limited in fetuses, especially in Southeast Asia. The aim of the study was to establish normal reference ranges for TAPSE and MAPSE in fetuses born between 18 + 0 and 37 + 6 weeks’ gestation in a Southeast Asian population.
Methods
This prospective, cross-sectional study was conducted between January 2024 and February 2025. Data from 280 singleton pregnancies with normal fetal growth and no maternal comorbidities were included in the study. TAPSE and MAPSE were measured using M-mode imaging in a four-chamber view. Percentile reference values were determined using quantile regression models, with gestational age (GA) and estimated fetal weight (EFW) as predictors. The intraclass correlation coefficient (ICC) was used to assess intra- and interobserver reliability.
Results
TAPSE and MAPSE were significantly and positively correlated with GA and EFW. Mean TAPSE ranged from 3.76 to 9.08 mm (GA) and 3.42 to 9.30 mm (EFW), while MAPSE ranged from 3.10 to 6.34 mm (GA) and 2.71 to 6.60 mm (EFW). The TAPSE values consistently exceeded the MAPSE values across all GAs. The inter- and intra-observer ICCs were high (TAPSE, 0.94/0.91; MAPSE, 0.91/0.88).
Conclusions
This study established the first normal TAPSE and MAPSE reference ranges for a Southeast Asian population and provided reliable tools for fetal cardiac assessment.
Introduction
Echocardiography is the standard modality essential for evaluating fetal cardiac function. Evaluation of fetal cardiac function is particularly critical in cases of congenital fetal cardiac anomalies, fetal tumors [1], fetal anemia [2], fetal growth restriction (FGR) [3], twin-to-twin transfusion syndrome (TTTS) [4], 5], and placental tumors [1]. Various sonographic techniques are used to assess systolic, diastolic, and global cardiac functions. For instance, the E/A ratio is used to evaluate diastolic function, while parameters such as shortening fraction, ejection fraction, tricuspid annular plane systolic excursion (TAPSE), and mitral annular plane systolic excursion (MAPSE) are utilized for systolic function. The myocardial performance index provides an assessment of global cardiac function. However, no main method for functional assessment. This study will focus on measuring fetal systolic function [6], 7].
Fetal systolic function can be quantified using parameters including shortening fraction, ejection fraction, TAPSE, and MAPSE [6]. Although shortening and ejection fractions provide valuable data, they typically show changes in the late stages of fetal cardiac dysfunction. Moreover, the complexity of their calculation may be limited in specific situations. Conversely, TAPSE and MAPSE reflect the maximum vertical displacement of the lateral leaflet of the atrioventricular valve using M-mode, and their values can detect changes as early as the initial stages of cardiac dysfunction. These methods are simple and easy to perform and do not require advanced ultrasonography techniques. Moreover, TAPSE and MAPSE be measured using standard ultrasound equipment and are practical for routine clinical applications.
While the normal reference ranges for TAPSE and MAPSE have been extensively studied in adult [8], [9], [10] and pediatric [11], [12], [13], [14] populations, data regarding fetal reference ranges remain limited, particularly among Southeast Asian populations. As such, this study aimed to establish normal reference ranges for TAPSE and MAPSE in fetuses at 18 + 0 to 37 + 6 weeks’ gestation.
Materials and methods
Study population
This prospective cross-sectional study was conducted from January 2024 to February 2025 at Srinagarind Hospital, Faculty of Medicine, Khon Kaen University, Thailand. The inclusion criteria included women ≥18 years of age with a singleton pregnancy, an accurately determined gestational age (GA) based on crown–rump length measurement during the first trimester, normally grown fetuses, no maternal underlying diseases, and GA between 18 + 0 and 37 + 6 weeks. The exclusion criteria included fetuses with structural anomalies, aneuploidy, or intrauterine growth restriction by Lees et al. [15]. Withdrawal criteria included the identification of fetal cardiac anomalies or other structural abnormalities at birth. Informed consent was obtained from all participants before enrollment in the study. The study was approved by the Khon Kaen University Ethics Committee for Human Research, and adhered to the Declaration of Helsinki and the International Council for Harmonization Good Clinical Practice Guidelines (reference number HE661527).
To evaluate the characteristics of the study population, data regarding maternal age, ethnicity, number of pregnancies, parity, gestational age, pre-pregnancy weight, and height, were collected. All study participants were followed-up postpartum to confirm the absence of structural or cardiac abnormalities in the fetus through routine physical examination. Inter- and intra-observer variabilities were also assessed. This process was blinded to the two sonographers (J.K. and R.K.) who independently evaluated 10 random cases The intraclass correlation coefficient (ICC) was calculated with corresponding 95 % confidence interval (CI), with an acceptable CI width of 0.15 mm. Intra-observer variability (J.K.) was assessed by performing two measurements 15 min apart in 16 participants. The intraclass correlation coefficient (ICC) was calculated with corresponding 95 % confidence interval (CI), with an acceptable CI width of 0.10 mm.
Sonography
Examinations were performed using an ultrasound device (Voluson E10 or S8, GE Healthcare Ultrasound, Milwaukee, WI, USA) equipped with an XDclear wide-band convex probe C1-6-D, with a maximum bandwidth of 2–5 MHz. GA was determined based on the last menstrual period and was confirmed using ultrasonography in the first-trimester. All participants underwent fetal anomaly scans by J.K. according to the International Society of Ultrasound in Obstetrics and Gynecology Practice Guidelines for routine mid-trimester fetal ultrasound [16]. Fetal biometry was performed, and estimated fetal weight (EFW) was calculated using the equation described by Hadlock et al. [17].
Positional measurements of TAPSE (Figure 1A) and MAPSE (Figure 1B) were obtained using a four-chamber view with the fetal heart positioned at 12 or 6 o’clock. The image was adjusted and conventional M-mode was used. A cursor was placed through the lateral leaflets of the tricuspid and mitral valves, maintaining an insonation angle of <15° relative to the interventricular septum during maternal breath-holding and fetal rest. The maximum longitudinal displacement of atrioventricular valve motion was measured. Each evaluation was performed 3 times and the mean value was calculated and used in the analysis [18].
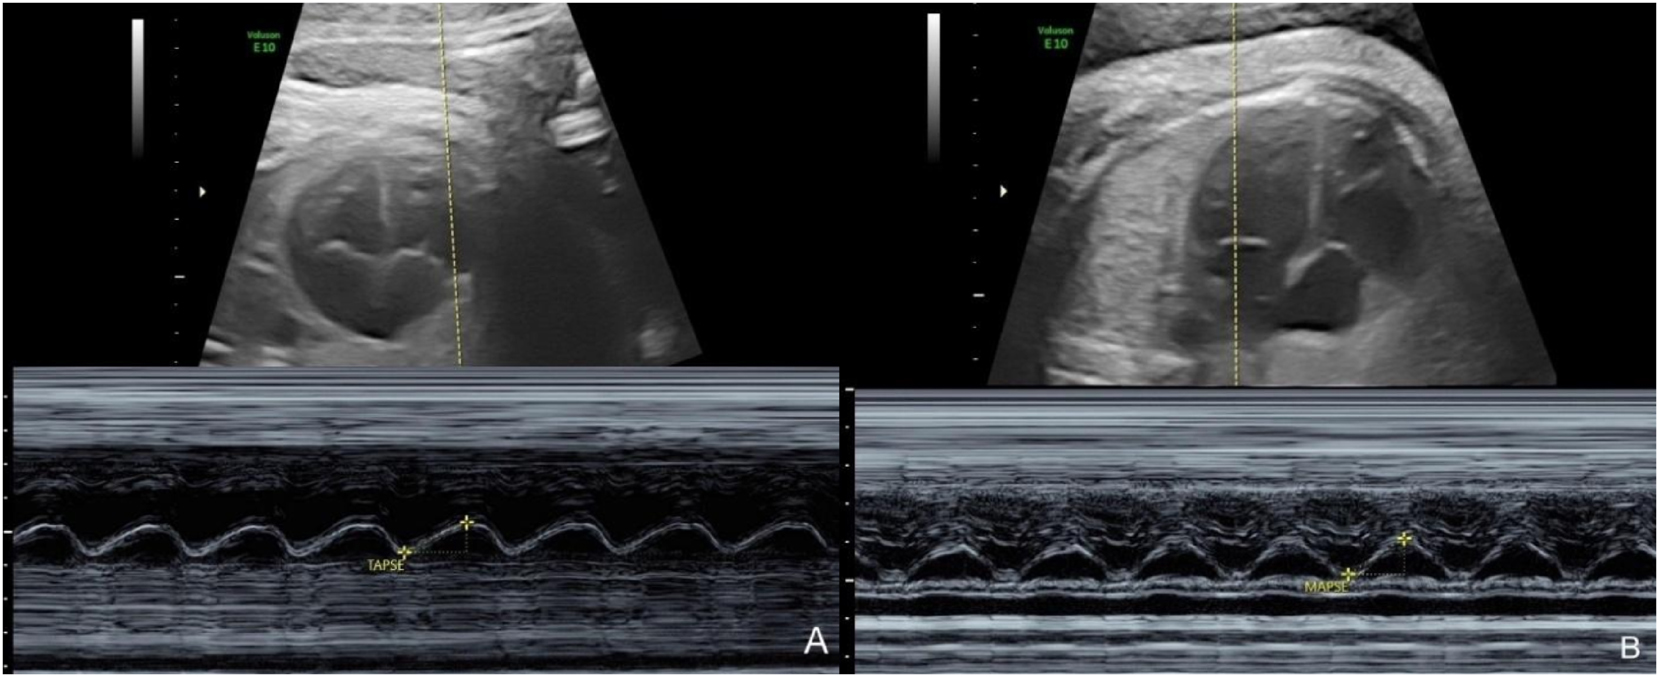
Ultrasound images of the apical four-chamber view of the fetal cardiac demonstrated longitudinal atrioventricular valve motion measurement with the M-mode. (A) Tricuspid annular plane systolic excursion (TAPSE), (B) mitral valve annular plane systolic excursion (MAPSE). Longitudinal displacement measurement is demonstrated at the bottom of the image.
Statistical analysis
Scatter plots of individual MAPSE and TAPSE values vs. GA and EFW were examined. TAPSE and MAPSE exhibited nonlinear associations with GA and EFW, with increasing variability observed as GA and EFW advanced. Logarithmic transformation was applied to the GA and EFW to enhance linearity and improve the model fit. Simultaneous quantile regression was performed to estimate the 1st, 2.5th, 5th, 10th, 25th, 50th, 75th, 90th, 97.5th, and 99th percentiles of MAPSE and TAPSE as functions of GA and EFW. All statistical analyses were performed using Stata Release 18.0 (StataCorp LLC, College Station, TX, USA).
The required sample size for each GA group was determined using an equation to estimate the population mean. The calculation was based on the following parameters: a Z-score of 1.96 for the desired confidence level; a standard deviation of 0.65 cm; and a margin of error of 0.35 cm. Applying these values, the estimated sample size per GA group was 14 pregnancies, with a total of 280 participants.
Results
Data from 280 pregnant women who fulfilled the inclusion and exclusion criteria for establishing a normal reference range were included. The demographic characteristics of the study population and perinatal outcomes are summarized in Table 1. The mean maternal age was 33.0 years, and the mean pre-pregnancy body mass index was 23.8 kg/m2. Most participants were pregnant Thai women. The median GA at delivery was 38 weeks, with a mean birth weight of 3,081 g. A total of 135 and 145 pregnant women underwent vaginal and cesarean deliveries, respectively, with mean Apgar scores of 8 and 9 at 1 and 5 min. Normal reference ranges for TAPSE based on GA and EFW, respectively, are summarized in Tables 2 and 3. The mean TAPSE across GA ranged from 3.76 to 9.08 mm, while the mean TAPSE across EFW ranged from 3.42 to 9.30 mm. Scatterplots for TAPSE vs. GA and EFW, illustrating an increasing trend with gestational age, are presented in Figures 2 and 3. Normal reference ranges for the MAPSE based on GA and EFW are presented in Tables 4 and 5. The mean MAPSE across GA ranged from 3.10 to 6.34 mm, while the mean MAPSE across EFW varied from 2.71 to 6.60 mm. Scatterplots for MAPSE vs. GA and EFW, demonstrating an increase with GA, are presented in Figures 4 and 5. Both TAPSE and MAPSE exhibited significant positive correlations with GA and EFW. The optimal model for predicting these values was a logarithmic transformation that provided the best fit. Notably, the mean TAPSE values consistently exceeded the MAPSE values at all GAs.
Demographics of the study populations.
| Characteristic | Value |
|---|---|
| Maternal age, years | 33.0 ± 4.8 (mean ± SD) |
| Body mass index, kg/m2 | 23.8 ± 5.0 (mean ± SD) |
| Gestational age at birth, weeks | 38 (38,39) (median, IQR) |
| Type of delivery | |
| –Vaginal | 135 (48 %) |
| –Cesarean | 145 (52 %) |
| Birth weight, grams | 3,081 ± 439 (mean ± SD) |
| Apgar 1 min | 8 (8,8) (median, IQR) |
| Apgar 5 min | 9 (9,9) (median, IQR) |
| Nulliparity | 140 (50 %) |
| Multiparity | 140 (50 %) |
| Ethnicity | |
| –Thai | 276 (99 %) |
| –Laotian | 4 (1 %) |
-
SD, standard deviation; IQR, interquartile range.
Percentile for tricuspid annular plane systolic excursion (TAPSE) (millimeters) by gestation age (GA).
| GA, weeks | n | Percentile | ||||||||||
|---|---|---|---|---|---|---|---|---|---|---|---|---|
| 1 | 2.5 | 5 | 10 | 25 | 50 | 75 | 90 | 95 | 97.5 | 99 | ||
| 18 | 14 | 2.29 | 2.36 | 2.60 | 3.19 | 3.58 | 3.76 | 4.29 | 5.44 | 5.37 | 5.85 | 5.81 |
| 19 | 14 | 2.55 | 2.67 | 2.92 | 3.48 | 3.89 | 4.16 | 4.72 | 5.85 | 5.84 | 6.30 | 6.32 |
| 20 | 14 | 2.80 | 2.96 | 3.22 | 3.75 | 4.19 | 4.54 | 5.13 | 6.23 | 6.28 | 6.73 | 6.81 |
| 21 | 14 | 3.04 | 3.24 | 3.51 | 4.01 | 4.47 | 4.90 | 5.52 | 6.60 | 6.71 | 7.13 | 7.27 |
| 22 | 14 | 3.27 | 3.51 | 3.78 | 4.26 | 4.74 | 5.24 | 5.90 | 6.95 | 7.12 | 7.52 | 7.71 |
| 23 | 14 | 3.49 | 3.76 | 4.04 | 4.49 | 5.00 | 5.57 | 6.25 | 7.28 | 7.50 | 7.89 | 8.14 |
| 24 | 14 | 3.70 | 4.01 | 4.29 | 4.72 | 5.25 | 5.89 | 6.60 | 7.60 | 7.87 | 8.25 | 8.54 |
| 25 | 14 | 3.89 | 4.24 | 4.53 | 4.93 | 5.48 | 6.19 | 6.92 | 7.91 | 8.23 | 8.59 | 8.93 |
| 26 | 14 | 4.09 | 4.47 | 4.76 | 5.14 | 5.71 | 6.48 | 7.24 | 8.20 | 8.57 | 8.92 | 9.30 |
| 27 | 14 | 4.27 | 4.68 | 4.98 | 5.34 | 5.93 | 6.75 | 7.54 | 8.49 | 8.90 | 9.23 | 9.66 |
| 28 | 14 | 4.45 | 4.89 | 5.19 | 5.53 | 6.14 | 7.02 | 7.83 | 8.76 | 9.22 | 9.53 | 10.00 |
| 29 | 14 | 4.62 | 5.09 | 5.40 | 5.72 | 6.34 | 7.28 | 8.11 | 9.02 | 9.52 | 9.83 | 10.34 |
| 30 | 14 | 4.79 | 5.28 | 5.60 | 5.90 | 6.54 | 7.53 | 8.39 | 9.28 | 9.82 | 10.11 | 10.66 |
| 31 | 14 | 4.95 | 5.47 | 5.79 | 6.07 | 6.73 | 7.77 | 8.65 | 9.53 | 10.10 | 10.38 | 10.97 |
| 32 | 14 | 5.10 | 5.65 | 5.97 | 6.24 | 6.91 | 8.01 | 8.90 | 9.76 | 10.38 | 10.65 | 11.27 |
| 33 | 14 | 5.25 | 5.83 | 6.16 | 6.41 | 7.09 | 8.24 | 9.15 | 10.00 | 10.65 | 10.90 | 11.57 |
| 34 | 14 | 5.40 | 6.00 | 6.33 | 6.56 | 7.26 | 8.46 | 9.39 | 10.22 | 10.91 | 11.15 | 11.85 |
| 35 | 14 | 5.54 | 6.17 | 6.50 | 6.72 | 7.43 | 8.70 | 9.62 | 10.44 | 11.16 | 11.40 | 12.12 |
| 36 | 14 | 5.68 | 6.33 | 6.66 | 6.87 | 7.59 | 8.88 | 9.85 | 10.65 | 11.41 | 11.63 | 12.39 |
| 37 | 14 | 5.81 | 6.48 | 6.83 | 7.01 | 7.75 | 9.08 | 10.07 | 10.86 | 11.65 | 11.86 | 12.65 |
Percentile of tricuspid annular plane systolic excursion (TAPSE) (millimeters) by estimated fetal weight (EFW).
| EFW, grams | n | Percentile | ||||||||||
|---|---|---|---|---|---|---|---|---|---|---|---|---|
| 1 | 2.5 | 5 | 10 | 25 | 50 | 75 | 90 | 95 | 97.5 | 99 | ||
| 200–399 | 46 | 2.17 | 2.28 | 2.29 | 2.79 | 3.12 | 3.42 | 3.93 | 4.49 | 4.92 | 5.37 | 5.38 |
| 400–599 | 34 | 3.02 | 3.30 | 3.36 | 3.83 | 4.28 | 4.83 | 5.45 | 6.12 | 6.55 | 7.03 | 7.10 |
| 600–799 | 26 | 3.51 | 3.90 | 3.99 | 4.43 | 4.96 | 5.65 | 6.34 | 7.08 | 7.51 | 8.00 | 8.11 |
| 800–999 | 20 | 3.87 | 4.32 | 4.44 | 4.87 | 5.44 | 6.24 | 6.97 | 7.75 | 8.19 | 8.69 | 8.83 |
| 1,000–1,199 | 15 | 4.14 | 4.65 | 4.78 | 5.20 | 5.81 | 6.69 | 7.46 | 8.28 | 8.72 | 9.22 | 9.38 |
| 1,200–1,399 | 18 | 4.36 | 4.92 | 5.06 | 5.48 | 6.12 | 7.06 | 7.86 | 8.71 | 9.15 | 9.66 | 9.83 |
| 1,400–1,599 | 22 | 4.55 | 5.15 | 5.30 | 5.71 | 6.38 | 7.38 | 8.20 | 9.07 | 9.51 | 10.03 | 10.22 |
| 1,600–1,799 | 12 | 4.71 | 5.34 | 5.51 | 5.91 | 6.60 | 7.65 | 8.49 | 9.38 | 9.83 | 10.35 | 10.55 |
| 1,800–1,999 | 9 | 4.86 | 5.52 | 5.69 | 6.08 | 6.80 | 7.89 | 8.75 | 9.66 | 10.10 | 10.63 | 10.84 |
| 2,000–2,199 | 12 | 4.99 | 5.67 | 5.85 | 6.24 | 6.98 | 8.10 | 8.98 | 9.91 | 10.35 | 10.88 | 11.11 |
| 2,200–2,399 | 18 | 5.10 | 5.81 | 6.00 | 6.38 | 7.13 | 8.30 | 9.19 | 10.13 | 10.58 | 11.11 | 11.34 |
| 2,400–2,599 | 14 | 5.21 | 5.94 | 6.14 | 6.52 | 7.28 | 8.47 | 9.38 | 10.34 | 10.78 | 11.32 | 11.56 |
| 2,600–2,799 | 13 | 5.31 | 6.06 | 6.26 | 6.64 | 7.41 | 8.64 | 9.55 | 10.53 | 10.97 | 11.51 | 11.76 |
| 2,800–2,999 | 9 | 5.40 | 6.17 | 6.37 | 6.75 | 7.54 | 8.79 | 9.71 | 10.70 | 11.15 | 11.69 | 11.94 |
| 3,000–3,199 | 8 | 5.48 | 6.27 | 6.48 | 6.85 | 7.65 | 8.93 | 9.86 | 10.86 | 11.31 | 11.85 | 12.11 |
| 3,200–3,399 | 2 | 5.56 | 6.37 | 6.58 | 6.95 | 7.76 | 9.06 | 10.01 | 11.01 | 11.46 | 12.01 | 12.27 |
| 3,400–3,599 | 2 | 5.64 | 6.45 | 6.67 | 7.04 | 7.86 | 9.18 | 10.14 | 11.16 | 11.61 | 12.15 | 12.43 |
| ≥3,600 | 0 | 5.71 | 6.54 | 6.76 | 7.12 | 7.96 | 9.30 | 10.26 | 11.29 | 11.74 | 12.29 | 12.57 |
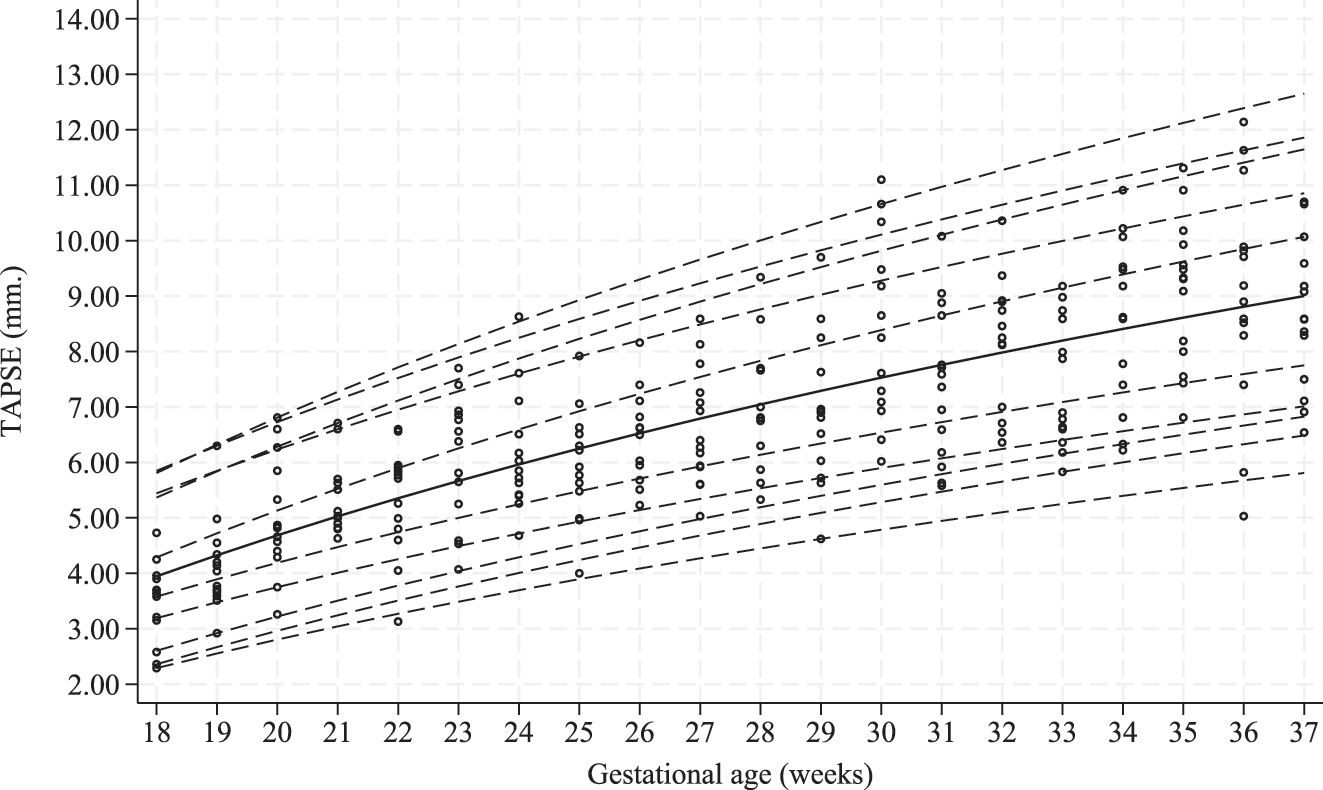
Scatterplots of tricuspid annular plane systolic excursion (TAPSE) based on gestational age (GA) in the study population. Estimated 1st, 2.5th, 5th, 10th, 25th, 50th, 50th, 75th, 90th, 95th, 97.5th, and 99th percentiles curves are shown.
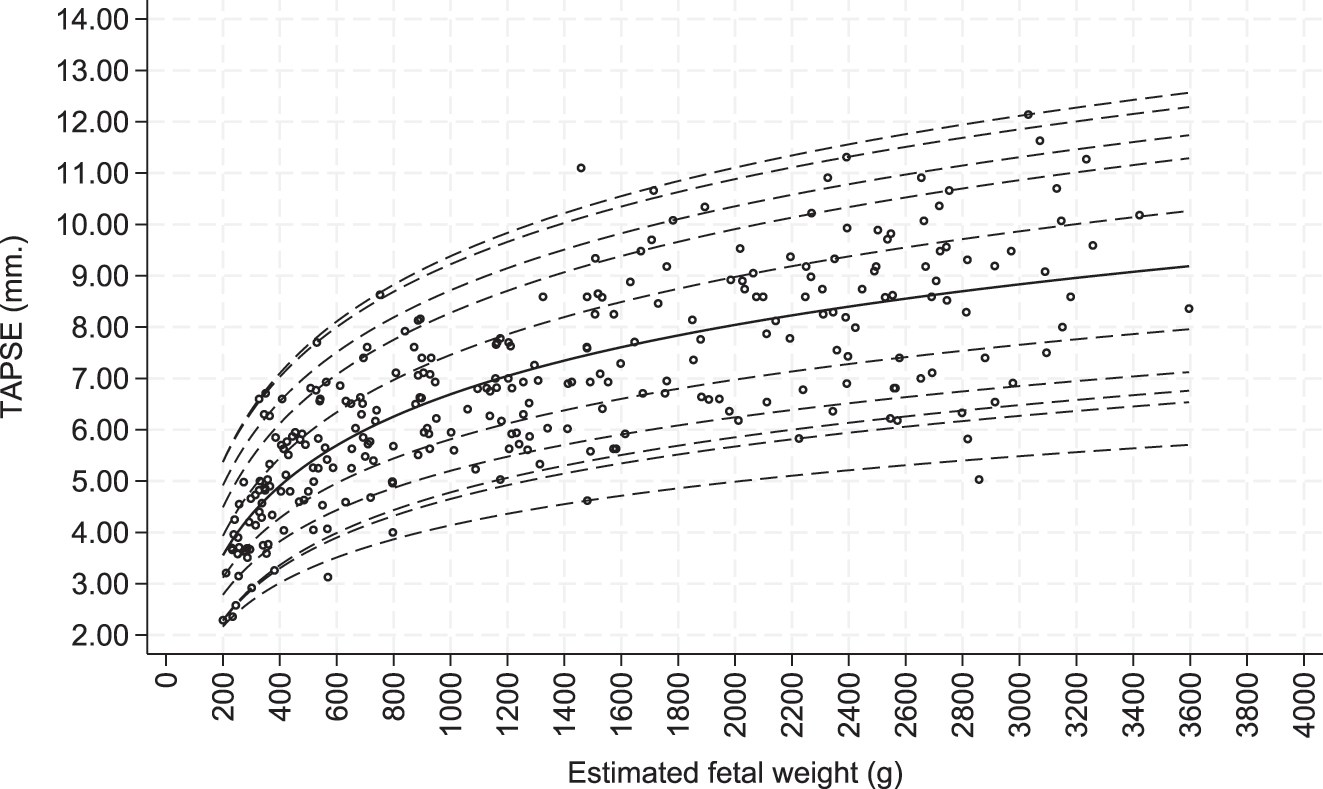
Scatterplots of tricuspid annular plane systolic excursion (TAPSE) based on estimated fetal weight (EFW) in the study population. Estimated 1st, 2.5th, 5th, 10th, 25th, 50th, 50th, 75th, 90th, 95th, 97.5th, and 99th percentiles curves are shown.
Percentile of mitral annular plane systolic excursion (MAPSE) (millimeters) by gestational age (GA).
| GA, weeks | n | Percentile | ||||||||||
|---|---|---|---|---|---|---|---|---|---|---|---|---|
| 1 | 2.5 | 5 | 10 | 25 | 50 | 75 | 90 | 95 | 97.5 | 99 | ||
| 18 | 14 | 1.34 | 1.98 | 1.95 | 2.16 | 2.54 | 3.10 | 3.38 | 3.87 | 4.09 | 4.39 | 4.50 |
| 19 | 14 | 1.56 | 2.15 | 2.15 | 2.37 | 2.77 | 3.34 | 3.67 | 4.21 | 4.46 | 4.81 | 4.92 |
| 20 | 14 | 1.76 | 2.31 | 2.34 | 2.57 | 2.99 | 3.57 | 3.95 | 4.54 | 4.81 | 5.20 | 5.33 |
| 21 | 14 | 1.96 | 2.46 | 2.52 | 2.76 | 3.20 | 3.79 | 4.22 | 4.85 | 5.15 | 5.58 | 5.71 |
| 22 | 14 | 2.14 | 2.61 | 2.69 | 2.94 | 3.40 | 4.00 | 4.47 | 5.15 | 5.47 | 5.94 | 6.07 |
| 23 | 14 | 2.32 | 2.75 | 2.86 | 3.11 | 3.59 | 4.20 | 4.71 | 5.43 | 5.77 | 6.28 | 6.42 |
| 24 | 14 | 2.49 | 2.88 | 3.02 | 3.28 | 3.77 | 4.39 | 4.94 | 5.70 | 6.06 | 6.61 | 6.75 |
| 25 | 14 | 2.65 | 3.01 | 3.17 | 3.43 | 3.95 | 4.58 | 5.17 | 5.96 | 6.34 | 6.93 | 7.07 |
| 26 | 14 | 2.81 | 3.13 | 3.31 | 3.59 | 4.12 | 4.76 | 5.38 | 6.21 | 6.61 | 7.23 | 7.38 |
| 27 | 14 | 2.96 | 3.25 | 3.45 | 3.73 | 4.28 | 4.93 | 5.59 | 6.45 | 6.87 | 7.52 | 7.67 |
| 28 | 14 | 3.10 | 3.36 | 3.59 | 3.87 | 4.43 | 5.09 | 5.78 | 6.68 | 7.12 | 7.80 | 7.96 |
| 29 | 14 | 3.24 | 3.47 | 3.72 | 4.01 | 4.58 | 5.25 | 5.97 | 6.91 | 7.36 | 8.08 | 8.23 |
| 30 | 14 | 3.38 | 3.58 | 3.84 | 4.14 | 4.73 | 5.40 | 6.16 | 7.12 | 7.59 | 8.34 | 8.50 |
| 31 | 14 | 3.51 | 3.68 | 3.96 | 4.27 | 4.87 | 5.55 | 6.34 | 7.33 | 7.82 | 8.59 | 8.76 |
| 32 | 14 | 3.64 | 3.78 | 4.08 | 4.39 | 5.01 | 5.69 | 6.51 | 7.53 | 8.03 | 8.84 | 9.01 |
| 33 | 14 | 3.76 | 3.88 | 4.20 | 4.51 | 5.14 | 5.83 | 6.68 | 7.73 | 8.24 | 9.08 | 9.25 |
| 34 | 14 | 3.88 | 3.97 | 4.31 | 4.63 | 5.27 | 5.96 | 6.84 | 7.92 | 8.45 | 9.31 | 9.48 |
| 35 | 14 | 3.99 | 4.06 | 4.41 | 4.74 | 5.39 | 6.09 | 7.00 | 8.10 | 8.65 | 9.53 | 9.71 |
| 36 | 14 | 4.11 | 4.15 | 4.52 | 4.85 | 5.51 | 6.22 | 7.15 | 8.28 | 8.84 | 9.75 | 9.93 |
| 37 | 14 | 4.22 | 4.24 | 4.62 | 4.96 | 5.63 | 6.34 | 7.30 | 8.46 | 9.03 | 9.96 | 10.14 |
Percentile of mitral annular plane systolic excursion (MAPSE) (millimeters) estimated fetal weight (EFW).
| EFW, grams | n | Percentile | ||||||||||
|---|---|---|---|---|---|---|---|---|---|---|---|---|
| 1 | 2.5 | 5 | 10 | 25 | 50 | 75 | 90 | 95 | 97.5 | 99 | ||
| 200–399 | 46 | 1.49 | 1.75 | 1.76 | 1.87 | 2.23 | 2.71 | 3.05 | 3.30 | 3.65 | 3.88 | 4.19 |
| 400–599 | 34 | 2.16 | 2.36 | 2.48 | 2.65 | 3.10 | 3.64 | 4.15 | 4.56 | 4.95 | 5.38 | 5.70 |
| 600–799 | 26 | 2.55 | 2.72 | 2.91 | 3.11 | 3.61 | 4.19 | 4.79 | 5.30 | 5.71 | 6.26 | 6.57 |
| 800–999 | 20 | 2.82 | 2.97 | 3.21 | 3.43 | 3.98 | 4.57 | 5.25 | 5.82 | 6.24 | 6.88 | 7.19 |
| 1,000–1,199 | 15 | 3.04 | 3.17 | 3.44 | 3.68 | 4.26 | 4.87 | 5.60 | 6.23 | 6.66 | 7.36 | 7.68 |
| 1,200–1,399 | 18 | 3.22 | 3.33 | 3.63 | 3.89 | 4.49 | 5.12 | 5.89 | 6.56 | 7.00 | 7.76 | 8.07 |
| 1,400–1,599 | 22 | 3.36 | 3.47 | 3.79 | 4.06 | 4.68 | 5.33 | 6.14 | 6.84 | 7.29 | 8.09 | 8.40 |
| 1,600–1,799 | 12 | 3.49 | 3.58 | 3.93 | 4.21 | 4.85 | 5.51 | 6.35 | 7.08 | 7.54 | 8.38 | 8.69 |
| 1,800–1,999 | 9 | 3.61 | 3.69 | 4.05 | 4.34 | 5.00 | 5.67 | 6.53 | 7.30 | 7.76 | 8.63 | 8.95 |
| 2,000–2,199 | 12 | 3.71 | 3.78 | 4.16 | 4.46 | 5.13 | 5.81 | 6.70 | 7.49 | 7.96 | 8.86 | 9.17 |
| 2,200–2,399 | 18 | 3.80 | 3.86 | 4.26 | 4.57 | 5.25 | 5.94 | 6.85 | 7.66 | 8.14 | 9.07 | 9.38 |
| 2,400–2,599 | 14 | 3.88 | 3.94 | 4.35 | 4.67 | 5.36 | 6.05 | 6.99 | 7.82 | 8.30 | 9.25 | 9.57 |
| 2,600–2,799 | 13 | 3.96 | 4.01 | 4.44 | 4.76 | 5.46 | 6.16 | 7.12 | 7.96 | 8.45 | 9.43 | 9.74 |
| 2,800–2,999 | 9 | 4.03 | 4.07 | 4.51 | 4.84 | 5.55 | 6.26 | 7.24 | 8.10 | 8.59 | 9.59 | 9.90 |
| 3,000–3,199 | 8 | 4.10 | 4.14 | 4.59 | 4.92 | 5.64 | 6.35 | 7.35 | 8.22 | 8.72 | 9.74 | 10.05 |
| 3,200–3,399 | 2 | 4.16 | 4.19 | 4.65 | 4.99 | 5.72 | 6.44 | 7.45 | 8.34 | 8.84 | 9.88 | 10.19 |
| 3,400–3,599 | 2 | 4.22 | 4.25 | 4.72 | 5.06 | 5.80 | 6.52 | 7.54 | 8.45 | 8.95 | 10.01 | 10.32 |
| ≥3,600 | 0 | 4.27 | 4.30 | 4.78 | 5.12 | 5.87 | 6.60 | 7.63 | 8.55 | 9.06 | 10.13 | 10.44 |
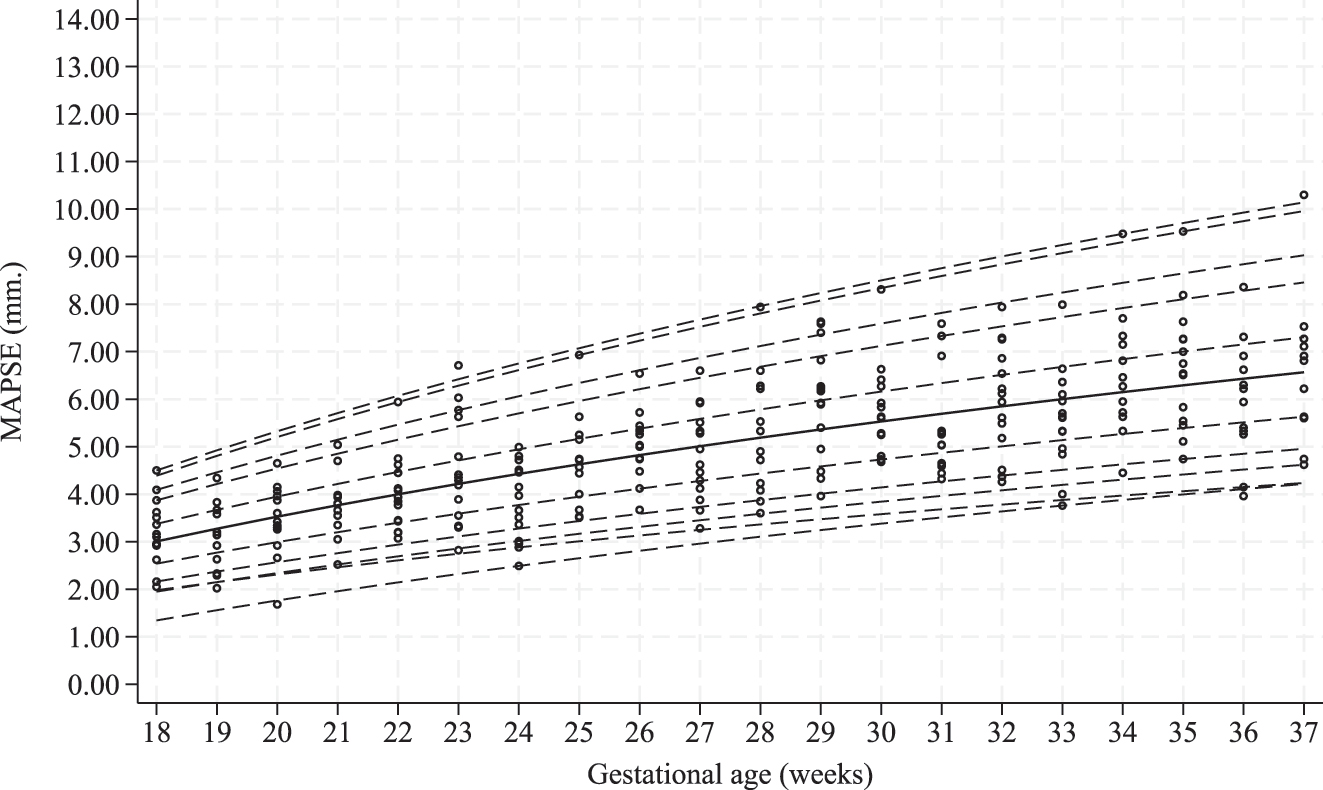
Scatterplots of mitral annular plane systolic excursion (MAPSE) based on gestational age (GA) in the study population. Estimated 1st, 2.5th, 5th, 10th, 25th, 50th, 50th, 75th, 90th, 95th, 97.5th, and 99th percentiles curves are shown.
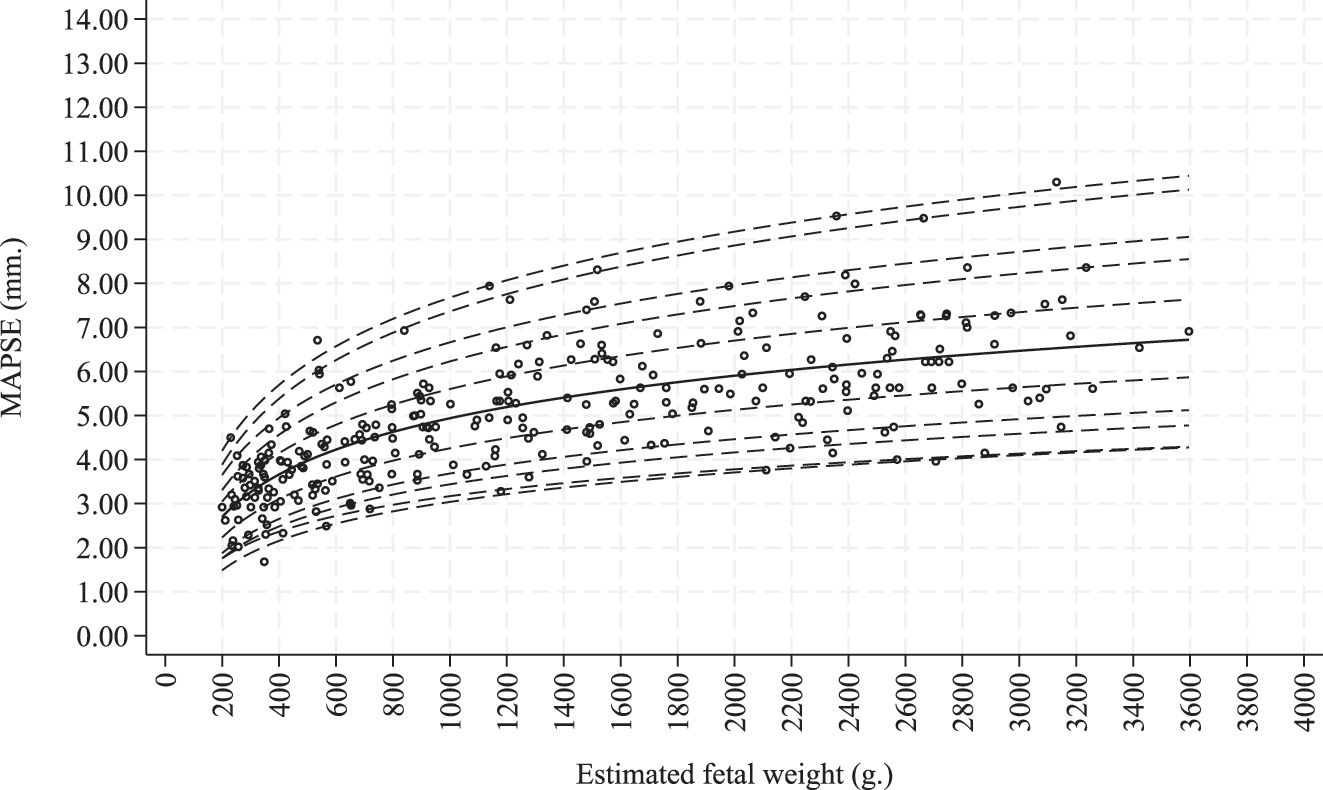
Scatterplots of mitral annular plane systolic excursion (MAPSE) based on estimated fetal weight (EFW) in the study population. Estimated 1st, 2.5th, 5th, 10th, 25th, 50th, 50th, 75th, 90th, 95th, 97.5th, and 99th percentiles curves are shown.
The ICC between the two sonographers (i.e., J.K. and R.K.) for TAPSE was 0.94 (95 % CI 0.77–0.99) and 0.91 (95 % CI 0.65–0.98) for MAPSE. The ICC for two repeat measurements by J.K. was 0.91 (95 % CI, 0.74–0.97) for TAPSE and 0.88 (95 % CI, 0.65–0.96) for MAPSE. The Bland-Altman plots demonstrate the mean difference of repeated measurement by the same examiner (intra-observer) for TAPSE and MAPSE, which are 0.12 ± 0.65 mm and −0.12 ± 0.53 mm, respectively Figures 6 and 7. The mean difference between two examiners (inter-observer) for TAPSE and MAPSE were −0.03 ± 0.60 mm and 0.28 ± 0.70 mm, respectively, Figures 8 and 9.
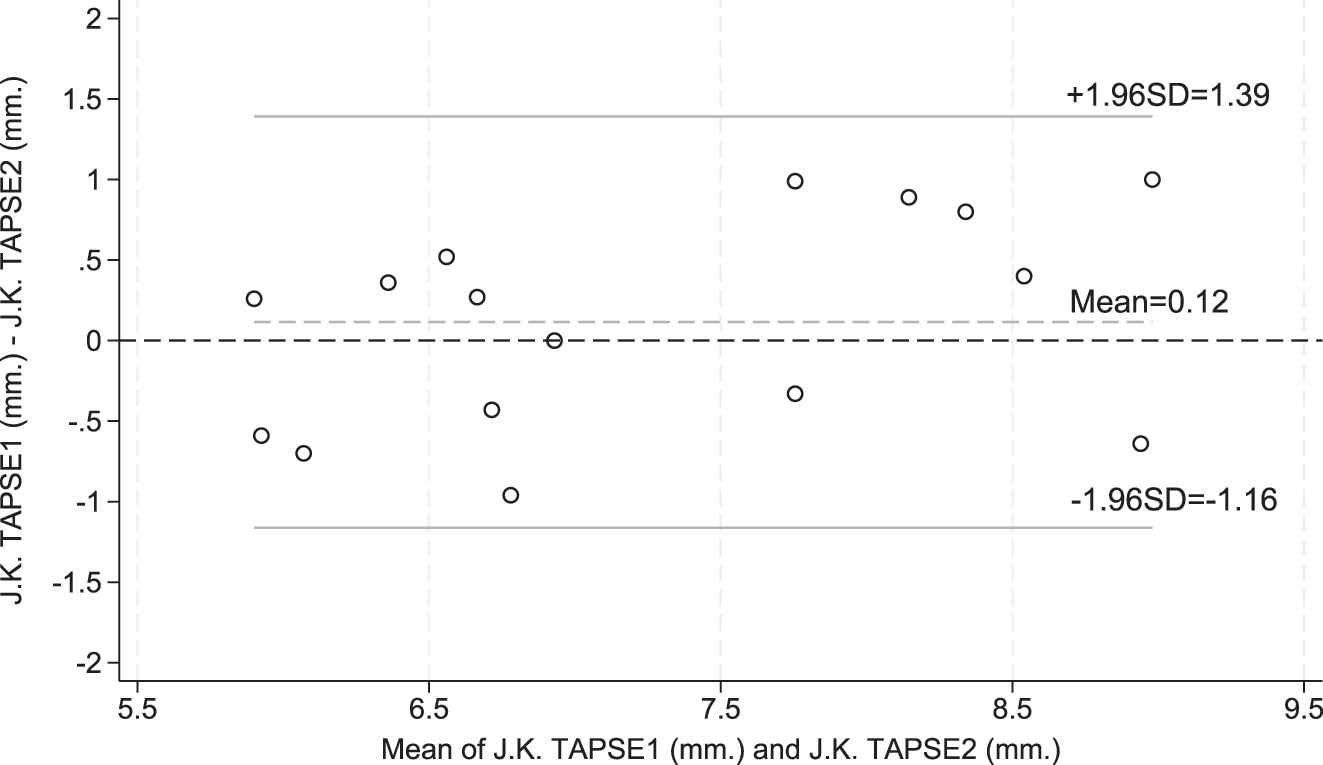
Bland–Altman plot demonstrating intra-observer agreement of tricuspid annular plane systolic excursion (TAPSE) measurements.
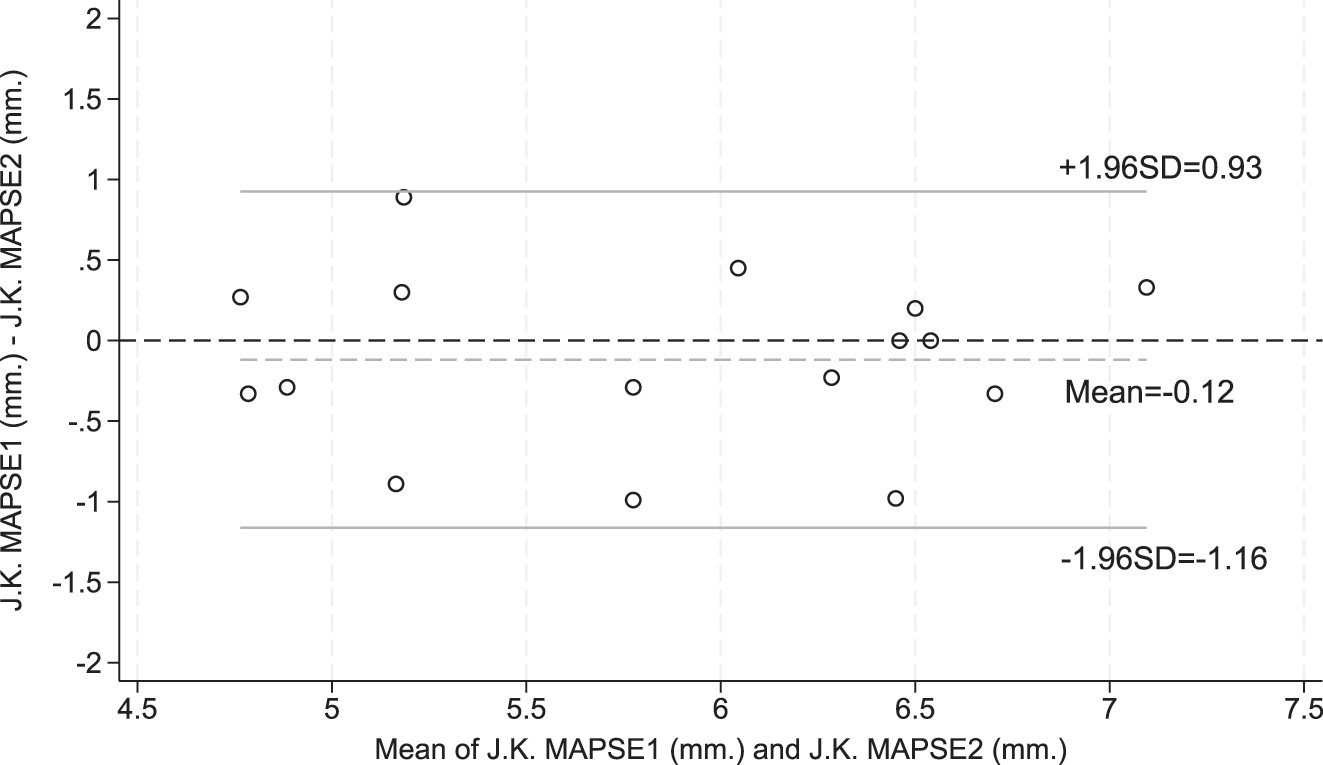
Bland–Altman plot demonstrating intra-observer agreement of mitral annular plane systolic excursion (MAPSE) measurements.
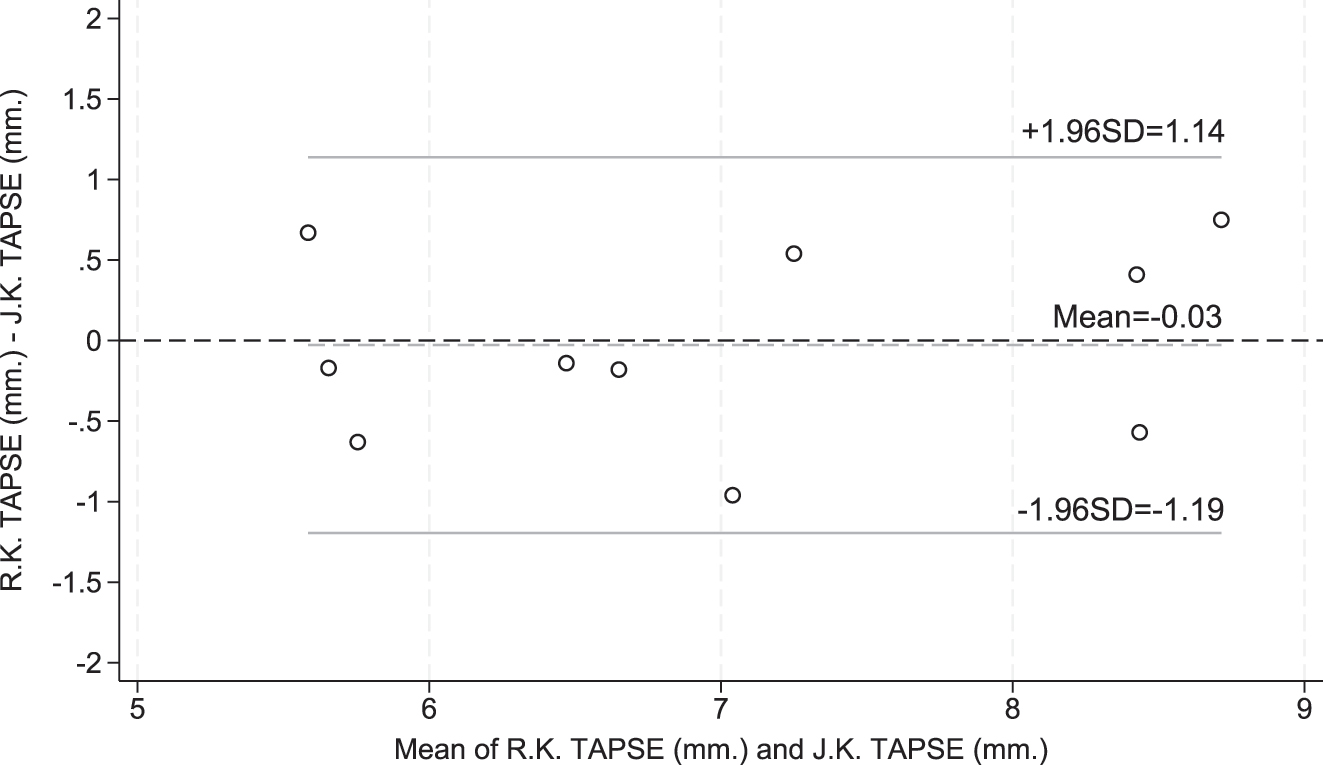
Bland–Altman plot demonstrating inter-observer agreement of tricuspid annular plane systolic excursion (TAPSE) measurements.
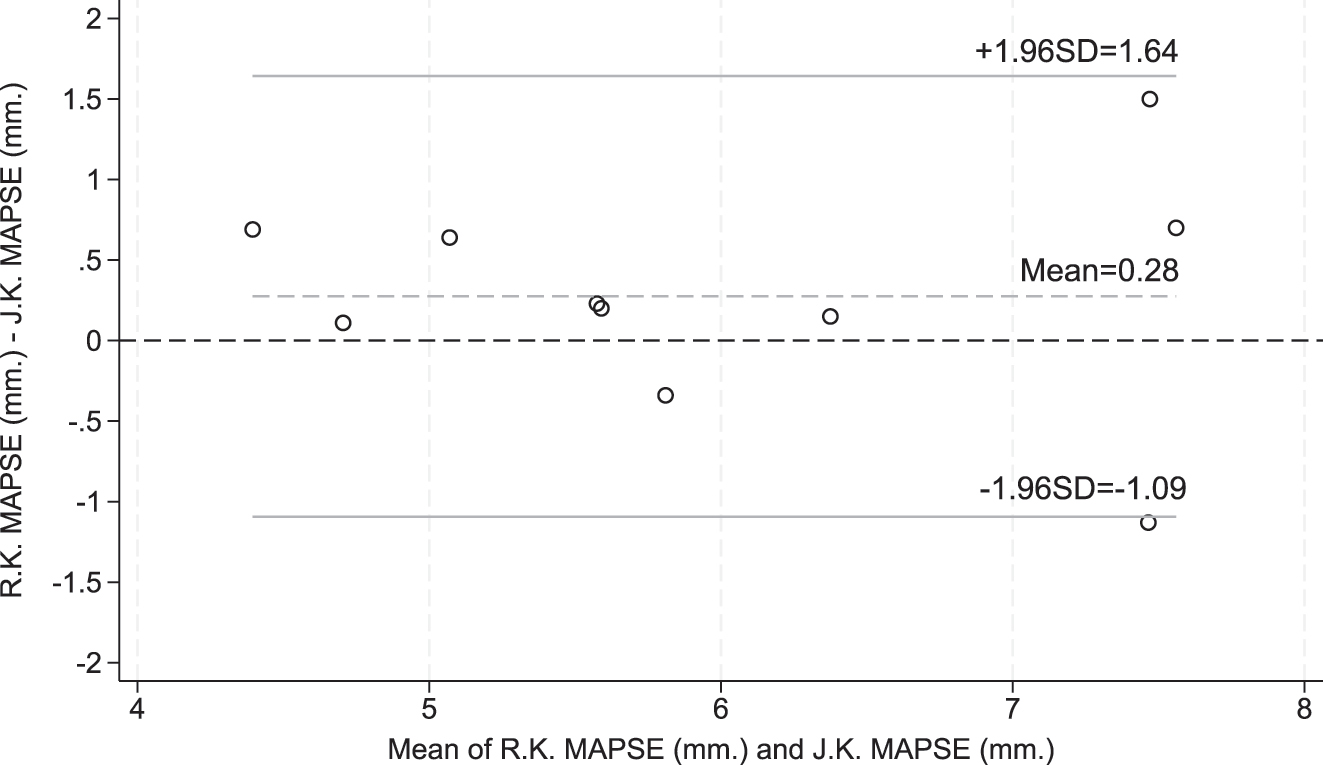
Bland–Altman plot demonstrating inter-observer agreement of mitral annular plane systolic excursion (MAPSE) measurements.
Discussion
Several studies have established normal reference values for fetal TAPSE and MAPSE in various populations, including Israel, China, Australia, and Brazil [18], [19], [20], [21]. The reference values at corresponding gestational ages vary across these studies, suggesting that population-specific differences may influence these parameters. Currently, no studies have investigated these parameters in Southeast Asian populations. This study established normal reference ranges for TAPSE and MAPSE in fetuses between 18 + 0 and 37 + 6 weeks’ GA. TAPSE and MAPSE progressively increased with advancing GA and EFW, exhibiting a logarithmic correlation. Our results are similar to those reported by Herling et al. [22].
However, previous studies reported a linear correlation, which differed slightly from our findings. These differences may be attributed to our study’s earlier GA range [19], [20], [21] and larger sample size compared with previous studies [18], 20]. Several studies evaluating TAPSE in healthy pediatric populations have demonstrated a positive correlation between TAPSE values and increasing weight and body surface area [11], [12], [13], consistent with our findings of a positive correlation between TAPSE and MAPSE with EFW.
TAPSE consistently exceeded MAPSE throughout gestation, reflecting a higher fetal cardiac output from the right ventricle than that from the left ventricle. This suggests that fetal right ventricular compliance was greater than left ventricular compliance [23]. These findings are consistent with those from previous studies [18], [19], [20], [21], [22]. Using TAPSE and MAPSE based solely on GA may not be appropriate, particularly in conditions such as FGR, in which fetal weight does not correspond to GA. EFW-based assessment provides a more accurate evaluation of fetal cardiac function. Our study provides percentile tables for TAPSE and MAPSE correlated with EFW, which may be clinically useful for fetuses diagnosed with these specific conditions.
TAPSE and MAPSE are widely used in various clinical contexts to evaluate fetal cardiac function. Several studies have assessed TAPSE and MAPSE under specific pathological conditions, including fetal anemia. Pre-intrauterine blood transfusion (IUT) measurements revealed annular plane systolic excursion values above the normal reference range, significantly decreasing post-IUT [2]. Similarly, a study involving 11 cases of placental tumors found that 8 of 11 fetuses exhibited TAPSE values above the normal reference range [1]. These findings suggest that the annular plane systolic excursion values in high cardiac output states tend to exceed the normal reference range.
Conversely, studies focusing on fetal heart failure have demonstrated significantly lower TAPSE, MAPSE, and myocardial performance index values than those of normal fetuses, often falling >2 standard deviations below the mean [24]. Furthermore, in fetuses with FGR, TAPSE values are significantly lower than those in normal fetuses [3]. Additional research investigating maternal preeclampsia has revealed a decrease in fetal TAPSE [25]. In TTTS, donor and recipient twins exhibit TAPSE values that are lower than those of the normal reference range [4], 5]. These findings underscore the clinical utility of TAPSE and MAPSE for assessing fetal systolic function under various conditions. Consequently, establishing robust reference ranges is crucial for the accurate diagnosis and effective monitoring of fetal systolic cardiac function.
To the best of our knowledge, our study represents the largest dataset of normal reference ranges in a Southeast Asian population. Data collection began at 18 weeks’ GA, earlier than in previous studies [19], [20], [21]. Establishing a reference for early GAs has significant advantages in the early detection of fetal cardiac dysfunction, which may benefit the early management of conditions, such as TTTS [4], 5] and early FGR [3], 26].
Currently, various methods are available to assess fetal cardiac function, including M-mode for TAPSE, MAPSE, and shortening fraction; and B-mode and pulse-wave Doppler (PWD) for stroke volume, cardiac output, and myocardial performance index. Despite these options, no standardized method for fetal cardiac assessment has been established [6]. Our study specifically focused on the annular plane systolic excursion using the M-mode due to its simplicity, ease of measurement and interpretation, and availability on all ultrasound devices. Additionally, it does not require advanced ultrasonography skills, making it a practical and sensitive tool for detecting cardiac dysfunction. Our study provided an ICC for inter-observer variability, indicating that the measurement method was reproducible.
A key consideration when using conventional M-mode is that the M-mode cursor must be parallel to the interventricular septum. Deviations from this alignment increase measurement errors. Previous studies comparing conventional M-mode to angular M-mode have shown that TAPSE and MAPSE values remain nearly identical when the cursor-interventricular septum angle is maintained <30° [19]. Our study optimized accuracy by maintaining an insonation angle <15°, which provides a reliable reference range.
Strengths and limitations
Strengths of this study are the largest prospective cross-sectional assessment and a good intraclass correlation coefficient of TAPSE and MAPSE in normally developing fetuses among pregnant women in Southeast Asia. Additionally, data collection as early as 18 weeks’ GA enabled early detection of fetal cardiac dysfunction. All participants were followed-up postpartum to ensure that their newborns had normal birth weights and no abnormalities on physical examination. However, this study had some limitations, the first of which were its single-center design including only a Southeast Asian population without postnatal fetal echocardiography for confirmation. Further research involving more ethnically diverse populations is required to establish robust reference values that can be widely applied to various ethnic groups. And, external validation of our reference using standardized tools within our population is necessary to confirm applicability and reliability.
Conclusions
In summary, the present investigation established normal reference ranges for TAPSE and MAPSE to assess fetal systolic cardiac function. TAPSE and MAPSE increased with advancing GA and fetal weight. These parameters are simple, easy to use, and convenient for evaluating ventricular systolic function. They can be used to assess fetal cardiac function in conditions such as FGR, congenital cardiac anomalies, fetal and placental tumors, fetal anemia, and TTTS.
Funding source: Khon Kaen University
Acknowledgments
The authors thank the patients for their participation and the staff at Srinagarind Hospital for their assistance.
-
Research ethics: The study was approved by the Khon Kaen University Ethics Committee for Human Research (Reference number HE661527) and was conducted in accordance with the Declaration of Helsinki (as revised in 2013) and the International Council for Harmonization Good Clinical Practice Guidelines.
-
Informed consent: Informed consent was obtained from all individuals included in this study.
-
Author contributions: All authors have accepted responsibility for the entire content of this manuscript and approved its submission. J.K. and R.K. conceptualized the study, collected and analyzed the data, validated the findings, and wrote the original draft. P.S., K.K., S.C., C.D., and T.W. contributed to data collection.
-
Use of Large Language Models, AI and Machine Learning Tools: None declared.
-
Conflict of interest: The authors state no conflict of interest.
-
Research funding: The medical equipment used in this study was provided by the Faculty of Medicine, Khon Kaen University.
-
Data availability: The datasets generated and analyzed during the current study are available from the corresponding author on reasonable request.
References
1. Perlman, S, Messing, B, Salem, Y, Porat, S, Achiron, R, Gilboa, Y. The added value of f-TAPSE in the surveillance of pregnancies complicated by fetal and placental tumors. Prenat Diagn 2017;37:788–92. https://doi.org/10.1002/pd.5087.Search in Google Scholar PubMed
2. Zamprakou, A, Söderhult, I, Ferm-Widlund, K, Ajne, G, Johnson, J, Herling, L. Automated quantitative evaluation of fetal atrioventricular annular plane systolic excursion before and after intrauterine blood transfusion in pregnancies affected by red blood cell alloimmunization. Acta Obstet Gynecol Scand 2024;103:313–21. https://doi.org/10.1111/aogs.14722.Search in Google Scholar PubMed PubMed Central
3. Turkyilmaz, G, Turkyilmaz, S, Uygur, L. Fetal cardiac alterations in the late-onset growth-restricted fetuses: a prospective case–control study. J Obstet Gynaecol Res 2022;48:373–8. https://doi.org/10.1111/jog.15114.Search in Google Scholar PubMed
4. Torres, X, Bennasar, M, Bautista-Rodríguez, C, Martínez-Portilla, RJ, Gómez, O, Micheletti, T, et al.. The heart after surviving twin-to-twin transfusion syndrome. Am J Obstet Gynecol 2022;227:502.e1–25. https://doi.org/10.1016/j.ajog.2022.03.049.Search in Google Scholar PubMed
5. Ortiz, JU, Crispi, F, Yamamoto, R, Masoller, N, Cruz-Lemini, M, Gómez, O, et al.. Longitudinal annular displacement by M-mode (MAPSE and TAPSE) in twin-to-twin transfusion syndrome before and after laser surgery. Prenat Diagn 2015;35:1197–201. https://doi.org/10.1002/pd.4671.Search in Google Scholar PubMed
6. Nakata, M, Sakuma, J, Takano, M, Nagasaki, S. Assessment of fetal cardiac function with echocardiography. J Obstet Gynaecol Res 2020;46:31–8. https://doi.org/10.1111/jog.14143.Search in Google Scholar PubMed
7. Vasciaveo, L, Zanzarelli, E, D’Antonio, F. Fetal cardiac function evaluation: a review. J Clin Ultrasound 2023;51:215–24. https://doi.org/10.1002/jcu.23421.Search in Google Scholar PubMed
8. Lang, RM, Badano, LP, Mor-Avi, V, Afilalo, J, Armstrong, A, Ernande, L, et al.. Recommendations for cardiac chamber quantification by echocardiography in adults: an update from the American Society of Echocardiography and the European Association of Cardiovascular Imaging. J Am Soc Echocardiogr 2015;28:1–39.e14. https://doi.org/10.1016/j.echo.2014.10.003.Search in Google Scholar PubMed
9. Dutta, T, Aronow, WS. Echocardiographic evaluation of the right ventricle: clinical implications. Clin Cardiol 2017;40:542–8. https://doi.org/10.1002/clc.22694.Search in Google Scholar PubMed PubMed Central
10. Aloia, E, Cameli, M, D’Ascenzi, F, Sciaccaluga, C, Mondillo, S. TAPSE: an old but useful tool in different diseases. Int J Cardiol 2016;225:177–83. https://doi.org/10.1016/j.ijcard.2016.10.009.Search in Google Scholar PubMed
11. Keskin, M, Kaya, Ö, Yoldaş, T, Karademir, S, Örün, UA, Özgür, S, et al.. Tricuspid annular plane systolic excursion and mitral annular plane systolic excursion cardiac reference values in 1300 healthy children: single-center results. Echocardiography 2020;37:1251–7. https://doi.org/10.1111/echo.14793.Search in Google Scholar PubMed
12. Koestenberger, M, Ravekes, W, Everett, AD, Stueger, HP, Heinzl, B, Gamillscheg, A, et al.. Right ventricular function in infants, children and adolescents: reference values of the tricuspid annular plane systolic excursion (TAPSE) in 640 healthy patients and calculation of z score values. J Am Soc Echocardiogr 2009;22:715–9. https://doi.org/10.1016/j.echo.2009.03.026.Search in Google Scholar PubMed
13. Kurath-Koller, S, Avian, A, Cantinotti, M, Burmas, A, Grangl, G, Schweintzger, S, et al.. Normal pediatric values of the subcostal tricuspid annular plane systolic excursion (S-TAPSE) and its value in pediatric pulmonary hypertension. Can J Cardiol 2019;35:899–906. https://doi.org/10.1016/j.cjca.2019.01.019.Search in Google Scholar PubMed
14. Chen, D, Guo, J, Liu, B, Zheng, C, Huang, G, Huang, L, et al.. Reference values and the Z-score values of tricuspid annular plane systolic excursion in Chinese children. Int J Cardiovasc Imag 2022;38:2117–25. https://doi.org/10.1007/s10554-022-02624-w.Search in Google Scholar PubMed
15. Lees, CC, Stampalija, T, Baschat, A, da Silva Costa, F, Ferrazzi, E, Figueras, F, et al.. ISUOG Practice Guidelines: diagnosis and management of small-for-gestational-age fetus and fetal growth restriction. Ultrasound Obstet Gynecol 2020;56:298–312. https://doi.org/10.1002/uog.22134.Search in Google Scholar PubMed
16. Salomon, LJ, Alfirevic, Z, Berghella, V, Bilardo, CM, Chalouhi, GE, Da Silva Costa, F, et al.. ISUOG Practice Guidelines (updated): performance of the routine mid-trimester fetal ultrasound scan. Ultrasound Obstet Gynecol 2022;59:840–56. https://doi.org/10.1002/uog.24888.Search in Google Scholar PubMed
17. Hadlock, FP, Harrist, RB, Sharman, RS, Deter, RL, Park, SK. Estimation of fetal weight with the use of head, body, and femur measurements – a prospective study. Am J Obstet Gynecol 1985;151:333–7. https://doi.org/10.1016/0002-9378(85)90298-4.Search in Google Scholar PubMed
18. Lee-Tannock, A, Hay, K, Gooi, A, Kumar, S. Longitudinal reference ranges for tricuspid annular plane systolic excursion and mitral annular plane systolic excursion in normally grown fetuses. J Ultrasound Med 2020;39:929–37. https://doi.org/10.1002/jum.15177.Search in Google Scholar PubMed
19. Messing, B, Gilboa, Y, Lipschuetz, M, Valsky, DV, Cohen, SM, Yagel, S. Fetal tricuspid annular plane systolic excursion (f-TAPSE): evaluation of fetal right heart systolic function with conventional M-mode ultrasound and spatiotemporal image correlation (STIC) M-mode. Ultrasound Obstet Gynecol 2013;42:182–8. https://doi.org/10.1002/uog.12375.Search in Google Scholar PubMed
20. Mao, YK, Zhao, BW, Wang, B. Z-score reference ranges for angular M-mode displacement at 22–40 weeks’ gestation. Fetal Diagn Ther 2017;41:115–26. https://doi.org/10.1159/000446071.Search in Google Scholar PubMed
21. Peixoto, AB, Bravo-valenzuela, NJ, Martins, WP, Tonni, G, Mattar, R, Moron, AF, et al.. Reference ranges for the fetal mitral, tricuspid, and interventricular septum annular plane systolic excursions between 20 and 36 + 6 weeks of gestation. J Perinat Med 2020;48:602–10. https://doi.org/10.1515/jpm-2020-0002.Search in Google Scholar PubMed
22. Herling, L, Johnson, J, Ferm-Widlund, K, Zamprakou, A, Westgren, M, Acharya, G. Automated quantitative evaluation of fetal atrioventricular annular plane systolic excursion. Ultrasound Obstet Gynecol 2021;58:853–63. https://doi.org/10.1002/uog.23703.Search in Google Scholar PubMed
23. Mielke, G, Benda, N. Cardiac output and central distribution of blood flow in the human fetus. Circulation 2001;103:1662–8. https://doi.org/10.1161/01.CIR.103.12.1662.Search in Google Scholar PubMed
24. Guo, XF, Li, YL, Zhao, BW. Annular plane systolic excursion Z-scores in evaluation of heart systolic function of fetus with heart failure. J Matern Fetal Neonatal Med 2022;35:5301–7. https://doi.org/10.1080/14767058.2021.1878492.Search in Google Scholar PubMed
25. Hendem, DU, Oluklu, D, Menekse Beser, D, Yildirim, M, Turgut, E, Tanacan, A, et al.. Evaluation of fetal cardiac functions in preeclampsia: does the severity or proteinuria affect fetal cardiac functions? J Ultrasound Med 2023;42:2415–24. https://doi.org/10.1002/jum.16268.Search in Google Scholar PubMed
26. Cruz-Lemini, M, Crispi, F, Valenzuela-Alcaraz, B, Figueras, F, Sitges, M, Gómez, O, et al.. Value of annular M-mode displacement vs tissue Doppler velocities to assess cardiac function in intrauterine growth restriction. Ultrasound Obstet Gynecol 2013;42:175–81. https://doi.org/10.1002/uog.12374.Search in Google Scholar PubMed
© 2025 the author(s), published by De Gruyter, Berlin/Boston
This work is licensed under the Creative Commons Attribution 4.0 International License.