Low uterine segment thickness in the prediction of cesarean delivery after induction of labor
-
Gizem Elif Dizdaroğulları


Abstract
Objectives
The aim of our study was to examine the relationship between lower uterine segment (LUS) thickness and cesarean delivery (CD) and compare the capacity two measurement methods of LUS thickness in the prediction of successful induction of labor (IOL).
Methods
This was a prospective cross-sectional study of consecutive pregnancies undergoing IOL between 2022 and 2023. The inclusion criteria were women with singleton pregnancies with cephalic presentation whose Bishop scores were below six undergoing IOL after 37 weeks of gestation. Patients with a history of CD, fetal anomalies, multiple gestations, and any contraindication to vaginal delivery were excluded from the study group.
Results
A total of 124 pregnant women were included in the study. LUS (10.13 ± 1.98 mm vs. 7.07 ± 1.66 mm, p<0.001) and myometrial LUS (MLUS) (5.63 ± 1.48 mm vs. 4.10 ± 1.22 mm, p<0.001) in the CD group were significantly higher than in the non-CD group. In the logistic regression analyses, significant independent effects of height (OR:0.88, 95 % CI: 0.79–0.98) and LUS (OR:2.71, 95 % CI: 1.66–4.43) values were observed in the prediction of CD. In the ROC analysis, both LUS (AUC 0.882, p<0.001) and MLUS (AUC 0.756, p<0.001) significantly predicted CD with an optimal cut-off value of 9.8 mm (75.0 % sensitivity, 92.6 % specificity) for LUS, and 5.1 mm (68.8 % sensitivity, 82.4 % specificity) for MLUS.
Conclusions
Ultrasonographic evaluation of LUS before IOL is a promising ultrasound parameter to predict CD. Although LUS and MLUS thickness measurements can be used to predict CD, LUS thickness has better sensitivity and specificity compared to MLUS thickness.
Introduction
Induction of labor (IOL) is a frequently used method in obstetrics to start labor in cases such as post-term pregnancies, maternal diabetes, preeclampsia, fetal growth restriction (FGR) and/or other maternal or fetal diseases that require prompt delivery. For this purpose, methods such as oxytocin, dinoprostone, misoprostol, or intracervical balloon catheter placement are usually used [1], 2]. Numerous studies have been conducted to determine whether IOL will be successful and result in vaginal delivery [3], [4], [5], [6], [7]. Many ultrasonographic parameters such as uterocervical angle, cervical length, and cervical elastography have been used to predict the success of IOL. Even though these parameters have been tried for this purpose, they have not been able to replace Bishop scores in daily practice [8], [9], [10], [11], [12]. However, despite its frequent use, the predictive ability of Bishop scores was found low [13], [14], [15].
The lower uterine segment (LUS) is the isthmic region of the uterus, which thins as pregnancy progresses [16]. It has been frequently used in previous studies to predict the risk of uterine rupture in vaginal birth after cesarean delivery(CD) [17], [18], [19]. There are several techniques to measure LUS thickness. Measuring the full thickness of the peritoneum, bladder wall and myometrium together (LUS) or only the myometrium (MLUS) are two well-defined techniques [20]. In 2023, Del Campo et al. showed that LUS thickness measurements before IOL were reproducible and significantly related in the prediction of IOL outcomes. Their findings supported the idea that pregnancies with a thinner LUS would be more likely to result in vaginal delivery [21]. However, in LUS measurement, the peritoneum, bladder wall and myometrium are measured as a whole, and there is limited data in the literature regarding the predictive value of myometrium measurement alone (MLUS) in vaginal delivery. To the best of our knowledge, the current study is the first to compare the predictive value of LUS and MLUS for successful IOL.
The aim of our study was to examine the relationship between LUS thickness and CD and compare the capacity of two measurement methods (LUS and MLUS) in the prediction of successful IOL.
Materials and methods
This was a prospective cross-sectional study of consecutive pregnancies undergoing IOL between 2022 and 2023 at our hospital. The study was approved by the ethics committee of our hospital and conducted in accordance with the Declaration of Helsinki. The inclusion criteria were women with singleton pregnancies with cephalic presentation whose Bishop scores were below six undergoing IOL after 37 weeks of gestation with vaginal application of dinoprostone. Patients with a history of CD, fetal anomalies, multiple gestations, and any contraindication to vaginal delivery were excluded from the study group. Descriptive data of the pregnant women such as age, weight, weight gain, height, gravidity, parity, conceiving method, gestational age at the time of IOL, indication of IOL, mode of delivery, and Bishop scores were recorded.
According to our institution protocol, if there is an indication for IOL but the cervix is unfavorable with a Bishop score of <6, a vaginal pessary containing 10 mg dinoprostone is placed in the posterior fornix. When cervical ripening occurs, we remove the dinoprostone and administer oxytocin if needed. Dinoprostone is maintained for a maximum of 24 h. If the Bishop remains unfavorable, another dinoprostone pessary is inserted. The dinoprostone is removed if uterine tachysystole (>5 uterine contractions in 10 min), or non-reassuring fetal heart rate occur. Fetal surveillance and uterine activity were monitored through external continuous electronic fetal heart rate monitoring and tocodynamometry. Failed induction was defined as the failure of the second dose of dinoprostone with a Bishop score of <6 or active phase arrest or prolonged second stage not suitable for instrumental delivery. Balloon dilation of the cervix is not routinely used in our hospital; dinoprostone is the preferred route of IOL. Successful IOL was defined as vaginal delivery.
In this study, after the decision for IOL was taken, patients were informed about the study and consent was obtained. Participants were asked to empty their bladder and bowels, and they were placed in the dorsal-lithotomy position. An ultrasound probe was covered with a sterile lubricant condom. A transvaginal probe was inserted into the vagina without excessive compression and when the area of the cervix was identified, the image was magnified. LUS was measured as the full thickness of the peritoneum, bladder wall, and myometrium together (LUS) and as only the myometrium (MLUS) (Figure 1). The calipers were placed at the thinnest part of the LUS and only one measurement was taken. Each patient contributed one measurement to the study.
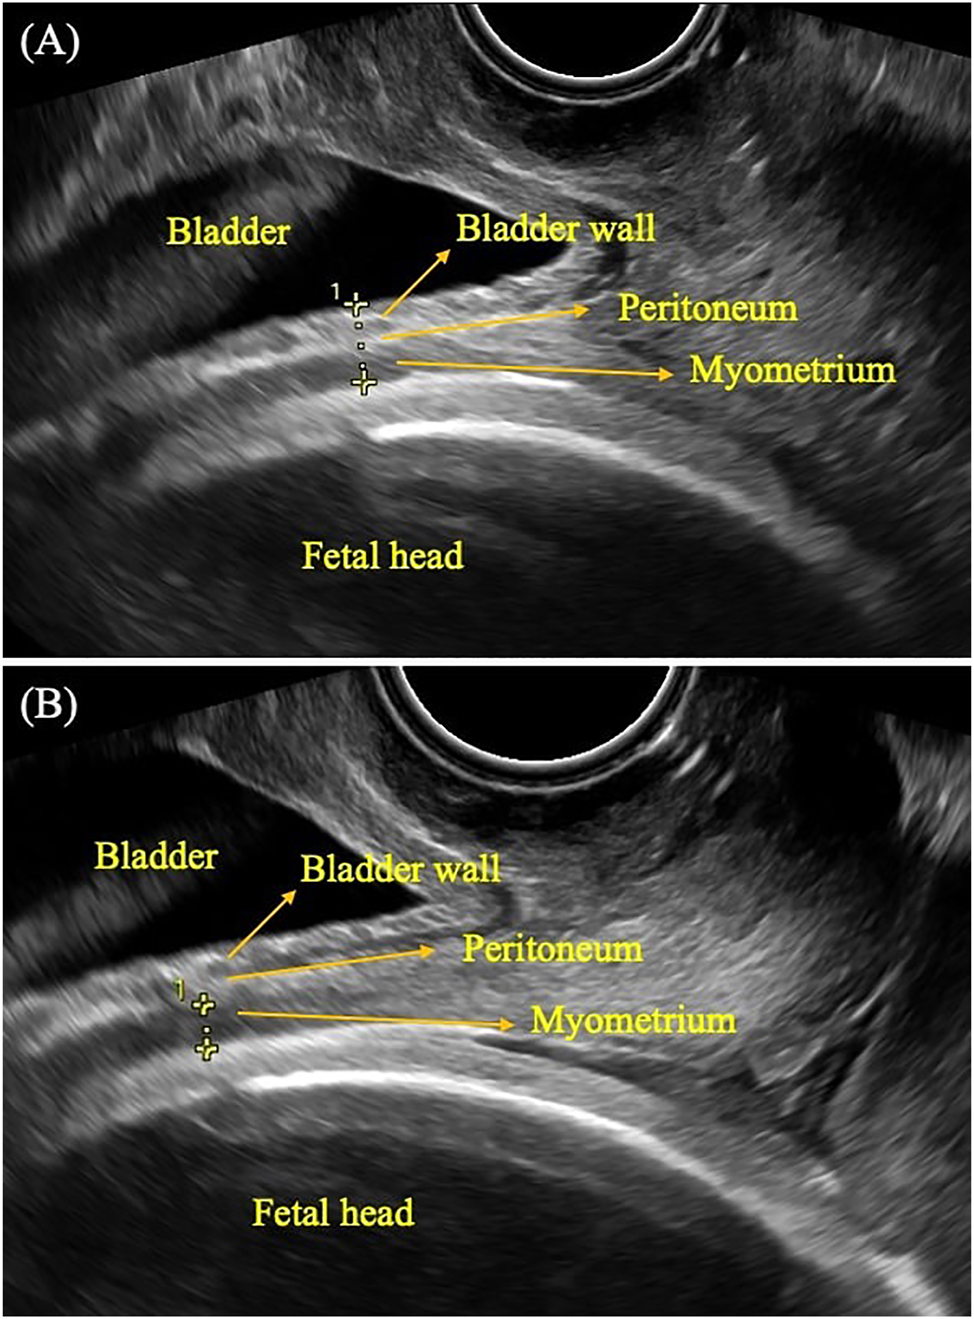
Ultrasonographic measurement of low uterine segment (LUS) thickness and myometrial LUS (MLUS) thickness a transvaginal probe was inserted into the vagina without excessive compression and when the area of the cervix was identified, the image was magnified. LUS was measured as the full thickness of the peritoneum, bladder wall, and myometrium together (LUS) (A) and as only the myometrium (MLUS) (B).
All the ultrasound scans were performed by an experienced operator and a trained resident using a Samsung RS85 ultrasound system (Samsung, South Korea) with a transvaginal probe. The sonographers who performed measurements were not in charge in the labor and delivery unit; the obstetricians in charge were blinded to measurements.
Time interval until delivery, time interval to birth after IOL, and indication if delivery occurred by CD were recorded. The study group was divided into two groups to compare demographic and clinical characteristics: pregnancies delivered by CD and pregnancies delivered vaginally. To examine the effectiveness of LUS measurements, the study group was also divided into different groups in terms of patient age (<25 years vs. >25 years), height (<160 cm vs. >160 cm), and body mass index (BMI) (<30 vs. >30 kg/m2), and nulliparity (nulliparous vs. parous).
Statistical analysis
Mean, standard deviation, median, minimum, maximum, frequency, and percentage were used for descriptive statistics. The distribution of variables was measured using Kolmogorov-Smirnov and Shapiro-Wilk tests. The independent samples t-test was used to analyze independent quantitative data with normal distribution. The Mann-Whitney U test was used in the analysis of independent quantitative data with non-normal distribution. The Chi-square test was used for the comparison of qualitative data. The effect level was tested using receiver operating characteristics (ROC) curve analysis and logistic regression. Hosmer-Lemeshow test was used to assess goodness-of-fit. Model calibration and discrimination were satisfactory with a p value 0.055. The SPSS 28.0 software package was used for statistical analyses and p<0.05 was considered statistically significant.
Results
A total of 140 patients met the eligibility criteria. Of these, 16 were excluded because of missing data. The demographic and obstetric characteristics of the study group are summarized in Table 1. When we examined the ultrasound parameters, the mean cervical length was 28.6 ± 8.1 mm, the mean LUS was 7.47 ± 1.98 SD, the mean MLUS was 4.29 ± 1.35, and funneling was present in 20 (16.1 %) patients.
Demographic and obstetric characteristics of the study population.
| Characteristics | Value |
|---|---|
| Age, years | 27.2 ± 5.4 |
| Weight, kg | 77.2 ± 13.9 |
| Weight gain during pregnancy, kg | 12.5 ± 5.3 |
| Height, cm | 161.8 ± 6.3 |
| Gravidity | 1.9 ± 1.2 |
| Parity | 1 (1–3) |
| Nulliparous | 54 (43.5 %) |
| Spontaneous conception | 122 (98.4 %) |
| Gestational age at IOL, week | 39 (37–42) |
| Indication for IOL | |
| Fetal distress | 11 (68.8 %) |
| Failure to progress in active labor | 5 (31.2) |
| CD | 16 (12.9 %) |
| Indication for CD | |
| Post-term pregnancy | 31 (25.0 %) |
| FGR | 28 (22.6 %) |
| Oligohydramnios | 20 (16.1 %) |
| PROM | 17 (13.7 %) |
| HTDP | 13 (10.5 %) |
| DM | 7 (5.6 %) |
| Cholestasis | 5 (4.0 %) |
| Alloimmunization | 2 (1.6 %) |
| Fetal macrosomia | 1 (0.8 %) |
| Delivery in 24 h | 101 (81.5 %) |
| Time interval to the onset of active labor, h | 11.24 ± 9 |
| Time interval to the birth, h | 14.7 ± 10.1 |
| Cervical length, mm | 28.6 ± 8.1 |
| Funneling | 20 (16.1 %) |
| Bishop score | 3 (0–5) |
| LUS, mm | 7.47 ± 1.98 |
| MLUS, mm | 4.29 ± 1.35 |
| Newborn weight, g | 3,142 ± 543 |
-
Values are stated as median, mean ± SD, and percentages (%). CD, cesarean delivery; DM, diabetes; FGR, fetal growth restriction; HTDP, hypertensive disorders of pregnancy; IOL, induction of labor; PROM, premature rupture of membranes.
Table 2 represents a comparison of clinical and demographic characteristics of women with and without CD. LUS (10.13 ± 1.98 mm vs. 7.07 ± 1.66 mm, p<0.001), MLUS (5.63 ± 1.48 mm vs. 4.10 ± 1.22 mm, p<0.001), and cervical length (33.4 ± 9.3 vs. 27.9 ± 7.7, p=0.011) in the CD group were significantly higher than in the non-CD group. Height in the CD group was significantly shorter than in the non-CD group (157.4 ± 6.4 cm vs. 162.5 ± 6.1 cm, p=0.006). Age, weight, weight gain, gravidity, parity, nulliparity, gestational age at IOL, presence of funneling, time interval to the onset of active labor, time interval to the birth, Bishop scores, spontaneous conception rate, and newborn weights did not differ between the groups with and without CD.
Comparison of clinical and demographic characteristics of cases with and without cesarean delivery.
| CD (−) (n=108) | CD (+) (n=16) | ||||||||||
|---|---|---|---|---|---|---|---|---|---|---|---|
| Mean ± SD/n, % | Median | Mean ± SD/n, % | Median | p-Value | |||||||
| Age, year | 27.2 ± 5.3 | 26.0 | 27.1 ± 5.9 | 25.5 | 0.917 | t | |||||
| Weight, kg | 77.8 ± 14.4 | 75.0 | 73.0 ± 8.9 | 75.5 | 0.202 | t | |||||
| Weight gain, kg | 12.6 ± 5.6 | 12.0 | 11.8 ± 3.7 | 11.0 | 0.860 | m | |||||
| Height, cm | 162.5 ± 6.1 | 163.0 | 157.4 ± 6.4 | 158.5 | 0.006 | m | |||||
| BMI, kg/m2 | 29.5 ± 5.4 | 28.6 | 29.5 ± 3.4 | 29.8 | 0.625 | m | |||||
| Spontaneous conception | 107 | 99.1 % | 15 | 93.8 % | 0.242 | X² | |||||
| Gravidity | 2.02 ± 1.31 | 2.00 | 1.44 ± 0.73 | 1.00 | 0.079 | m | |||||
| Parity | 1.43 ± 0.61 | 1.00 | 1.40 ± 0.55 | 1.00 | 0.972 | m | |||||
| Nulliparous | 49 | 45.4 % | 5 | 31.3 % | 0.288 | X² | |||||
| Gestational age at IOL | 39.1 ± 1.4 | 39.0 | 39.1 ± 1.5 | 38.5 | 0.861 | m | |||||
| Funneling | 18 | 16.7 % | 2 | 12.5 % | 0.672 | X² | |||||
| LUS, mm | 7.07 ± 1.66 | 6.95 | 10.13 ± 1.98 | 10.15 | <0.001 | m | |||||
| MLUS, mm | 4.10 ± 1.22 | 3.90 | 5.63 ± 1.48 | 5.55 | <0.001 | m | |||||
| Time interval to the onset of active labor, h | 11.71 ± 9.62 | 8.35 | 8.10 ± 0.00 | 8.10 | 0.676 | m | |||||
| Time interval to birth, h | 15.27 ± 10.79 | 11.85 | 11.20 ± 0.00 | 11.20 | 0.676 | m | |||||
| Newborn weight, g | 3,133.4 ± 523.0 | 3,197.5 | 3,199.1 ± 683.0 | 3,225.0 | 0.917 | m | |||||
| Cervical length, mm | 27.9 ± 7.7 | 28.0 | 33.4 ± 9.3 | 32.0 | 0.011 | T | |||||
| Bishop score | 2.62 ± 1.50 | 3.00 | 2.00 ± 1.51 | 2.00 | 0.153 | m | |||||
-
t Independent samples t-test/m Mann–Whitney U test/X² Chi-square test (Fischer test). BMI, body mass index; CD, cesarean delivery; IOL, induction of labor. The bold values indicate statistically significant results (p<0.05).
The results of the logistic regression analyses are summarized in Table 3. In the univariate model, a significant effect of height (OR:0.87, 95 % CI: 0.79–0.95), LUS (OR:2.76, 95 % CI: 1.72–4.45), MLUS (OR:2.17, 95 % CI: 1.45–3.24), and cervical length (OR:1.10, 95 % CI: 1.02–1.18) was observed in the prediction of CD after IOL. In the multivariate model, significant independent effects of height (OR:0.88, 95 % CI: 0.79–0.98) and LUS (OR:2.71, 95 % CI: 1.66–4.43) values were observed in the prediction of CD.
Logistic regression analysis.
| Univariate model | Multivariate model | |||||||||
|---|---|---|---|---|---|---|---|---|---|---|
| OR | 95 % CI | p-Value | OR | 95 % CI | p-Value | |||||
| Height | 0.873 | 0.795 | – | 0.958 | 0.004 | 0.883 | 0.791 | – | 0.985 | 0.026 |
| LUS | 2.763 | 1.716 | – | 4.447 | <0.001 | 2.709 | 1.657 | – | 4.427 | <0.001 |
| MLUS | 2.165 | 1.445 | – | 3.244 | <0.001 | |||||
| Cervical length | 1.096 | 1.019 | – | 1.178 | 0.014 | |||||
-
Logistic Regression (Forward LR). In the univariate model, a significant effect of height LUS, MLUS, and cervical length was observed in the prediction of CD after IOL (p<0.05). In the multivariate model, significant independent effects of height and LUS values were observed in the prediction of CD (p<0.05).
ROC analysis was performed to evaluate optimal cut-off values of LUS and MLUS to predict CD. Both LUS (AUC 0.882, p<0.001) and MLUS (AUC 0.756, p<0.001) significantly predicted CD with an optimal cut-off value of 9.8 mm (75.0 % sensitivity, 92.6 % specificity) for LUS, and 5.1 mm (68.8 % sensitivity, 82.4 % specificity) for MLUS (Figure 2).
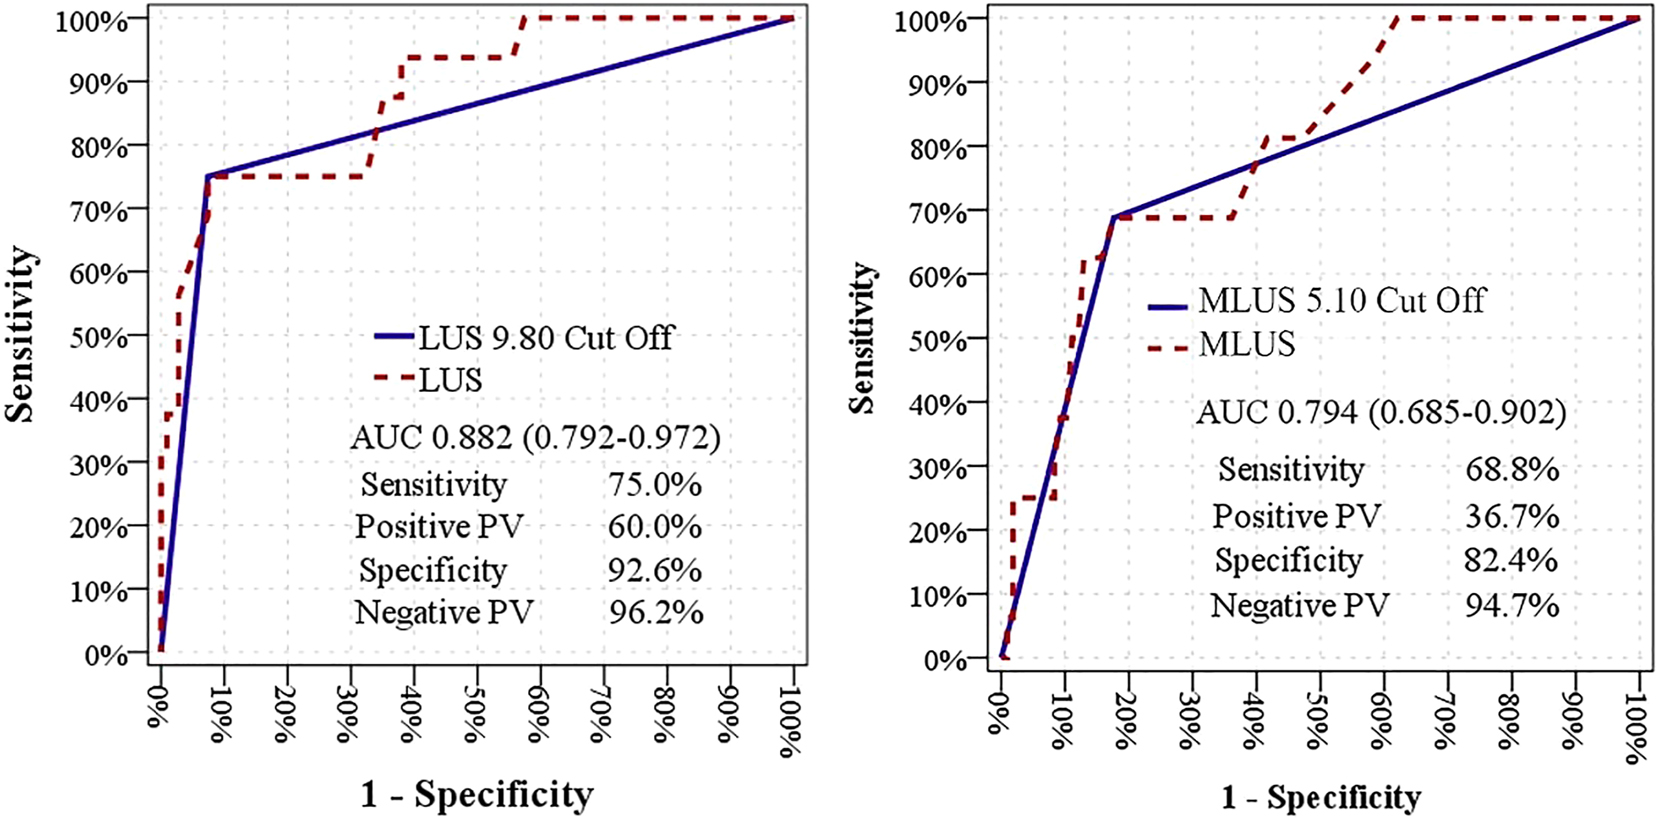
ROC analysis of LUS thickness and MLUS thickness to predict the duration of CD. ROC analysis was performed to evaluate optimal cut-off values of LUS and MLUS to predict CD. Both LUS (AUC 0.882, p<0.001) and MLUS (AUC 0.756, p<0.001) significantly predicted CD with an optimal cut-off value of 9.8 mm (75.0 % sensitivity, 92.6 % specificity) for LUS, and 5.1 mm (68.8 % sensitivity, 82.4 % specificity) for MLUS. AUC, area under the curve; CD, caesarean delivery; LUS, low uterine segment; PC, predictive value; ROC, receiver operating characteristics.
Because LUS was evaluated as an independent variable in logistic regression analysis, its ability to predict the probability of CD was also studied. Half of the pregnancies resulted in CD with an LUS value over 10 mm and 80 % when it was over 12 mm (Figure 3).
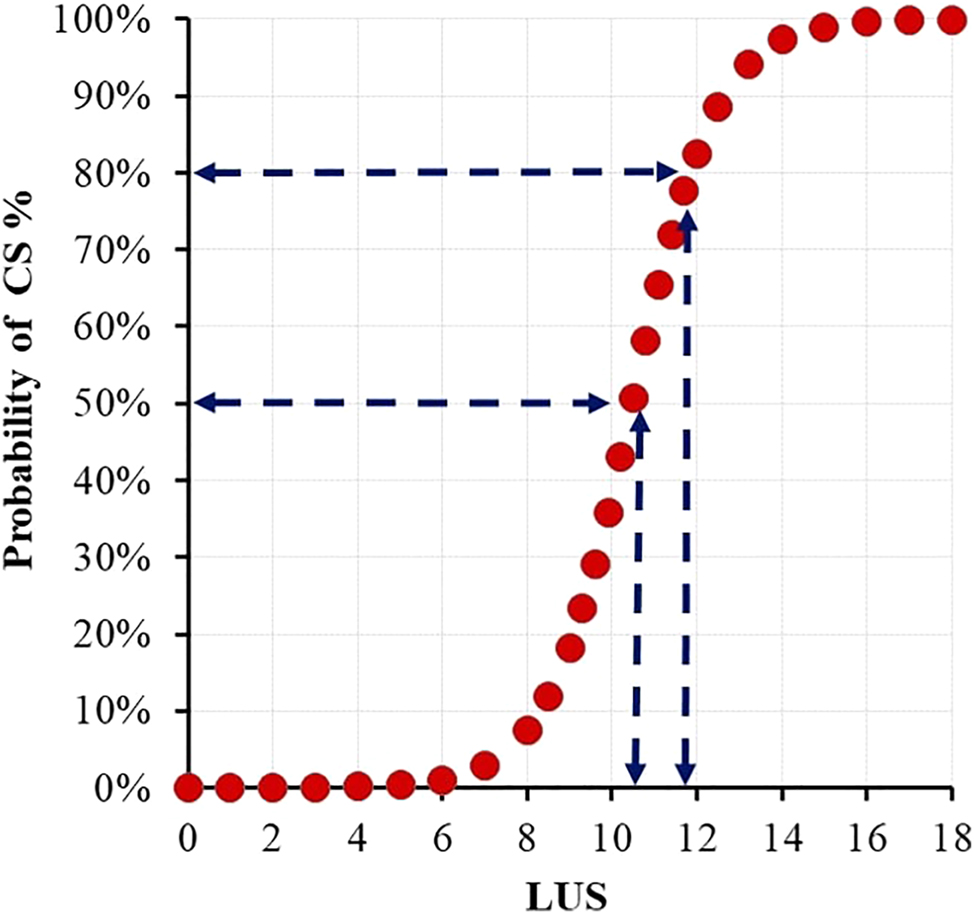
Probability of CS at different LUS thickness values after IOL half of the pregnancies resulted in CS with an LUS value over 10 mm and 80 % when it was over 12 mm. CS, caesarean section; IOL, induction of labor; LUS, low uterine segment.
We also assessed the predictive value of LUS measurements across different patient subgroups. We found that LUS values were significantly effective in predicting CD in patients aged under and over 25 years. It was also effective in patients with a BMI under and over 30 kg/m2. However, LUS measurements were more effective in patients with a height≤160 cm in the prediction of CD compared with patients taller than 160 cm (p<0.05). LUS measurements were also found to be more effective in parous women than in nulliparous women (p<0.05) (Figure 4).
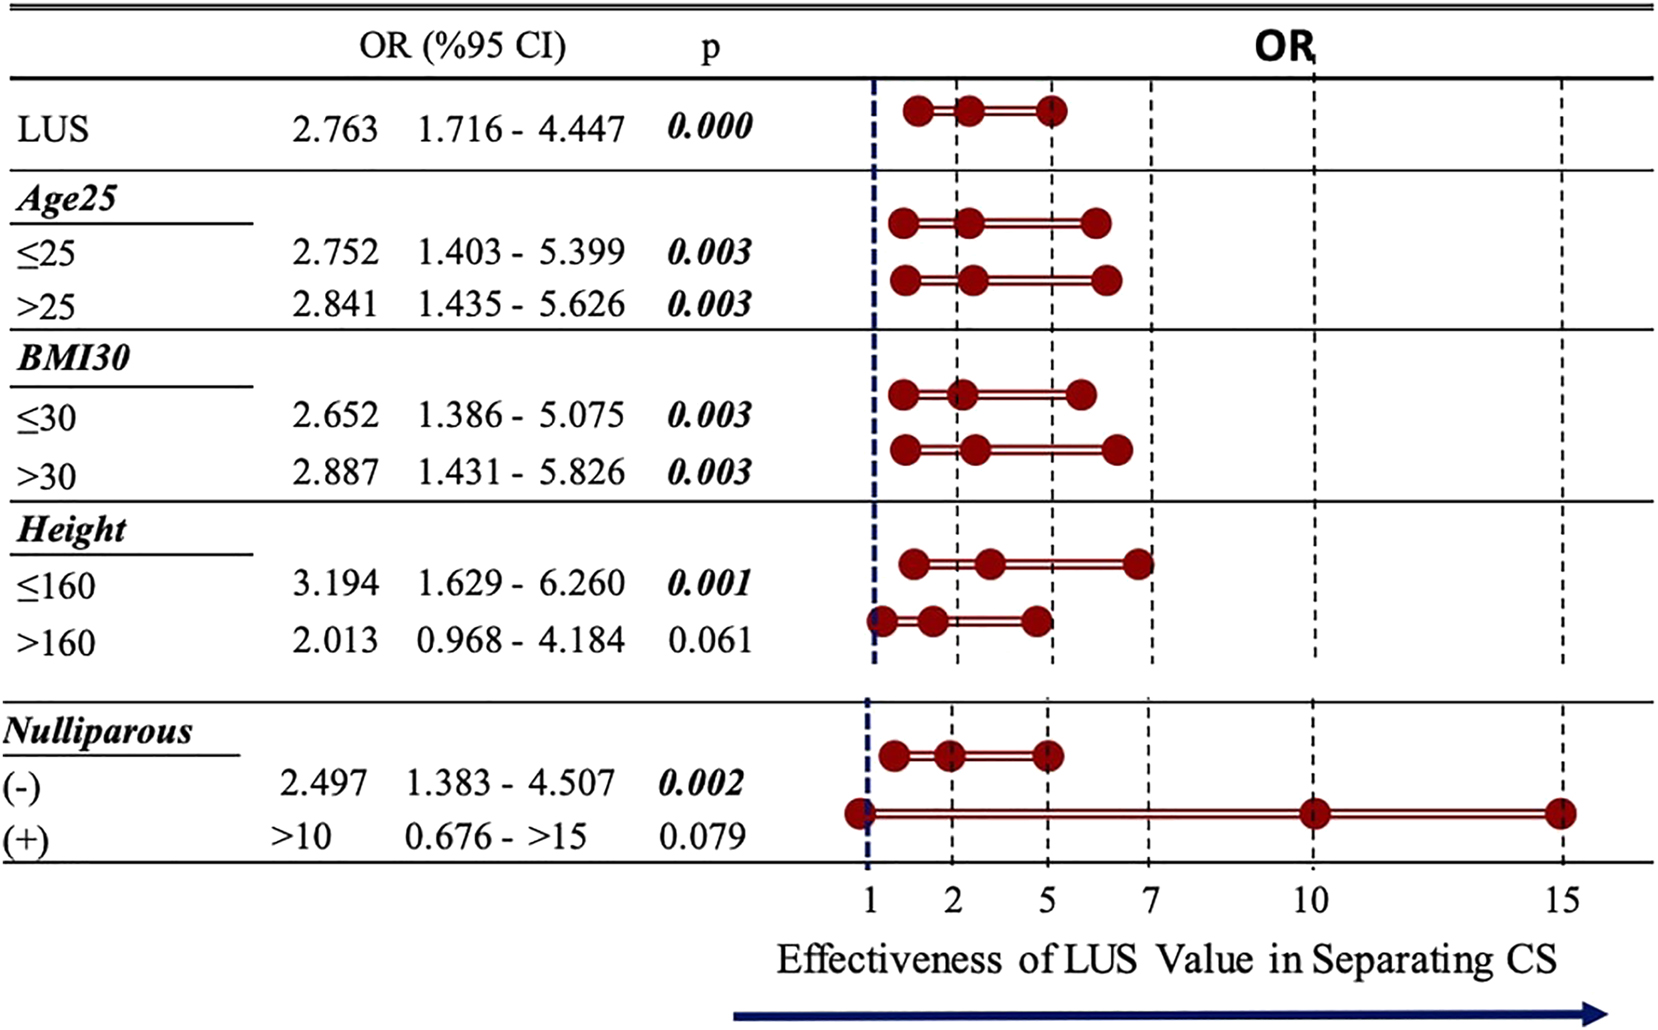
Effectiveness of LUS thickness value in different subgroupsLUS values were significantly effective in predicting CS in patients aged under and over 25 years. It was also effective in patients with a BMI under and over 30 kg/m2. However, LUS measurements were more effective in patients with a height≤160 cm in the prediction of cesarean delivery compared with patients taller than 160 cm (p<0.05). LUS measurements were also found to be more effective in parous women than in nulliparous women (p<0.05). BMI, body mass index; CS, caesarean section; IOL, induction of labor; LUS, low uterine segment.
Discussion
Our study showed that both LUS and MLUS thickness before IOL were significantly associated with prediction of CD. We provide cut-off points for LUS and MLUS that are useful in clinical practice to predict if successful IOL will occur. However, when we compared the prediction accuracy of these two measurements, we found that LUS had a better predictive ability than MLUS. LUS thickness was also successful in predicting CD in all age groups and all BMI groups, but was better in the prediction of CD in women shorter than 160 cm and multiparous women.
LUS thickness and IOL outcome
The first attempt to measure LUS thickness in the prediction of successful IOL was made by Hamza et al. in 2020 [21]. They measured the full thickness of the LUS and found no correlation between LUS thickness and delivery in 24 h. It is difficult to compare this study with ours because our study group comprised more multiparous women and we found that the predictive efficacy of LUS for CD was higher in multiparous patients. Another reason may be that the birth rate within 24 h, which was the endpoint in the study by Hamza et al., was higher in our study group. Moreover, CD rates were lower in our study compared to the study by Hamza et al., and this difference may be due to differences in CD indications among operators, thus explaining the difference in the predictive value of LUS measurement for CD between the two studies.
In 2023, Del Campo et al. hypothesized that thinner LUS measurements might indicate a higher chance of vaginal birth [22]. Before labor, the myometrium forms the LUS. This formation is important for the descent of the fetal head. LUS thickness, which is the ultrasonographic measurement of the LUS, may be useful in predicting IOL outcomes. Their study supported this hypothesis and, similar to our study, they found that LUS thickness was an independent factor that predicted IOL outcomes. However, the mean LUS value in the current study was higher (7.2 vs. 5.4 mm) than in Del Campo et al.’s study, which may be a result of the higher post-term pregnancy rate (72.5 vs. 25.0 %) and median gestational week (41 vs. 39 weeks) in their study. Another difference is that, unlike us, they included patients with previous CD, which may disturb the LUS with the formation of scar tissue.
Full LUS vs. MLUS measurements
In our study, we measured LUS thickness using two different methods, full-thickness LUS and only myometrial thickness. Before labor, the LUS becomes thinner because of myometrium thinning. Measuring the LUS with bladder wall thickness may not reflect the function of the LUS exactly because bladder thickness and the amount of urine in the bladder may vary between individuals. Thus, we hypothesized that MLUS measurements might better reflect the formation of the LUS. However, in our study, we found that LUS thickness had a better prediction outcome regarding delivery mode, contra to our hypothesis. One reason for this may be that LUS measurements are easier to perform than MLUS measurements. While measuring full-thickness LUS, placing one of the calipers on the bladder wall under the guidance of the anechoic urine image and placing the other on the uterine floor under the guidance of the anechoic amniotic fluid is easier due to having two anechoic guide points. Measuring MLUS by distinguishing the myometrium from the peritoneum and bladder is more challenging.
Bujold et al. conducted a study measuring LUS and MLUS thickness in the prediction of complete uterine rupture [23]. They stated that the measurement of only the myometrium was expected to be more associated with the functional integrity of the LUS value. This idea was supported in several other studies [24], [25], [26]. However, in their study, like ours, Bujold et al. found that full-thickness LUS measurements were more valuable. They hypothesized that MLUS measurements were more prone to inaccuracies with MLUS measurements possibly varying according to the image set-up of the ultrasound, different from LUS.
In the current study, we didn’t perform the reproducibility of MLUS. Although the reproducibility of LUS has been studied before, inter-operator variability is still missing for both parameters, LUS and MLUS [22]. To study differences in measurement and inter-operator variability of two parameters would have been interesting to highlight why LUS thickness was found better to predict CD.
Strengths and limitations
The current study has some limitations. Our study population did not only consist of low-risk pregnant women. The inclusion of pregnant women with high risk for CD (FGR, oligohydramnios, etc.) may be a confounding factor in the predictive value of LUS measurements for vaginal delivery. Another limitation is that our median measurement was higher than in previous studies in which the median gestational age was more advanced, which may indicate that LUS measurements could change during each gestational week. It may be more appropriate to give a separate value to each week of pregnancy rather than giving a single cut-off value to the third trimester to predict CD. The fact that this study was conducted in a single center and the exclusion of women with prior CD, fetal anomalies, multiple gestations, and any contraindication to vaginal delivery should also be considered a limitation because it limits applicability of the results to general obstetric population. Further studies with larger sample sizes are needed to indicate a pregnancy-week-specific value for LUS and also to generalize our findings.
This study has several strengths. Our main strength is the prospective nature of the study, which allowed us to gather complete data meticulously. Another strength is the prospective measurement of the LUS by the same two operators. The obstetricians in charge in the labor unit were different than the sonographers who performed the measurements, who were blinded to the values obtained using ultrasound. We also followed a clear hospital protocol to manage IOL, which is a strength.
Conclusions
Ultrasonographic evaluation of LUS before IOL is a promising ultrasound parameter that can be easily applied to predict CD. Although LUS and MLUS thickness measurements can be used to predict CD, LUS thickness has better sensitivity and specificity compared to MLUS thickness. Assessment of LUS prior to IOL may provide valuable information regarding the risk of CD for both practitioners and pregnant women. Prospective studies with larger numbers of participants are needed to determine the cut-off values of LUS thickness values specific to gestational weeks.
-
Research ethics: The study protocol was approved by the Ethics Committee of our hospital (Approval date and number: 2024 / 010.99/2/20).
-
Informed consent: Informed consent was obtained from all individuals included in this study, or their legal guardians or wards.
-
Author contributions: All authors have accepted responsibility for the entire content of this manuscript and approved its submission.
-
Use of Large Language Models, AI and Machine Learning Tools: None declared.
-
Conflict of interest: The authors state no conflict of interest.
-
Research funding: None declared.
-
Data availability: Data available on request from the authors.
References
1. ACOG Practice Bulletin No. 107: induction of labor. Obstet Gynecol 2009;114:386–97. https://doi.org/10.1097/AOG.0b013e3181b48ef5.Search in Google Scholar PubMed
2. Sanchez-Ramos, L, Levine, LD, Sciscione, AC, Mozurkewich, EL, Ramsey, PS, Adair, CD, et al.. Methods for the induction of labor: efficacy and safety. Am J Obstet Gynecol 2024;230:S669–95. https://doi.org/10.1016/j.ajog.2023.02.009. Epub 2023 Jul 13. PMID: 38462252.Search in Google Scholar PubMed
3. Gibson, KS, Waters, TP. Measures of success: prediction of successful labor induction. Semin Perinatol 2015;39:475–82. https://doi.org/10.1053/j.semperi.2015.07.012.Search in Google Scholar PubMed
4. Baños, N, Migliorelli, F, Posadas, E, Ferreri, J, Palacio, M. Definition of failed induction of labor and its predictive factors: two unsolved issues of an everyday clinical situation. Fetal Diagn Ther 2015;38:161–9. https://doi.org/10.1159/000433429. Epub 2015 Jun 26. Erratum in. 2015;38(4):268. doi: 10.1159/000437343. PMID: 26138441.Search in Google Scholar PubMed
5. Heffner, LJ, Elkin, E, Fretts, RC. Impact of labor induction, gestational age, and maternal age on cesarean delivery rates. Obstet Gynecol 2003;102:287–93. https://doi.org/10.1016/s0029-7844(03)00531-3.Search in Google Scholar PubMed
6. San Román, GA. Concerns regarding a validated calculator to estimate risk of cesarean delivery after an induction of labor with an unfavorable cervix. Am J Obstet Gynecol 2018;219:421–2. https://doi.org/10.1016/j.ajog.2018.04.061.Search in Google Scholar PubMed
7. Beninati, MJ, Ramos, SZ, Danilack, VA, Has, P, Savitz, DA, Werner, EF. Prediction model for vaginal birth after induction of labor in women with hypertensive disorders of pregnancy. Obstet Gynecol 2020;136:402–10. https://doi.org/10.1097/AOG.0000000000003938. PMID: 32649502.Search in Google Scholar PubMed
8. Park, KH. Transvaginal ultrasonographic cervical measurement in predicting failed labor induction and cesarean delivery for failure to progress in nulliparous women. J Kor Med Sci 2007;22:722–7. https://doi.org/10.3346/jkms.2007.22.4.722.Search in Google Scholar PubMed PubMed Central
9. Kamel, R, Garcia, FSM, Poon, LC, Youssef, A. The usefulness of ultrasound before induction of labor. Am J Obstet Gynecol MFM 2021; 3: 100423. 6, https://doi.org/10.1016/j.ajogmf.2021.100423, . Eggebo TM, Okland I, Heien C, Gjessing LK, Romundstad P, Salvesen KA. Can ultrasound measurements replace digitally assessed elements of the Bishop score? Acta Obstet Gynecol Scand 2009; 88: 325–331. 7.Search in Google Scholar PubMed
10. Dagdeviren, E, Aslan Cetin, B, Aydogan Mathyk, B, Koroglu, N, Topcu, EG, Yuksel, MA. Can uterocervical angles successfully predict induction of labor in nulliparous women? Eur J Obstet Gynecol Reprod Biol 2018;228:87–91. 9. https://doi.org/10.1016/j.ejogrb.2018.06.014.Search in Google Scholar PubMed
11. Londero, AP, Schmitz, R, Bertozzi, S, Driul, L, Fruscalzo, A. Diagnostic accuracy of cervical elastography in predicting labor induction success: a systematic review and meta-analysis. J Perinat Med 2016;44:167–78. https://doi.org/10.1515/jpm-2015-0035.Search in Google Scholar PubMed
12. VerhoevenCJ, OBC, OeiSG, LV, vanderPostJA, MBW. Transvaginal sonographic assessment of cervical length and wedging for predicting outcome of labor induction at term: a systematic review and meta-analysis. Ultrasound Obstet Gynecol 2013;42:500–8. 8.10.1002/uog.12467Search in Google Scholar PubMed
13. Bishop, EH. Pelvic scoring for elective induction. Obstet Gynecol 1964;24:266–8.Search in Google Scholar
14. Teixeira, C, Lunet, N, Rodrigues, T, Barros, H. The Bishop Score as a determinant of labour induction success: a systematic review and meta-analysis. Arch Gynecol Obstet 2012;286:739–53. https://doi.org/10.1007/s00404-012-2341-3.Search in Google Scholar PubMed
15. Kolkman, DG, Verhoeven, CJ, Brinkhorst, SJ, van der Post, JA, Pajkrt, E, Opmeer, BC, et al.. The Bishop score as a predictor of labor induction success: a systematic review. Am J Perinatol 2013;30:625–30. https://doi.org/10.1055/s-0032-1331024.Search in Google Scholar PubMed
16. FukudaM, FK, ShimizuT, BE, Bujold, E. Ultrasound assessment of lower uterine segment thickness during pregnancy, labour, and the postpartum period. J Obstet Gynaecol Can 2016;38:134–40. https://doi.org/10.1016/j.jogc.2015.12.009.Search in Google Scholar PubMed
17. Jastrow, N, Demers, S, Chaillet, N, Girard, M, Gauthier, RJ, Pasquier, JC, et al.. Lower uterine segment thickness to prevent uterine rupture and adverse perinatal outcomes: a multicenter prospective study. Am J Obstet Gynecol 2016;215:604.e1–604.e6. https://doi.org/10.1016/j.ajog.2016.06.018. Epub 2016 Jun 21. PMID: 27342045.Search in Google Scholar PubMed
18. Jastrow, N, Chaillet, N, Roberge, S, Morency, AM, Lacasse, Y, Bujold, E. Sonographic lower uterine segment thickness and risk of uterine scar defect: a systematic review. J Obstetr Gynaecol Canada 2010;32:321–7. https://doi.org/10.1016/s1701-2163(16)34475-9.Search in Google Scholar
19. Swift, BE, Ps Shah, D. Farine Sonographic lower uterine segment thickness after prior cesarean section to predict uterine rupture: a systematic review and meta-analysis. Acta Obstetr Gynecol Scand 2019;98:830–41. https://doi.org/10.1111/aogs.13585.Search in Google Scholar PubMed
20. Kok, N, Wiersma, IC, Opmeer, BC, Graaf, Imde, Mol, BW, Pajkrt, E. Sonographic measurement of lower uterine segment thickness to predict uterine rupture during a trial of labor in women with previous Cesarean section: a meta-analysis. Ultrasound Obstet Gynecol 2013;42:132–9. https://doi.org/10.1002/uog.12479.Search in Google Scholar PubMed
21. Hamza, A, Radosa, J, Gerlinger, C, Solomayer, EF, Ströder, R, Meyberg-Solomayer, G. Cervical and lower uterine parameter ultrasound and elastographic parameters for the prediction of a successful induction of labor. Ultraschall Med 2021;42:520–8. https://doi.org/10.1055/a-1131-7736. English. Epub 2020 Mar 20. PMID: 32198732.Search in Google Scholar PubMed
22. Del Campo, A, Aiartzaguena, A, Suárez, B, Rodríguez, A, Rodríguez, L, Burgos, J. Lower uterine segment thickness assessed by transvaginal ultrasound before labor induction: reproducibility analysis and relationship with delivery outcome. Ultrasound Obstet Gynecol 2023;61:399–407. https://doi.org/10.1002/uog.26024. Epub 2023 Feb 6. PMID: 35802514.Search in Google Scholar PubMed
23. Bujold, E, Jastrow, N, Simoneau, J, Brunet, S, Gauthier, RJ. Prediction of complete uterine rupture by sonographic evaluation of the lower uterine segment. Am J Obstet Gynecol 2009;201:320.e1–6. https://doi.org/10.1016/j.ajog.2009.06.014. PMID: 19733288.Search in Google Scholar PubMed
24. Cheung, VY. Sonographic measurement of the lower uterine segment thickness in women with previous caesarean section. J Obstet Gynaecol Can 2005;27:674–81. https://doi.org/10.1016/s1701-2163(16)30545-x.Search in Google Scholar PubMed
25. Sen, S, Malik, S, Salhan, S. Ultrasonographic evaluation of lower uterine segment thickness in patients of previous cesarean section. Int J Gynaecol Obstet 2004;87:215–9. https://doi.org/10.1016/j.ijgo.2004.07.023.Search in Google Scholar PubMed
26. Gotoh, H, Masuzaki, H, Yoshida, A, Yoshimura, S, Miyamura, T, Ishimaru, T. Predicting incomplete uterine rupture with vaginal sonography during the late second trimester in women with prior cesarean. Obstet Gynecol 2000;95:596–600. https://doi.org/10.1097/00006250-200004000-00022.Search in Google Scholar
© 2025 the author(s), published by De Gruyter, Berlin/Boston
This work is licensed under the Creative Commons Attribution 4.0 International License.