A new type of pubertal height reference based on growth aligned for onset of pubertal growth
-
Kerstin G. Albertsson-Wikland

 ,
Aimon Niklasson
,
Aimon Niklasson

Abstract
Objectives
Growth references of today traditionally describe growth in relation to chronological age. Despite the broad variation in age of pubertal maturation, references related to biological age are lacking. To fill this knowledge gap, we aimed to develop a new type of pubertal height reference for improved growth evaluation during puberty, considering individual variation in pubertal timing.
Methods
Longitudinal length/height measures were obtained from birth to adult height in 1,572 healthy Swedish children (763 girls) born at term ∼1990 to nonsmoking mothers and Nordic parents, a subgroup of GrowUp1990Gothenburg cohort. A total height reference was constructed from Quadratic-Exponential-Puberty-Stop (QEPS)-function-estimated heights from individual height curves that had been aligned for time/age at onset of pubertal growth (5% of P-function growth). References that separated growth into specific pubertal heightSDS (P-function growth) and basic heightSDS (QES-function growth) were also generated.
Results
References (cm and SDS) are presented for total height, and height subdivided into that specific to puberty and to basic growth arising independently of puberty. The usefulness of the new pubertal growth reference was explored by identifying differences in the underlying growth functions that translate into differences in pubertal height gain for children of varying body mass, height, and with different pubertal timings.
Conclusions
A new type of height reference allowing alignment of individual growth curves, based on the timing of the pubertal growth spurt was developed using QEPS-model functions. This represents a paradigm shift in pubertal growth research and growth monitoring during the adolescent period.
Introduction
Height references that reflect growth during infancy, childhood, and puberty through to adult height have been available for decades; however, they traditionally describe length and height in relation to chronological age as opposed to biological age [1]. This is the case for all growth references used in clinical practice today [2], [3], [4]. The limitation inherent in this approach is that it fails to take into account interindividual variation in the timing of pubertal maturation, which is considerable among children who are growing normally [1]. Consideration of variations in growth between individuals is particularly important during puberty owing to this period’s rapid changes in growth. Constructing a height reference that provides an accurate description of growth from the start of puberty onward, allowing the growth of individuals to be aligned based on their timing of pubertal maturation, is therefore paramount.
Adolescence represents a transitional phase of growth and development between childhood and adulthood, characterized by a marked increase in the height of the individual. During puberty, the slow declining height velocity during childhood is replaced by acceleration in height velocity, signaling onset of the pubertal growth spurt. In the individual, growth during the pubertal years follows an S-shaped pattern; with subtle changes in growth velocity in the beginning, followed by a middle period of rapid growth during which height velocity reaches a peak, and subsequently a slow decline in growth until adult height is reached. The main challenge when assessing growth during adolescence is the wide interindividual variation in the timing of biological maturation. This was described by Margaret Merrell in 1931 [5], and later illustrated by Tanner et al. who showed that age at peak height velocity (PHV) for five healthy individuals ranged from 12 to 16 years. On this basis, they suggested aligning growth curves based on height at the time of PHV to generate a mean growth curve that captured the sharp accelerating and decelerating pattern of the individual growth spurts [6]. Although this method should provide retrospective assessment of growth patterns, it had limited usefulness for prospective monitoring of growth from the start of puberty, beginning approximately 2 years before PHV. Therefore, no height reference was developed that made it possible to estimate growth in accordance with the maturation of the individual child. Instead, they introduced growth charts for use in the UK and North America at this time [6]. These charts included separate growth curves showing means and percentiles for typical early, average, and late maturers [7]. Updated versions of these growth charts are used in clinical practice today, and improved in a recent Spanish study using this approach but presenting yearly typical growth curves over a five-year period [8]. However, the clinician still has to select the reference curve for total height that look most appropriate for the individual child. It is important to note that this approach is not generally applicable for monitoring individual growth during puberty because it only corrects for group onset of puberty but not for the individual onset of puberty.
In an attempt to account for puberty, current references in Sweden also visualize growth in relation to the physical signs of pubertal maturation: breast stages in girls [9] and genital maturation [10] and testicular volume in boys [11]. The present reference used even provides standard deviation scores (SDS) associated with these physical signs. In the absence of longitudinal growth data, it is essential to take sexual maturation into account when assessing height during the adolescent years [12].
As part of the development of the current Swedish growth reference in 2000, we attempted to estimate the timing and tempo of pubertal growth. To obtain at least an estimate of this tempo, we used data from a subgroup of individuals for whom age at PHV fell within a narrow range of the mean. The resulting growth reference was steeper than previous references, reflecting more closely the shape of individual growth curves [2]; however, it did not allow growth to be aligned based on the start of puberty. To generate a reference that allows such alignment of growth, it is necessary to use a growth model that can consider the biological tempo of the individual. Growth models are primarily used for testing hypotheses about the regulation and mechanisms responsible for growth in humans [13], [14], [15], [16]. However, the individual growth curves constructed from real-life data by such models can also be used to develop growth references that provide insight into the different mathematical functions that underlie the different phases of growth in humans [17], [18]. There are currently two growth models that are able to separate growth functions during puberty: the Infancy-Childhood-Puberty (ICP) model and the Quadratic-Exponential-Pubertal-Stop (QEPS) model [11], [12], [13], [14]. The ICP model allows a fixed quantity of specific pubertal growth in each individual and the clinician is able to adjust the timing of onset of puberty manually based on visual inspection of growth data [13], [14]. In the QEPS model, height gain during puberty can be variable between individuals, being described by growth related both to a puberty-specific P-function and to a basic QES function which reflects growth that arises independently of puberty. In this way, the QEPS model is able to adjust for individual differences in the timing (onset), tempo (height velocity), and amplitude (PHV and gain) of specific pubertal growth [13], [14]. In the present study, we use the QEPS model [13], [14] to construct a growth reference that can align individuals based on the onset of puberty, defined here as onset of the pubertal growth spurt.
The aim of this study was to develop a new type of reference for height during adolescence using the growth functions of the QEPS model; the goal was to produce a height reference that can be used to evaluate pubertal growth in a child, irrespective of the chronological age at which pubertal growth begins in that individual. The height references was constructed using data from a homogeneous longitudinally followed population of healthy children born at term to nonsmoking mothers and Nordic parents, selected from the GrowUp1990Gothenburg cohort born in Sweden in around 1990 [19]. The new references include mean values and SDS that allow alignment based on time/age at onset of pubertal growth spurt, and provide separate references for (i) total height (modeled by the Q, E, P, and S functions), (ii) height gain that is specific to puberty (by the P function), and (iii) height gain in the absence of growth specific to puberty (basic growth) (by the Q, E, and S functions). We also explore the usefulness of the new references for growth monitoring by analyzing subgroups of early, average, and late maturers as well as children with varying stature and body mass from the GrowUp1974Gothenburg cohort [2].
Materials and methods
Ethical approval
Ethical approval was obtained from the Regional Ethics Review Board in Gothenburg, (Ad 91-92/131-93 and Ad 444-08 T062-09). Informed consent was given by participants and parents of individuals <18 years of age. The studies were conducted by following the tenets of the Declaration of Helsinki.
Reference population
The population used to construct the pubertal growth reference, was selected from the entire cohort of GrowUp1990Gothenburg, Supplementary Table 1 [20] and was the same as used for the references for total and prepubertal height [19]. This included 1,572 healthy children (763 girls, Supplementary Table 2a; 809 boys, 2b) born between 1989 and 1991 at full term (gestational age, 37–43 weeks) [21] in Sweden to Nordic parents with nonsmoking mothers, for whom information on longitudinal growth until adult height was available. For more information, refer to the study by Albertsson-Wikland et al. [19].
Subgroups in the GrowUp1974Gothenburg cohort used for exploring the reference
To explore the utility of the new pubertal height reference as a research tool, data from healthy children from the GrowUp1974Gothenburg cohort were used [14]. In accordance with pubertal age: with early (<−1.5 years), average (±0.25 years), or late (>+1.5yrs) onset of puberty (Supplementary Table 3a, girls 3b, boys) when age at TPHV (PHV from the total growth curve) was used to estimate pubertal age [14]. In accordance with height: with tall (>+1.5 SDS) and short (<−1.5 SDS) stature at onset of puberty [2]. In accordance with childhood BMI: with high BMI (>+1.5 SDS) and with low BMI (<−1.5 SDS) at onset of puberty [22], [23].
QEPS method
In the present study, the QEPS model (see Supplementary Figures 1 and 2) was first used to construct a reference for total height in accordance with chronological age [19]. Thereafter, a new type of reference was generated for pubertal height designed so that growth could be aligned based on the onset of puberty for the individual, identified based on specific P-function growth, defined as when 5% of Pmax (AgeP5) was obtained. All longitudinal height curves for individuals in the reference population were aligned in accordance with AgeP5; refer to the studies by Nierop et al and Holmgren et al [13], [14] and Supplement for “Statistical evaluations”.
Results
New pubertal height references generated by aligning individual growth curves for onset of pubertal growth spurt
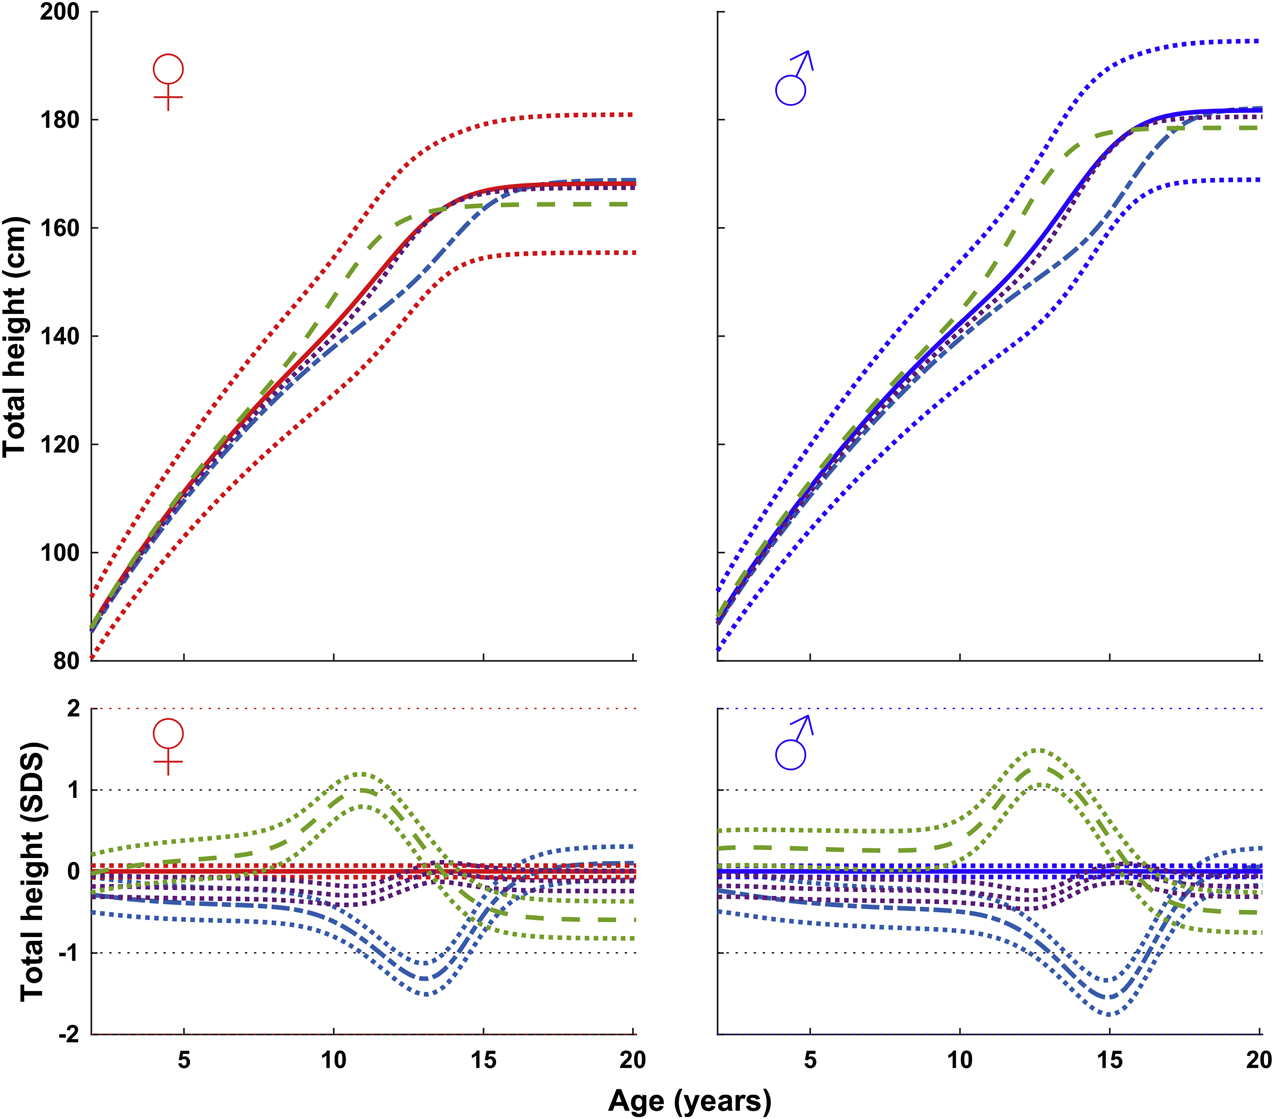
To construct a height reference for pubertal growth, the individual growth curves of the reference population were aligned relative to the age at the onset of the pubertal growth spurt (AgeP5%), shown in Figure 1, left for girls, right for boys (Supplementary Table 2a and 2b). The figure shows the references obtained for total height (T = QEPS–function), specific pubertal height (P-function height), and basic growth during puberty (pubertal QES-function-height), all in cm and SDS.

References for total height and height subdivided into that attained independently of puberty (basic growth = QES-function) and specific to puberty (P-function). Curves are aligned for age at onset of pubertal growth spurt. Girls, left upper part of figure: mean total height (red solid line) ±1 SDS (red dotted line), and ±2 SDS (red dashed line) and mean basic growth (black) QES. Boys, right upper part of figure for total (blue) and basic (black). Specific P-function-derived height as mean, ±1 SDS (dotted line), and ±2 SDS (dashed line). The individual onset of puberty was identified and aligned based on the age at which 5% (AgeP5) of the total/maximal specific P-function growth (Pmax) had occurred, Supplementary Table 2.
Exploring the usefulness of new pubertal height reference in research
For comparing children with early, average, or late puberty
Using height in accordance with chronological age to assess growth
Figure 2 shows height (cm and SDS) in accordance with age of girls and boys entering puberty at time points considered early, average, and late, on the new reference of total height presented for age. In the time window typically associated with puberty, the height curve was left shifted for children who enter puberty earlier than average and right shifted for children who entered puberty later than average. This broad variation in onset and development of the pubertal growth spurt within the reference population of healthy normally growing children highlights the limitation using an ordinary reference that considers only chronological age.
Mean total height in accordance with chronological age of girls (left) and boys (right) (in cm, top; in SDS with 95% CI, bottom) of early, <−1.5 years (- - -), average, ±0.25 years (• • •), and late, >+1.5 years (- ― -) pubertal maturers from GrowUp1974Gothenburg cohort. Data are visualized alongside the reference for total mean height (thick solid lines) and ±2 SDS (dotted red (left) and blue (right) lines).
Using the new puberty-aligned references to assess growth
Figure 3 for boys and Supplementary Figure 3 for girls show height (cm and SDS) relative to the time of onset of the pubertal growth spurt in children who entered puberty at early, average, and late time points. As seen, the observed variation in total pubertal height gain (early maturers gaining more and late maturers gaining less height than those with average pubertal timing) was owing only to differences in basic growth; height gained owing to the specific P-function did not differ between the groups (Supplementary Table 3). The duration of pubertal growth differed between the three groups; it was significantly longer in early maturers and shorter in late maturers when compared with the average group. Finally as seen, height both before puberty and at adult height differed between the three groups.

Mean total height (left panels), basic growth (middle panels), and specific pubertal growth (right panels) in accordance with time relative to onset of pubertal growth spurt in boys (in cm, top; in SDS with 95% CI, bottom) of early, <−1.5 years (- - -), average, ±0.25 years (• • •), and late, >+1.5 years (- ― -) pubertal maturers from the GrowUp1974Gothenburg cohort. Data are visualized alongside the new reference for total mean height (thick blue solid lines) and ±2 SDS (dotted blue lines).
For comparing children with tall and short stature
The heights of tall and short children were compared for girls, Figure 4, and for boys (Supplementary Figure 4). As seen, tall girls and boys gained more height during puberty owing to more basic growth than their shorter counterparts, despite attaining less specific pubertal growth. By contrast, short girls and boys gained less height during puberty due to undergoing less basic growth than their taller peers, despite experiencing more specific pubertal growth (compared with reference population).

Total, basic, and specific pubertal height (in cm, top; in SDS with 95% CI, bottom) in accordance with time relative to onset of pubertal growth spurt in girls of tall, >+1.5 SDS (- ― -) and short, <−1.5 SDS (- - -) statures. Mean total height (left panels), basic growth (middle panels), and specific pubertal growth (right panels) from the GrowUp1974Gothenburg cohort. Data are visualized alongside the new reference for total mean height (thick red solid lines) and ±2 SDS (dotted red lines).
For comparing children who were overweight and underweight
The heights of boys (Figure 5) and girls (Supplementary Figure 5) with high or low BMI during childhood were compared. In accordance with this puberty onset aligned height, obese and thin children were of similar prepubertal total height; however, their pattern of growth became different during puberty. Obese children showed less specific pubertal height gain than thin children, with an underlying low amount of specific P-function growth, and more basic growth (compared with the reference population). Thin children showed the opposite pattern.

Total, basic, and specific pubertal height (in cm, top; in SDS with 95% CI, bottom) in accordance with time relative to onset of pubertal growth spurt of boys with high BMI, >+1.5 SDS (- ― -) and low BMI, <−1.5 SDS (- - -) during childhood in accordance with time relative to onset of pubertal growth spurt in boys. Mean total height (left panels), basic growth (middle panels), and specific pubertal growth (right panels) in boys from the GrowUp1974Gothenburg cohort. Data are visualized alongside the new reference for total mean height (thick red solid lines) and ±2 SDS.
Using the new pubertal growth charts prospectively for an individual child
Until a computerized tool will be available, a manual procedure has to be undertaken to prospectively monitor pubertal growth for an individual child using the new P-age-growth charts developed from the pubertal age–adjusted reference. Specific pubertal height should be obtained by subtracting predicted basic height from measured total height (Figure 6). Thus, a growth chart with both total and prepubertal height references has to be used [2], [19], [24], [25]. See Supplemental text for pubertal age adjusting total height.
![Figure 6: A manual for prospective use of pubertal age–adjusted reference for total height. To find the height measurement at the chronological age (C-age) at which puberty started (see left traditional reference [19]), you can use the height increase from the individual prepubertal growth curve (as drawn above through the individual measuring points) in combination with secondary sex characteristics, early breast development stage B2 in girls (red, upper panels), or a testicular volume increase to 4-6 ml in boys (blue, lower panels). Here, you see the chosen age/time point being 8 years for a girl, and 13 years for a boy (left references for total and prepubertal height vs. C-age [19]). These heights (in cm) are then moved to age P-age = zero in the right reference, the pubertal age–adjusted reference vs. P-age. Thereafter, all measured heights are depicted (in cm) at ages/times recalculated in relation to this pubertal onset, i.e., P-age = zero in age in the right reference.](/document/doi/10.1515/jpem-2020-0127/asset/graphic/j_jpem-2020-0127_fig_006.jpg)
A manual for prospective use of pubertal age–adjusted reference for total height. To find the height measurement at the chronological age (C-age) at which puberty started (see left traditional reference [19]), you can use the height increase from the individual prepubertal growth curve (as drawn above through the individual measuring points) in combination with secondary sex characteristics, early breast development stage B2 in girls (red, upper panels), or a testicular volume increase to 4-6 ml in boys (blue, lower panels). Here, you see the chosen age/time point being 8 years for a girl, and 13 years for a boy (left references for total and prepubertal height vs. C-age [19]). These heights (in cm) are then moved to age P-age = zero in the right reference, the pubertal age–adjusted reference vs. P-age. Thereafter, all measured heights are depicted (in cm) at ages/times recalculated in relation to this pubertal onset, i.e., P-age = zero in age in the right reference.
Discussion
Principle finding
This study presents a new type of reference for height during adolescence which takes the broad individual differences in the timing of the pubertal growth spurt into account. To develop this new reference, the growth curves of carefully selected normally growing individuals were aligned based on the onset of the pubertal growth spurt using the QEPS model. The resulting growth reference allows growth in the individual to be viewed relative to children with similar maturation, regardless of chronological age. The underlying growth components presented, capture the impact of the different growth functions active during puberty: height gain specifically related to puberty, height gain owing to continuing basic growth that is independent of puberty, as well as total height gain during the pubertal period. Knowledge about how children are growing in accordance with the different growth functions will be helpful for understanding the normal regulation of growth and thereby pathophysiology. Furthermore, by taking into account individual differences in pubertal growth, using this new type of reference, leads to a paradigm shift in growth monitoring, allowing more precise assessment (both in cm and SDS) of normal and abnormal growth at any time point during puberty.
Usefulness of a reference separating the growth functions during puberty in research
The separation of total growth during puberty into underlying growth functions allows us to characterize growth in groups of children in more detail, looking for patterns in growth that may be biologically relevant. In the present study, we found differences in growth patterns between children in accordance with when they entered puberty, whether they were tall or short, obese or thin during childhood. Compared with the new reference population, we showed that both tall and obese children experienced more basic and less specific pubertal growth, as observed previously for overweight/obese children compared with their underweight peers [22]. We can speculate that the different growth functions that have been defined mathematically by the QEPS model (as done for the ICP model) reflect the complex hormonal regulation of growth [17].
Basic growth related to the Q-function may be regulated in a dose-dependent fashion by growth hormone [17], [18], [26], whereas the specific pubertal P-function may also require the actions of sex steroids, in particular estrogen. The successively increase in sex steroids during late childhood [27], [28] will give rise to responses in gonadal tissues [9], [10], [11], and in bone tissue alongside the pubertal growth spurt [29], [30]. In girls, the growth spurt parallels breast development as one of the earliest events, whereas in boys, the growth spurt comes after gonadal maturation. As estrogen levels increase further over time, levels become high enough to close the epiphysis in the long bones [31], and Q-function growth will stop; represented here by the S-function. Future studies will hopefully further explore the hormonal regulation of pubertal growth.
The usefulness of the new references was explored by visualizing the relationship between the age at onset of puberty and both the duration of pubertal growth and amount of height gained. We found the pubertal growth period to be longer in girls who entered puberty early compared with average timing of maturation. By contrast, the pubertal growth period was shorter in girls who were late entering puberty than in the average child as depicted by the new reference. This supports previous findings in girls entering puberty early, who were shown to experience a longer period between the “take off” of growth at the start of puberty and the completion of 95% of growth [32], [33], as well as an extended period for the development of secondary sex characteristics, with a longer duration between B2 and menarche, B2 and B5, and B2 and PHV [34], [35]. As a new finding, our results showed the duration of pubertal growth to be longer in boys with early compared with late maturation.
Historically, estimates of the total height gained during puberty suggested that early maturing children grew more during puberty, and late maturing children less, than children entering puberty at an average age [6]. We confirmed that early maturers gained more height during puberty than those entering puberty at an average age. Furthermore, the new analysis method resulted in the new finding that this difference arose owing to a greater amount of basic growth in early maturers, and not as a result of a greater specific pubertal growth. The opposite pattern was found in late maturers. Confirming earlier findings, our results also showed that the timing of puberty affected adult height, with early maturers being shorter as adults, and late maturers taller as adults, than those entering puberty at an average age [7], [14].
Prospective monitoring of growth in individual children using the new reference
The lack of an accurate and detailed measure (in SDS) of ongoing pubertal growth has been a major limitation when investigating the influences of diseases and their treatment during the pubertal period. Before the development of this new reference, it has only been possible to estimate overall height gain during puberty once growth was complete [36], by comparing the last prepubertal heightSDS (using prepubertal reference) and adult heightSDS (using adult height reference) [36]. This limitation is now overcome by using the reference presented here. Moreover, when prospectively monitoring pubertal growth in growing children, the zero point in the growth chart can be identified by the time point when the total growth starts to increase above expected growth based on the continuation of basic growth (Figure 6).
Future perspectives
Manual procedure is possible, but computerization of the references presented here will make them of greater use for growth monitoring within the clinic by generating a computerized estimation of the onset of puberty in still growing children. The QEPS model allows calculation of the precision of the individual parameters, considering the quality of data for each individual child. In prospective monitoring, automatic computation of onset of P-function growth is complex because many factors will influence, such as the CI of the basic growth and the time-distance between the actual height measurements. This will be valuable for developing tools for identifying abnormal growth during the pubertal years. So far, this has proven of high value in Finnish health care for prepubertal children [37], [38].
Strengths and limitations
One of the strengths of the new reference is that by using age of the individual at onset of puberty to align growth, the new reference is not affected by secular trends in onset of puberty [39], [40]. Thereby, the use of the references presented here can be explored for monitoring individual children from Sweden, other countries and ethnic groups during puberty, whereas studies in other populations of children will be needed to generalize differences on a group level.
It is, however, important to be aware that longitudinal measurements for individuals are needed to estimate the QEPS functions, and that the frequency of height measurements over time will influence precision of the determination of puberty parameters found. Even with frequent and regular measurement, there will remain a small number of individuals who do not experience a substantial pubertal growth spurt, for whom it will be challenging to identify the onset of puberty, irrespective of the method used. For such individuals, it will be important to consider the development of secondary sexual characteristics, something that was not explored in the context of the new reference. It remains for a future study to follow a population closely throughout puberty, looking at hormone levels and secondary sexual characteristics alongside growth estimates generated by the QEPS model.
Conclusions
In conclusion, we present the first height references covering the pubertal age range that consider individual variations in the timing and tempo of pubertal maturation and growth. Generation of these references was made possible by the different functions of the QEPS model, which allow the visualization of growth divided into that specific to puberty and that owing to basic growth arising independently of puberty. In research, it will now be possible to estimate growth by obtaining heightSDS in every period from the onset until the end of puberty based on group data. We here visualized the usefulness of the references by exploring growth in early, average, and late maturers, as well as individuals with different childhood stature or BMI, and identified differences in total pubertal gain owing to underlying different amount of the specific pubertal growth and/or of basic growth during puberty. More knowledge regarding pubertal growth will be possible to obtain when using this tool when for example reanalyzing growth data from already undertaken studies and clinical trials.
Funding source: Region Halland Grants
Funding source: Swedish Research Council
Award Identifier / Grant number: 7509
Funding source: Governmental grants under the ALF agreement
Award Identifier / Grant number: ALFGBG-719041, ALFGBG-812951
Funding source: Foundation Växthuset for Children
Acknowledgments
The authors are grateful for the contributions of the students of the 12th grade 1998/9 of Gothenburg area schools, and their school nurses; the study team led by Carola Pfeiffer-Mosesson and Annika Olsson; for Data support given by Lillemor Ljungberg and Bengt Bengtsson and for careful editing and language revision by Harriet Crofts.
Research funding: The authors acknowledge financial support from the Swedish Research Council (7509), the Governmental grants under the ALF agreement, ALFGBG-719041, ALFGBG-812951, the Region Halland Grants, and the Foundation Växthuset for children.
Author contributions: KAW is the principal investigator of the study populations used. AFMN performed the modeling work for the QEPS model described here and made the QEPS function estimations, reference values, and Figures 2–5, & Supplementary Figures 1–5. AN made Figure 1 & Figure 6, tables and statistics. KAW, AN, AH, LG, and AFMN have all made a substantial contribution to the conception, design, analysis and interpretation of these data. KAW wrote the first draft. All authors revised it critically for intellectual content and approved the final manuscript to be submitted for publication.
Competing interests: AFMN works for Muvara, Multivariate Analysis of Research Data, Statistical Consultation, the Netherlands. KAW, AN, AH, and LG declare that they have no competing interests.
Informed consent: Informed consent was given by participants and parents of individuals <18 years of age.
Ethical approval: Ethical approval was obtained from the Regional Ethics Review Board in Gothenburg, (Ad 91-92/131-93 and Ad 444-08 T062-09).
References
1. Cole, TJ. The development of growth references and growth charts. Ann Hum Biol 2012;39:382–94. https://doi.org/10.3109/03014460.2012.694475.Search in Google Scholar
2. Albertsson-Wikland, K, Luo, ZC, Niklasson, A, Karlberg, J. Swedish population-based longitudinal reference values from birth to 18 years of age for height, weight and head circumference. Acta Paediatr 2002;91:739–54. https://doi.org/10.1111/j.1651-2227.2002.tb03322.x.Search in Google Scholar
3. Who Multicentre Growth Reference Study Group, de Onis, M. WHO Child Growth Standards based on length/height, weight and age. Acta Pædiatrica 2006;95:76–85. https://doi.org/10.1111/j.1651-2227.2006.tb02378.x.Search in Google Scholar
4. de Onis, M, Onyango, AW, Borghi, E, Siyam, A, Nishida, C, Siekmann, J. Development of a WHO growth reference for school-aged children and adolescents. Bull World Health Organ 2007;85:660–7. https://doi.org/10.2471/blt.07.043497.Search in Google Scholar
5. Merrell, M. The relationship of individual growth to average growth. Hum Biol 1931;3:37–70.Search in Google Scholar
6. Tanner, JM, Whitehouse, RH, Takaishi, M. Standards from birth to maturity for height, weight, height velocity, and weight velocity: British children. 1965. I. Arch Dis Child 1966;41:454–71. https://doi.org/10.1136/adc.41.219.454.Search in Google Scholar
7. Tanner, JM, Davies, PS. Clinical longitudinal standards for height and height velocity for North American children. J Pediatr 1985;107:317–29. https://doi.org/10.1016/s0022-3476(85)80501-1.Search in Google Scholar
8. Carrascosa, A, Yeste, D, Moreno-Galdo, A, Gussinye, M, Ferrandez, A, Clemente, M, et al. [Pubertal growth of 1,453 healthy children according to age at pubertal growth spurt onset. The Barcelona longitudinal growth study]. Anales de pediatria 2018;89:144–52. https://doi.org/10.1016/j.anpede.2018.01.004.Search in Google Scholar
9. Marshall, WA, Tanner, JM. Variations in pattern of pubertal changes in girls. Arch Dis Child 1969;44:291–303. https://doi.org/10.1136/adc.44.235.291.Search in Google Scholar
10. Marshall, WA, Tanner, JM. Variations in the pattern of pubertal changes in boys. Arch Dis Child 1970;45:13–23. https://doi.org/10.1136/adc.45.239.13.Search in Google Scholar
11. Zachmann, M, Prader, A, Kind, HP, Hafliger, H, Budliger, H. Testicular volume during adolescence. Cross-sectional and longitudinal studies. Helv Paediatr Acta 1974;29:61–72.Search in Google Scholar
12. Addo, OY, Sarafoglou, K, Miller, BS. Effect of adjusting for tanner stage age on prevalence of short and tall stature of youths in the United States. J Pediatr 2018;201:93–9.e4. https://doi.org/10.1016/j.jpeds.2018.05.051.Search in Google Scholar
13. Nierop, AF, Niklasson, A, Holmgren, A, Gelander, L, Rosberg, S, Albertsson-Wikland, K. Modelling individual longitudinal human growth from fetal to adult life - QEPS I. J Theor Biol 2016;406:143–65. https://doi.org/10.1016/j.jtbi.2016.06.007.Search in Google Scholar
14. Holmgren, A, Niklasson, A, Gelander, L, Aronson, AS, Nierop, AFM, Albertsson-Wikland, K. Insight into human pubertal growth by applying the QEPS growth model. BMC Pediatr 2017;17:107. https://doi.org/10.1186/s12887-017-0857-1.Search in Google Scholar
15. Karlberg, J, Fryer, JG, Engstrom, I, Karlberg, P. Analysis of linear growth using a mathematical model. II. From 3 to 21 years of age. Acta Paediatr Scand 1987;337:12–29. https://doi.org/10.1111/j.1651-2227.1987.tb17122.x.Search in Google Scholar
16. Karlberg, J. On the modelling of human growth. Stat Med 1987;6:185–92. https://doi.org/10.1002/sim.4780060210.Search in Google Scholar
17. Hochberg, Z, Albertsson-Wikland, K. Evo-devo of infantile and childhood growth. Pediatr Res 2008;64:2–7. https://doi.org/10.1203/pdr.0b013e318177590f.Search in Google Scholar
18. Hochberg, Z. Evo-devo of child growth: treatise on child growth and human evolution, 1st ed. Wiley-Blackwell Publishers; Hoboken, New Jersey, 2012.10.1002/9781118156155Search in Google Scholar
19. Albertsson-Wikland, K, Niklasson, A, Holmgren, A, Gelander, L, Nierop, AFM. A new Swedish reference for total and prepubertal height. Acta Paediatr 2020;109:754–63. https://doi.org/10.1111/apa.15129.Search in Google Scholar
20. Sjöberg, A, Barrenäs, ML, Brann, E, Chaplin, JE, Dahlgren, J, Mårild, S, et al. Body size and lifestyle in an urban population entering adulthood: the ‘Grow up Gothenburg’ Study. Acta Paediatr 2012;101:964–72. https://doi.org/10.1111/j.1651-2227.2012.02722.x.Search in Google Scholar
21. Niklasson, A, Albertsson-Wikland, K. Continuous growth reference from 24th week of gestation to 24 months by gender. BMC Pediatr 2008;8:8. https://doi.org/10.1186/1471-2431-8-8.Search in Google Scholar
22. Holmgren, A, Niklasson, A, Nierop, AF, Gelander, L, Aronson, AS, Sjoberg, A, et al. Pubertal height gain is inversely related to peak BMI in childhood. Pediatr Res 2017;81:448–54. https://doi.org/10.1038/pr.2016.253.Search in Google Scholar
23. Karlberg, J, Luo, ZC, Albertsson-Wikland, K. Body mass index reference values (mean and SD) for Swedish children. Acta Paediatr 2001;90:1427–34. https://doi.org/10.1111/j.1651-2227.2001.tb01609.x.Search in Google Scholar
24. Tinggaard, J, Aksglaede, L, Sorensen, K, Mouritsen, A, Wohlfahrt-Veje, C, Hagen, CP, et al. The 2014 Danish references from birth to 20 years for height, weight and body mass index. Acta Paediatr 2014;103:214–24. https://doi.org/10.1111/apa.12468.Search in Google Scholar
25. Rikken, B, Wit, JM. Prepubertal height velocity references over a wide age range. Arch Dis Child 1992;67:1277–80. https://doi.org/10.1136/adc.67.10.1277.Search in Google Scholar
26. Albertsson-Wikland, K, Rosberg, S. Analyses of 24-hour growth hormone profiles in children: relation to growth. J Clin Endocrinol Metab 1988;67:493–500. https://doi.org/10.1210/jcem-67-3-493.Search in Google Scholar
27. Albertsson-Wikland, K, Rosberg, S, Lannering, B, Dunkel, L, Selstam, G, Norjavaara, E. Twenty-four-hour profiles of luteinizing hormone, follicle-stimulating hormone, testosterone, and estradiol levels: a semilongitudinal study throughout puberty in healthy boys. J Clin Endocrinol Metab 1997;82:541–9. https://doi.org/10.1210/jcem.82.2.3778.Search in Google Scholar
28. Ankarberg-Lindgren, C, Norjavaara, E. Twenty-four hours secretion pattern of serum estradiol in healthy prepubertal and pubertal boys as determined by a validated ultra-sensitive extraction RIA. BMC Endocr Disord 2008;8:10. https://doi.org/10.1186/1472-6823-8-10.Search in Google Scholar
29. Albin, AK, Niklasson, A, Westgren, U, Norjavaara, E. Estradiol and pubertal growth in girls. Horm Res Paediatr 2012;78:218–25. https://doi.org/10.1159/000343076.Search in Google Scholar
30. Albin, AK, Norjavaara, E. Pubertal growth and serum testosterone and estradiol levels in boys. Horm Res Paediatr 2013;80:100–10. https://doi.org/10.1159/000353761.Search in Google Scholar
31. Smith, EP, Boyd, J, Frank, GR, Takahashi, H, Cohen, RM, Specker, B, et al. Estrogen resistance caused by a mutation in the estrogen-receptor gene in a man. N Engl J Med 1994;331:1056–61. https://doi.org/10.1056/nejm199410203311604.Search in Google Scholar
32. Preece, MA, Baines, MJ. A new family of mathematical models describing the human growth curve. Ann Hum Biol 1978;5:1–24. https://doi.org/10.1080/03014467800002601.Search in Google Scholar
33. Vizmanos, B, Marti-Henneberg, C, Cliville, R, Moreno, A, Fernandez-Ballart, J. Age of pubertal onset affects the intensity and duration of pubertal growth peak but not final height. Am J Hum Biol 2001;13:409–16. https://doi.org/10.1002/ajhb.1065.Search in Google Scholar
34. Pantsiotou, S, Papadimitriou, A, Douros, K, Priftis, K, Nicolaidou, P, Fretzayas, A. Maturational tempo differences in relation to the timing of the onset of puberty in girls. Acta Paediatr 2008;97:217–20. https://doi.org/10.1111/j.1651-2227.2007.00598.x.Search in Google Scholar
35. German, A, Shmoish, M, Belsky, J, Hochberg, Z. Outcomes of pubertal development in girls as a function of pubertal onset age. Eur J Endocrinol 2018;179:279–85. https://doi.org/10.1530/eje-17-1025.Search in Google Scholar
36. Albertsson-Wikland, K, Aronson, AS, Gustafsson, J, Hagenäs, L, Ivarsson, SA, Jonsson, B, et al. Dose-dependent effect of growth hormone on final height in children with short stature without growth hormone deficiency. J Clin Endocrinol Metab 2008;93:4342–50. https://doi.org/10.1210/jc.2008-0707.Search in Google Scholar
37. Sankilampi, U, Saari, A, Laine, T, Miettinen, PJ, Dunkel, L. Use of electronic health records for automated screening of growth disorders in primary care. J Am Med Assoc 2013;310:1071–2. https://doi.org/10.1001/jama.2013.218793.Search in Google Scholar
38. Saari, A, Sankilampi, U, Hannila, ML, Kiviniemi, V, Kesseli, K, Dunkel, L. New Finnish growth references for children and adolescents aged 0 to 20 years: length/height-for-age, weight-for-length/height, and body mass index-for-age. Ann Med 2011;43:235–48. https://doi.org/10.3109/07853890.2010.515603.Search in Google Scholar
39. Holmgren, A, Niklasson, A, Nierop, AFM, Gelander, L, Aronson, AS, Sjoberg, A, et al. Estimating secular changes in longitudinal growth patterns underlying adult height with the QEPS model: the Grow up Gothenburg cohorts. Pediatr Res 2018;84:41–9. https://doi.org/10.1038/s41390-018-0014-z.Search in Google Scholar
40. Holmgren, A, Niklasson, A, Aronson, AS, Sjoberg, A, Lissner, L, Albertsson-Wikland, K. Nordic populations are still getting taller - secular changes in height from the 20th to 21st century. Acta Paediatr 2019;108:1311–20. https://doi.org/10.1111/apa.14683.Search in Google Scholar
Supplementary Material
The online version of this article offers supplementary material (https://doi.org/10.1515/jpem-2020-0127).
© 2021 Kerstin G. Albertsson-Wikland et al., published by De Gruyter, Berlin/Boston
This work is licensed under the Creative Commons Attribution 4.0 International License.
Articles in the same Issue
- Frontmatter
- Original Articles
- Variability of clinical and biochemical phenotype in liver phosphorylase kinase deficiency with variants in the phosphorylase kinase (PHKG2) gene
- Reference intervals for thyroid-stimulating hormone (TSH) and free thyroxine (FT4) in infants’ day 14–30 of life and a comparison with other studies
- Importance of thyroid-stimulating hormone levels in liver disease
- Assessment of thyroid gland vascularity with superb microvascular imaging in healthy children and its relationship with potential factors
- A retrospective analysis of congenital anomalies in congenital hypothyroidism
- Impact of parental origin of X-chromosome on clinical and biochemical profile in Turner syndrome
- Readiness for transition to adult care in adolescents and young adults with Turner syndrome
- A new type of pubertal height reference based on growth aligned for onset of pubertal growth
- Role of urinary NGAL and KIM-1 as biomarkers of early kidney injury in obese prepubertal children
- Self-assessed puberty is reliable in a low-income setting in rural Pakistan
- Timing and regimen of puberty induction in children with hypogonadism: a survey on the practice in Arab countries
- How useful are anthropometric measurements as predictive markers for elevated blood pressure in adolescents in different gender?
- Association between handgrip strength and cardiovascular risk factors among Korean adolescents
- Case Reports
- A novel GNAS mutation inherited from probable maternal mosaicism causes two siblings with pseudohypoparathyroidism type 1A
- Two intronic variants of CYP11B1 and CYP17A1 disrupt mRNA splicing and cause congenital adrenal hyperplasia (CAH)
- Case report: a 10-year-old girl with primary hypoparathyroidism and systemic lupus erythematosus
- Homozygous p.R31H GNRH1 mutation and normosmic congenital hypogonadotropic hypogonadism in a patient and self-limited delayed puberty in his relatives
- Severe diabetic ketoacidosis and coronavirus disease 2019 (COVID-19) infection in a teenage patient with newly diagnosed diabetes