Validation of cognitive and neuromuscular latencies using an iPad-based tool to quantify simple reaction times in asymptomatic subjects
-
 and
and

Abstract
Context
Simple reaction times (SRTs), measured in milliseconds (msec), are equal to the sum of subject-dependent latencies that occur during cognitive processing and neuromuscular responses to a preprogrammed stimulus presented to a subject. SRTs have the advantage of being a relatively pure, neurologically driven motor/sensory task that provides a clinician with a generalized assessment of functional deficits. SRTs are easily obtained, and studies have reported that the average number of finger-taps during a 10-s interval can be utilized to distinguish between patients with mild traumatic brain injury (TBI) and healthy controls.
Objectives
A stimulus/response SRT protocol, utilizing an iPad-based tool, was utilized to see if differentiation and quantification of individual components of cognitive latency (CL) and neuromuscular latency (NL) from a subject’s total SRT could be accomplished. The study hypothesis was that cognitive latencies, related to a specific cognitive challenge, would remain constant even as latencies due to neuromuscular challenges changed.
Methods
Two categories of SRT tests were utilized. The first was a simple finger tapping test (FTT), without any cognitive involvement, that was designed to quantify pure NL. The second test was a choice test (CT) that was characterized by the addition of a cognitive task to the FTT. The objective of the FTT was for the subject to simply tap a single target positioned on the iPad screen as fast as possible over an interval of 10 s. Measurement of the SRT began when a target was displayed and ended when the target was tapped. Two levels of challenge for the FTT and CT tests were presented to the subjects: a small random displacement (SD) of the target of up to 6 mm, and a large random displacement (LD) of the target of up to 24 mm. It was expected that the magnitude of the SRT (FTT) would be directly related to the magnitude of the displacement of the target due to kinematic response characteristics of the hand and arm.
Results
To validate the study hypothesis, CL for both small and large displacements was calculated by subtracting the respective NL from the total SRT. Utilizing a repeated measures t-test analysis utilizing SPSS, a significant difference between CL (SD) and CL (LD) at p=0.696 was not observed.
Conclusions
Differentiation and quantification of individual components of CL and NL from a subject’s total SRT was accomplished. An Apple iPad Pro was selected as a platform for our study because: (1) it is readily available, affordable, and programmable; (2) it meets a requirement for portability; and (3) it allows the modification/addition of test parameters to meet future needs. The ability to quantify the extent of cognitive and neuromuscular dysfunction in the TBI patient is an essential component of developing an effective treatment plan.
Simple reaction times (SRTs), measured in milliseconds (msec), are equal to the sum of subject-dependent latencies that occur during cognitive processing and neuromuscular responses to a preprogrammed stimulus presented to a subject [1].
SRTs have the advantage of being a relatively pure, neurologically driven motor/sensory task and have been shown to increase in individuals who have experienced a traumatic brain injury (TBI). SRTs are easily obtained, and studies have reported that the average number of finger-taps during a 10-s interval can be utilized to distinguish between patients with mild TBI and healthy controls. Prigatano and Borgaro [2] compared the qualitative and quantitative performance on the Halstead-Reitan Finger Tapping test of 65 patients diagnosed with TBI with 15 normal controls. They reported that the control group tapped their finger faster than the TBI group and that the correlation between the mean speed of finger tapping in TBI patients and the time since injury was significant for both the dominant (r=−0.371, p=0.002) and the nondominant hands (r=−0.538, p=0.000).
SRTs are dependent upon latencies due to cognitive and neuromuscular processes and can provide a clinician with a generalized assessment of functional deficits. Latency, which is the time between successive finger-taps, has been found to increase in experienced boxers and soccer players who frequently “headed” the ball when compared to controls. Murelius and Haglund [3] tested three groups of 25 individuals, each quantified from a subject’s total S of which had participated in high-match (HM) boxing, low-match (LM) boxing, and LM soccer. They found a statistically significant difference in finger-tapping performance between groups. Specifically, the HM-boxer group showed increased latency at p<0.05 with the dominant hand and p<0.001 with the nondominant hand. Another study’s findings suggest that the overall performance of patients diagnosed with TBI is apparent in both their visual response as well as the purely motor response of finger tapping that was not seen in the control group (n=40, p<0.0001) [4].
A stimulus/response protocol, utilizing an iPad-based tool (Figure 1), was tested to see if individual components of cognitive latency (CL) and neuromuscular latency (NL) could be differentiated and quantified from a subject’s total SRT (Equation 1).
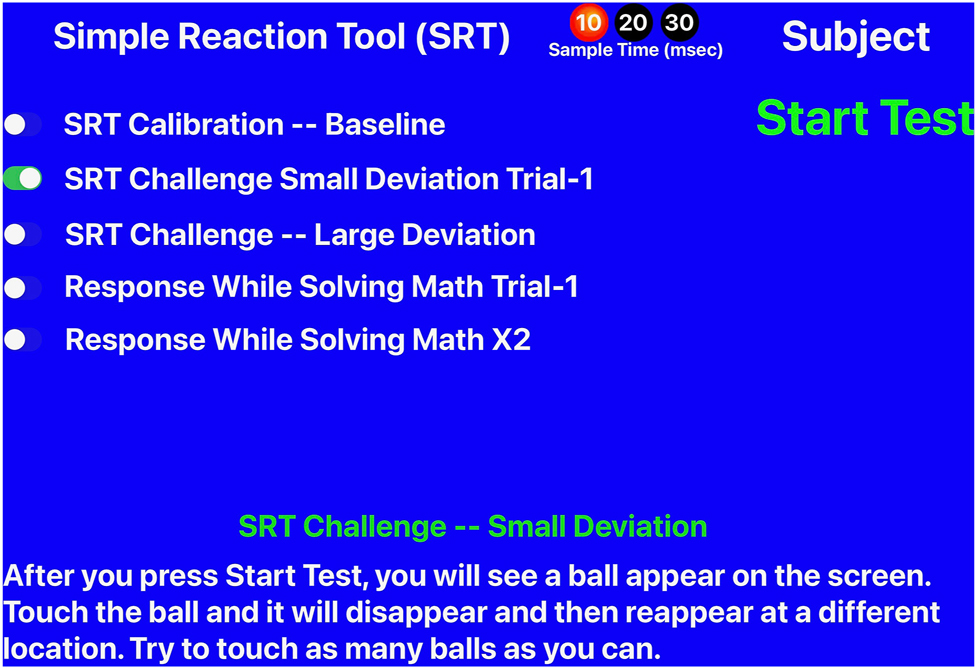
Simple reaction tool home page.
The study hypothesis was that cognitive latencies, related to a specific cognitive challenge, would remain constant even as latencies due to neuromuscular challenges changed. The ability to identify and quantify the extent of cognitive and neuromuscular dysfunction in the TBI patient is an essential component of developing an effective treatment plan.
Methods
A total of 28 subjects were enrolled in the study between November 4, 2019 and November 25, 2019, with all 28 subjects finishing the study. The study was reviewed and approved by the Michigan State University Human Research Protection Program (STUDY00001620). Subjects consisted of an asymptomatic cohort of first- and second-year medical students recruited from Michigan State University’s College of Osteopathic Medicine (MSUCOM). Their involvement was voluntary, and no compensation was provided. At their first visit, the purpose of the study was explained to them. All potential subjects were then required to read the Informed Consent Form and encouraged to ask any questions that they may have had. Subjects were enrolled in the study after signing the Consent Form.
Two categories of tests were utilized. The first was a simple finger tapping test (FTT) designed to quantify pure NL (Figure 2). The second was a cognitive test (CT) that required a subject to solve a simple math equation (Figure 3). The equations were limited to addition and subtraction of numbers that would result in answers of less than 10. Subjects were allowed to familiarize themselves with each of the two tests.

The simple reaction tool showing the simple math exercise screen.

The simple reaction tool showing the orientation of the arm and forearm relative to the iPad screen.
The objective of the FTT was to measure the value of NL by having the subject simply tap a single target positioned on the iPad screen as fast as possible over an interval of 10 s. Measurements began when a target was displayed and ended when the target was tapped. The FTT had two levels of challenge: a small random displacement (SD) of the target of up to 6 cm, and a large random displacement (LD) of the target of up to 24 cm. After tapping the target, the iPad program presented the subject with a new target located in a new position on the iPad screen.
The objective of the choice test (CT) was for the subject to repeatedly solve a simple mathematical equation and then tap a target on the iPad screen containing the correct answer as fast as possible. Answers were presented to the subject on three targets, and only one of the targets contained the correct answer (Figure 3). Subjects were instructed to solve the equation and then to tap the target displaying the correct answer. The measurement began when a new math problem was displayed and ended when the target was tapped. The CT also had two levels of challenge: a small random displacement (SD) of all three targets of up to 6 cm and a large random displacement (LD) of all three targets of up to 24 cm with only one target displaying the correct solution to the equation. After tapping the target, the iPad program presented the subject with a new math problem and a new set of three targets was positioned on the iPad screen. The levels of displacement of the new targets were a function of the level of challenge.
Once the data were collected, SPSS (IBM SPSS Statistics for Windows, Version 28.0.1.0) was utilized to test for the statistical significance of the average latency between small and large displacements of targets for both the FTT and the CT tests.
Results
The following values of average latency for SRT (FTT) were measured for the FTT (Table 1). Utilizing the repeated-measures t-test analysis in SPSS, a significant difference was observed between the values of the average latency of the two target displacements at p<0.001 (Figure 4).
Average latency and standard deviation measured between the presentation of a stimulus and a subject’s response as a function of small (SD) and larger (LD) target displacement for the FTT.
| Average latency, ms | |
|---|---|
| FTT, SD | 443 (27.3) |
| FTT, LD | 654 (81.2) |
-
FTT, finger tapping test; LD, large random displacement; ms, millisecond; SD, small random displacement.
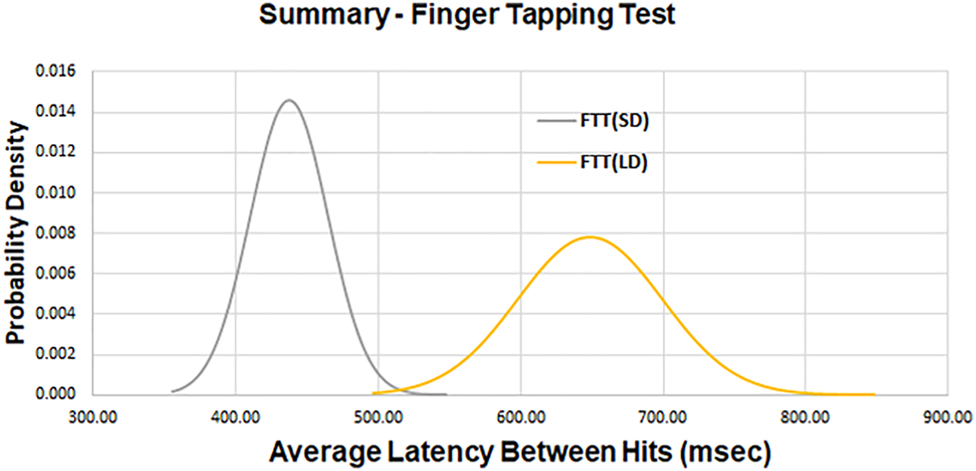
A composite plot of the average latency for two levels of target displacement for the finger tapping test (FTT). There is a significant difference at p<0.001 between the average latency of the two target displacements.
The following values of average latency for SRT (CT) were measured for the CT (Table 2). Utilizing the repeated measures t-test analysis in SPSS, a significant difference was observed between the values of the average latency of the two target displacements at p<0.001 (Figure 5).
Average latency and standard deviation measured between the presentation of a stimulus and a subject’s response as a function of small (SD) and large (LD) target displacement for the CT.
| Average latency, ms | |
|---|---|
| CT, SD | 1,174 (264.2) |
| CT, LD | 1,412 (528.3) |
-
CT, choice test; LD, large random displacement; ms, millisecond; SD, small random displacement.
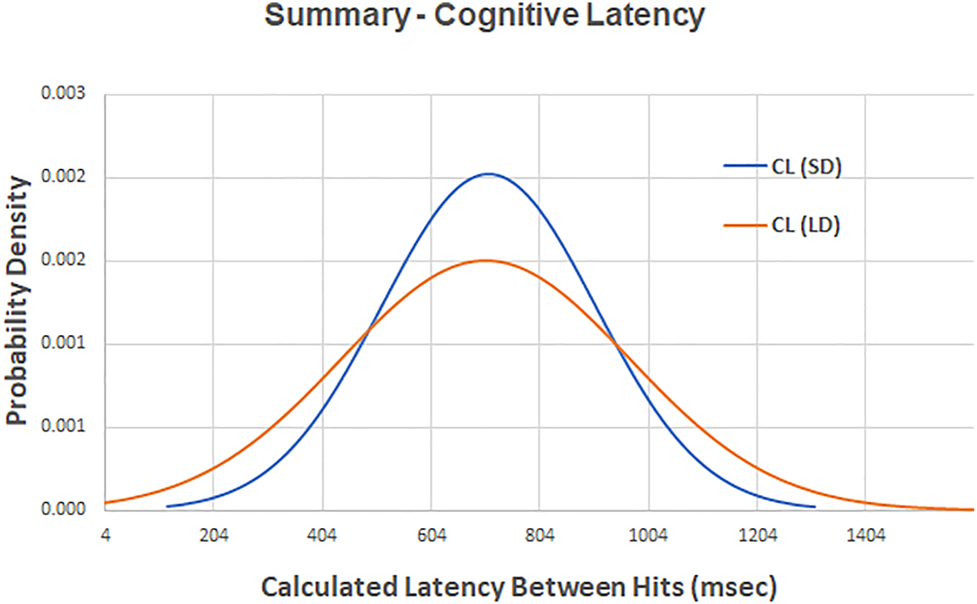
A composite plot of the calculated cognitive latency (CL) for two levels of target displacement. There is not a significant difference between the value of CL for small random displacements (SD) and CL for large random displacements (LD) at p=0.696.
The magnitude of CL for both small and large displacements was calculated by subtracting the respective NL from the total SRT of the respective CT (Equations 2 and 3) (Table 3).
Cognitive latency (CL) for both small (SD) and large (LD) displacements calculated by subtracting the respective NL from the total SRT (see Equation 3).
| Cognitive latency (CL, ms) | |
|---|---|
| CT, SD | 731 |
| CT, LD | 758 |
-
CL, cognitive latency; LD, large random displacement; ms, millisecond; NL, neuromuscular latency; SD, small random displacement; SRT, simple reaction time.
Utilizing the repeated-measures t-test analysis in SPSS, a significant difference was not observed between CL (SD) and CL (LD) at p=0.696 (Figure 6).
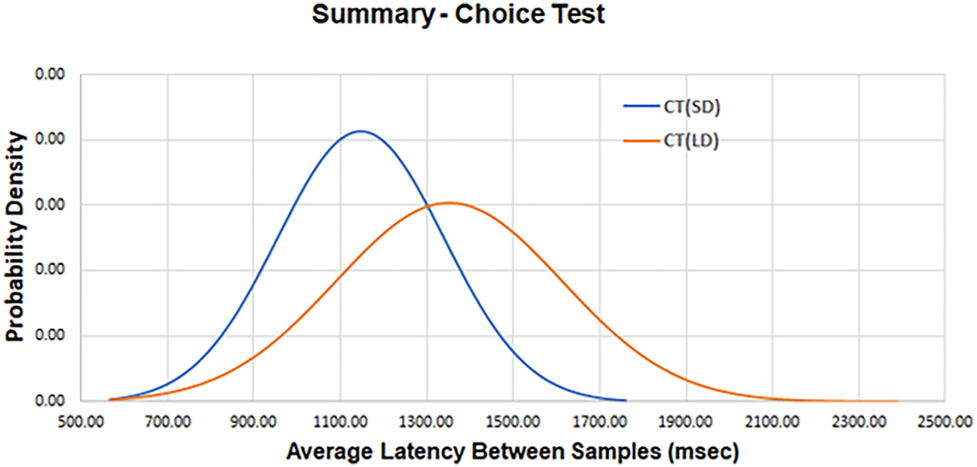
A composite plot of the average latency for two levels of target displacement for the choice test (CT). There is a significant difference at p<0.001 between the average latency of the two target displacements.
Discussion
The results of this study are significant because they show that a modified FTT can be utilized to evaluate cognitive function as well as the neuromuscular reflex response. The study hypothesis was that cognitive latencies, related to a specific cognitive challenge, would remain constant even as neuromuscular latencies changed. In order to calculate NL, subjects were first presented with a target randomly positioned on an iPad screen. They were instructed to tap the target with their forefinger. After tapping the target, the iPad program presented the subject with a new target randomly positioned on the screen. Subjects were instructed to continue to tap the target as fast as possible for 10 s. Displacing the target between finger taps resulted in latencies that were a direct consequence of additional loading of the central nervous system (CNS). This resulted from the need to calculate the trajectory necessary to move the finger from the current location of the target to a new location.
To accomplish this, the eyes need to move rapidly to locate the target (otherwise known as “saccades”). The prefrontal cortex would then organize a motor plan for tapping the finger and then pass it to the motor cortex for execution. Working in conjunction with the cerebellum, the signal from the motor cortex would result in a smooth wrist flexion and finger tap. Mechanoreceptors in the fingertips, specifically Meissner’s corpuscles and Merkel’s discs, would detect the finger tap, producing action potentials that travel back up the spinal cord, through the thalamus, and ultimately into the somatosensory cortex in the parietal lobe [5], where the sensation of touch would be recognized by the brain, resulting in extension of the wrist and finger. Meanwhile, software written for the iPad sensed when the target had been tapped, causing the target to disappear and providing visual feedback to the subject. The iPad software then calculated the value of NL between the time when the target first appeared, and the time when the subject tapped the target. The process was then repeated until the end of the 10-s period.
Increasing the challenge presented to the subject from a small random displacement to a large random displacement requires an increase in time to acquire the target and an increase in time to plan/execute movement. We anticipated that the additional time required to process these variables contributed to the increased latency times seen in the FTT (SD) and FTT (LD) groups (Figure 4). Because the value of displacement for FTT (SD) is small, it was assumed that latency associated with movement of the mass of the hand and arm could be ignored. Utilizing our experimental values, the latency between a change in target position and the initiation of hand movement was calculated to be equal to 333 ms. This compares favorably with a reported value of 326 ms (±31, SD) for monkeys (n=2) [6].
Our study added a CT to the basic FTT protocol to expand its utility beyond calculating just neuromuscular latency (NL) in order to enable the calculation of cognitive latency (CL). The CT required a subject to solve a mathematical problem and then to visually locate a randomly positioned target that displayed the correct answer. Solving the problem had to occur before the subject’s brain could generate the trajectory necessary to move their forefinger to the new target position. This is an example of serial processing, as opposed to parallel processing [7], in which the SRT is equal to the sum of the average latency necessary to process the mathematical equation of the CT and the average latency to process the neuromuscular response of the FTT. To test the study hypothesis, the value of CL was calculated, for both SDs and LDs, by subtracting the respective NL from the total SRT. Our values of CL (SD)=731 msec and CL (LD)=758 msec compare favorably with reported values (n)=20, average=888 msec (±72 SD) [8]. It was seen that there was no significant statistical difference between the values of CL for an SD or an LD of target displacement (Figure 6). The study hypothesis that cognitive latencies, related to a specific cognitive challenge, would remain constant even as latencies due to neuromuscular challenges changed, was verified. It is not surprising that CL associated with solving a mathematics equation would be independent of latencies due to target displacement because they depend upon different neural processes.
Now that COVID-19 issues have been reduced, we hope to recruit subjects diagnosed with TBI to test the iPad-based tool to see if it provides an advantage for the management of patient treatment. The ability to track cognitive and neuromuscular latencies over time should allow assessment of the effectiveness of a treatment plan as well as a metric to help gauge when patient progress has reached a plateau.
Limitations
The study has several limitations. It was not possible to recruit a group of patients who had been diagnosed with TBI due to COVID-19 virus restrictions. Initial work with a single TBI patient revealed that the 10-s interval does not allow enough responses from the patient to allow discrimination between simple reflex responses and responses that are delayed due to cognitive load. It would have been desirable to compare different cognitive challenges to determine if the SRT remained constant across protocols. We utilized only visual challenges. It would be expected that audio challenges would involve different neural pathways and could provide additional assessment of brain-processing capabilities. Subjects were expected to tap the target with their index finger as fast as they could. This can be accomplished with the wrist and hand stabilized so that only the forefinger, at the metacarpophalangeal (MCP) joint, moved. Alternatively, it can be performed with the forearm stabilized so that tapping of the forefinger is accomplished by flexion/extension of the wrist. It is not known if one strategy is faster or slower than the other.
Conclusions
An analytic model for a specific SRT test has been formulated, and software programs have been developed, for an iPad-based tool that enables the separation and quantification of normative components of the SRT that are due to neuromuscular and cognitive latencies. Validating baseline values for subject-dependent latencies of the SRT utilizing asymptomatic subjects allows for future testing against a cohort of subjects diagnosed with TBI. By measuring latency under controlled conditions, it is hoped that this SRT tool will aid in the identification of regions of the brain that have a functional deficit due to a traumatic event, enabling focused rehabilitation efforts specifically tailored for the individual patient.
-
Research funding: None reported.
-
Author contributions: Both authors provided substantial contributions to conception and design, acquisition of data, or analysis and interpretation of data; R.H. drafted the article or revised it critically for important intellectual content; both authors gave final approval of the version of the article to be published; and both authors agree to be accountable for all aspects of the work in ensuring that questions related to the accuracy or integrity of any part of the work are appropriately investigated and resolved.
-
Competing interests: None reported.
-
Ethical approval: The study was reviewed and approved by the Human Research Protection Program at Michigan State University (STUDY00001620).
References
1. Woods, DL, Wyma, JM, Yund, EW, Herron, TJ, Reed, B. Factors influencing the latency of simple reaction time. Front Hum Neurosci 2015;9:131–12. https://doi.org/10.3389/fnhum.2015.00131. PMID: 25859198.Search in Google Scholar PubMed PubMed Central
2. Prigatano, GP, Borgaro, SR. Qualitative features of finger movement during the Halstead finger oscillation test following traumatic brain injury. J Int Neuropsychol Soc 2003;9:128–33. https://doi.org/10.1017/S1355617703000134. PMID: 12570365.Search in Google Scholar PubMed
3. Murelius, O, Haglund, Y. Does Swedish amateur boxing lead to chronic brain damage? 4. A retrospective neuropsychological study. Acta Neurol Scand 1991;83:9–13. https://doi.org/10.1111/j.1600-0404.1991.tb03952.x. PMID: 2011947.Search in Google Scholar PubMed
4. Geldmacher, DS, Hills, EC. Effect of stimulus number, target-to-distractor ratio, and motor speed on visual spatial search quality following traumatic brain injury. Brain Inj 1997;11:59–66. https://doi.org/10.1080/026990597123818. PMID: 9012552.Search in Google Scholar PubMed
5. Raju, H, Tadi, P. Neuroanatomy, somatosensory cortex. In: StatPearls [Internet]. Treasure Island (FL): StatPearls Publishing; 2022. Available from: https://www.ncbi.nlm.nih.gov/books/NBK555915/ [Accessed 14 Nov 2021].Search in Google Scholar
6. Archambault, PS, Caminiti, R, Bttaglia-Mayer, A. Cortical mechanisms for online control of hand movement trajectory: the role of the posterior parietal cortex. Cerebr Cortex 2009;19:2848–64. https://doi.org/10.1093/cercor/bhp058. PMID: 19359349.Search in Google Scholar PubMed
7. Fischer, R, Plessow, F. Efficient multitasking: parallel verses serial processing of multiple tasks. Front Psychol 2015;6:1–11. https://doi.org/10.3389/fpsyg.2015.01366. PMID: 34823209.Search in Google Scholar PubMed PubMed Central
8. Kawabata, M, Lee, K, Choo, HC, Burns, SF. Breakfast and exercise improve academic and cognitive performance in adolescents. Nutrients 2021;12:1278. https://doi.org/10.3390/nu13041278. PMID: 33924598.Search in Google Scholar PubMed PubMed Central
© 2022 the author(s), published by De Gruyter, Berlin/Boston
This work is licensed under the Creative Commons Attribution 4.0 International License.
Articles in the same Issue
- Frontmatter
- Innovations
- Brief Report
- Validation of cognitive and neuromuscular latencies using an iPad-based tool to quantify simple reaction times in asymptomatic subjects
- Medical Education
- Original Article
- The assessment of point-of-care-ultrasound (POCUS) in acute care settings is benefitted by early medical school integration and fellowship training
- Musculoskeletal Medicine and Pain
- Review Article
- Lower trapezius muscle function in people with and without shoulder and neck pain: a systematic review
- Neuromusculoskeletal Medicine (OMT)
- Review Article
- Impact of osteopathic manipulative techniques on the management of dizziness caused by neuro-otologic disorders: systematic review and meta-analysis
- Pediatrics
- Original Article
- Racial discrimination among children in the United States from 2016 to 2020: an analysis of the National Survey of Children’s Health
- Public Health and Primary Care
- Clinical Practice
- Conquering diabetes therapeutic inertia: practical tips for primary care
- Clinical Images
- Isolated nevus unius lateralis in a patient from Uganda
- Perichondritis: a case of swollen ear