Sustainable software development in science – insights from 20 years of Vanted
-
Falk Schreiber
 ,
Tobias Czauderna
,
Tobias Czauderna
 ,
Dimitar Garkov
,
Niklas Gröne
,
Karsten Klein
,
Dimitar Garkov
,
Niklas Gröne
,
Karsten Klein

Abstract
Sustainable software development requires the software to remain accessible and maintainable over long time. This is particularly challenging in a scientific context. For example, fewer than one third of tools and platforms for biological network representation, analysis, and visualisation have been available and supported over a period of 15 years. One of those tools is Vanted, which has been developed and actively supported over the past 20 years. In this work, we discuss sustainable software development in science and investigate which software tools for biological network representation, analysis, and visualisation are maintained over a period of at least 15 years. With Vanted as a case study, we highlight five key insights that we consider crucial for sustainable, long-term software development and software maintenance in science.
1 Introduction
Sustainable software development in science, that is long term development and maintenance of research software, is a challenging endeavour. It typically involves creating tools for data representation, integration, analysis, simulation, visualisation, and the communication of results for specific projects or research questions. At the same time, those tools should maintain accuracy, ensure reproducibility, provide ease of use and support long-term usability including proper licenses. For example, scientific results published in papers can often only be reproduced if the software used is still available and usable.
There are many software packages and workflows that have been developed to solve scientific questions, but few have successfully achieved long-term sustainability. There are several reasons for this, including that scientific projects and related software development are often only funded through short-term research grants, and that software maintenance does not significantly contribute to the career advancement of those involved. While the emphasis on publishing research papers remains strong and research software development is still often undervalued as a research activity, this issue was particularly problematic in the past. Other reasons are that there is often insufficient institutional support for long-term software maintenance, and that software is frequently developed by different research groups independently and without joining forces. As a result it is often difficult to create, maintain, improve, and use software effectively over the span of at least 15–20 years.
As example for sustainable and FAIR research software development, we will provide an overview of positive examples for software tools in the field of biological network representation, analysis, and visualisation that are still maintained after 15 years. Further, we will use Vanted (Visualisation and Analysis of Networks comprising Experimental Data) as a case study of software developed over the past 20 years. Vanted is a tool that was originally designed for the analysis and visualisation of biological networks and related data. Over the years, it has been developed into a software resource in various fields, particularly in systems biology, bioinformatics, and related disciplines. We will explore how Vanted is a model of sustainable software development in science, and investigate its design principles, development, community involvement, and adaptability to meet the changing needs of its user base. We will share the lessons learned, offering guidelines for sustainable software development.
The topic of this paper aligns very well with the 20th anniversary of the Journal of Integrative Bioinformatics (and this special issue dedicated to this event), in particular as: (1) the journal promotes software accessibility since its inception and provides with JIB.tools an environment for that [1], 2], (2) integrative bioinformatics is an important aspect of the Vanted development, for example, by novel ways for data integration, and (3) Vanted itself is as old as the journal.
2 Evolution of software development
Vanted incorporates key concepts of modern software development as outlined at the end of this section. Here we will give a very brief overview of the evolution of software development, which has been driven by technological advances, growing complexity in hardware and software, and changing user needs. Further, scientific software development progressed in parallel to, and was influenced by, the transition of pen and paper science to initial implementations and then to tools and libraries to provide software for reproduction and replicability [3].
Software development has been changed over time, and each phase can be characterised by specific challenges and methodologies:
The 1940s: Software development started when the first programmable computers were invented. At that time, software and hardware were not really considered distinct parts, as programming was closely tied to the physical design of the computers. Early universally programmable computers such as Zuse Z3 (1941) [4], ENIAC (1943–1946) [5], and UNIVAC I (1951) [6] were programmed low level using machine-specific code, therefore programs could not be easily transferred between different machines.
The 1950s: First high-level programming languages such as Fortran for scientific and engineering calculations (started 1953, first implementation 1957) and LISP for symbolic computation and (early) artificial intelligence research (started 1958, first implementation 1960) were developed. Those languages helped separating hardware from software, enabling programs to be written independently of the underlying computer architecture, and therefore making software development more general and improving portability across different computer systems.
The 1960s and 1970s: Due to increasing software complexity, the focus shifted towards improving software design and development methodologies, such as the imperative programming paradigm. This included declarative programming which emphasised creating programs in ways that were easier to write, understand, debug, and maintain. Moreover, object-oriented programming emerged as a paradigm that organises code into objects, which encapsulate both data and behaviour. The object-oriented approach has had significant impact on the development of modern software, improving modularity, code reusability, and maintainability. The term software engineering was already coined in the 1960s [7], but it was only later that this field gained wider influence.
The 1980s and 1990s: There was an increasing need for more formal software engineering practices to deal with issues such as software project management, platform independence, quality assurance, and scalability. Therefore, the concept of the software development lifecycle was developed. The waterfall model, one of the first formalised models, was introduced by Winston Royce in 1970 [8]. Although even Royce himself commented that it had major problems as testing only happened at the end of the process, it became a standard approach for many software projects. The problems of the waterfall model later led to the development of iterative and incremental models of software development such as Agile software development [9]. While approaches and frameworks such as Agile and Scrum gained widespread adoption, the “Agile is dead” discussion during the 2020s highlights ongoing debates about their relevance and effectiveness. More generally, many practices designed for commercial software development cannot be directly transferred to academic environments, which face unique challenges and aims.
The 2000s: The new millennium brought a great availability of open-source software. This changed the landscape of software development, enabling easier collaboration, reuse of code, and joint software development. Linux, the computer operating system created by Linus Torvalds and first released in 1991, is a prominent success story of the open-source movement. An important aspect of open-source software development is the community-driven development, where users and developers actively contribute to improve the software.
As we will discuss in more detail later, Vanted incorporates key concepts of modern software development:
Vanted is built on an object-oriented approach (using Java) that promotes code reusability, modularity, and maintainability.
Its development follows an iterative and incremental software engineering model that makes it easy to adapt to new projects and challenges.
The software is open-source to promote free use and community-driven development.
3 Rules and recommendations for good software development in science
What defines good modern software development, in particular the development of research software in science? How can flexibility, collaboration, and continuous improvement be fostered, and how can proper, maintainable code and an user-centric design be promoted? A wealth of literature exists on this topic, including guidelines for software development in science, such as the Ten Simple Rules for the Open Development of Scientific Software [10] which, in short, state:
Rule: Don’t Reinvent the Wheel
Rule: Code Well
Rule: Be Your Own User
Rule: Be Transparent
Rule: Be Simple
Rule: Don’t Be a Perfectionist
Rule: Nurture and Grow Your Community
Rule: Promote Your Project
Rule: Find Sponsors
Rule: Science Counts
Recently, the FAIR4RS initiative has introduced the FAIR principles for research software [11] in an attempt to tackle some of the challenges underlying current research software. In the context of research software FAIRification, the R set of principles advises software and its components to be usable and reusable. It is evident that research software management differs from research data management [11]. For research software to remain (re-)usable over time, it should be designed, implemented, and maintained as such continuously from the start.
While we concur with those guidelines, there are still crucial aspects that require greater attention, particularly concerning software sustainability over extended periods (15–20 years). Based on our two decades of experience developing Vanted, we would like to highlight the following additional recommendations:
Recommendation: Long-Term Design and Adaptability
Recommendation: Continuous Contribution to Science: Research in the Application Domain(s)
Recommendation: Continuous Contribution to Science: Research in the Computer Science Domain
Recommendation: Open-Source Nature and Community Contribution
Recommendation: User-Centric Development and Support
Before discussing the details of our five recommendations, we will first provide an example of software sustainability in practice by examining tools for biological network representation, analysis and visualisation over the past 15 years in Section 4. Next, in Section 5, we will give an overview of the Vanted system, its architecture and its usage. We will present the five recommendations in Sections 6–10, supported by examples from the development of the Vanted software. We conclude with Section 11 to discuss our findings, outline further Vanted developments and present more details of the connection between 20 years of Vanted and to the 20 years of the Journal of Integrative Bioinformatics.
4 The reality of software sustainability – an example from biological network analysis and visualisation
In 2009, some of the authors conducted an unpublished study of available tools for biological network representation, analysis, and visualisation based on an extensive literature and web search. This collection was based on aspects such as data exchange (importing/exporting networks), dynamic visualisation (layout of nodes and edges, editing capabilities), visualisation elements (data representation using colour-coding, variations in node sizes or edge thickness), and data analysis (network analysis, statistics). The aim in 2009 was to extend the scope of earlier work by Pavlopoulos et al. [12] which tried to cover a broad range of use cases and focused on a few tools, a study by Saraiya et al. from 2005 [13], as well as a comparative study published by Suderman and Hallett in 2007 [14] which studied nearly 40 network visualisation tools. Please note that for certain tools, references to papers published after 2009 have been included when the tool was available online but no publication existed in 2009. Additionally, this collection reflects our knowledge as of 2009; a contemporary collection would include some different tools while omitting others.
During this study, 174 relevant tools were identified and investigated further. 51 out of these 174 tools were open-source, 24 commercial, 13 were web-based, and 39 tools mentioned in the literature were already no longer available on their respective websites in 2009. The tools with the most citations that time were DAVID [15] (818 citations), GeneVestigator [16] (738 citations), and Cytoscape [17] (618 citations). DAVID and GeneVestigator were well established in the scientific community and widely used for retrieval of information about microarray data, which explains the high citation count at the time. Cytoscape was primarily used for network analysis and visualisation, gaining traction as the field of systems biology expanded.
After 15 years, in 2024, we reviewed the status of the initially catalogued tools, see Table 1. The result of this investigation is as follows: 89 of the tools identified in the 2009 data collection (approximately 51 %) are no longer available. We categorize a tool as being “no longer available” if it is no longer accessible as defined in its first publication or the source code repository or download URL is no longer resolvable. Specifically, for none of these tools, even outdated or unsupported versions remain accessible from their developers. It should be noted that 36 tools (around 21 %) were already unavailable in 2009 (published before 2009 but not available in 2009). Therefore, 53 of the tools listed and still available in 2009 have become inaccessible over the last 15 years. Furthermore, 35 tools (around 20 % of all tools) can be classified as obsolete, as they are available, but have not received any updates in the last five years. In Table 1, we indicate obsolete tools with a dagger symbol followed by the exact year the last update was carried out. Of these 35 tools, 30 have remained without updates for (more than) a decade. This classification is based on evidence from release histories, website activity, copyright notices, and associated publications.
Overview of tools.
| Tool name | Year first publication | Ref. | Still available? |
|---|---|---|---|
| A-cell | 2001 | [18] | No |
| aiSee | n/a | [19] | No |
| Advanced pathway painter | 2003 | [20] | Yes |
| Arcadia | 2008 | [21] | Yes (†2014) |
| ArrayXPath | 2004 | [22] | No |
| Atlas | 2005 | [23] | Yes |
| AVIS | 2007 | [24] | No |
| Biological concept diagram editor | 2008 | [25] | No |
| BINViz | 2008 | [26] | Yes (†2013) |
| Bio sketch pad | 2001 | [27] | No |
| BioBiblioMetrics | 2000 | [28] | No |
| BioCarta | n/a | [29] | No |
| Biogranat | 2008 | [30] | Yes (†2014) |
| BioGraphNet | 2004 | [31] | Yes (†2013) |
| BioJAKE | 1999 | [32] | No |
| BioLayout | 2000 | [33] | Yes |
| BiologicalNetworks | 2005 | [34] | No |
| BioMiner | 2002 | [35] | No |
| BioPath | 2002 | [36] | No |
| BioPathwise | 2007 | [37] | No |
| BioPax | 2003 | [38] | Yes |
| BioPP | 2007 | [39] | No |
| BioSpice | 2002 | [40] | Yes (†2012) |
| BioTapestry | 2005 | [41] | Yes |
| BioUML | 2002 | [42] | Yes |
| BNArray | 2006 | [43] | Yes (†2006) |
| CADLIVE | 2003 | [44] | Yes (†2010) |
| Cell illustrator | 2004 | [45] | Yes |
| CellDesigner | 2003 | [46] | Yes |
| CellNetAnalyzer | 2003 | [47] | Yes |
| CentiBin | 2006 | [48] | Yes (†2011) |
| Pathway tool software | 2005 | [49] | No |
| COB editor | 2005 | [50] | Yes (†2005) |
| CPN tools | 1999 | [51] | Yes |
| Cell system markup language | 2000 | [52] | No |
| CUtenet | 2000 | [53] | No |
| Cyclone | 2005 | [54] | Yes (†2013) |
| Cytoscape | 2003 | [17] | Yes |
| DAVID | 2003 | [15] | Yes |
| DBmcmc | 2003 | [55] | No |
| Dynamic signaling maps | n/a | [56] | No |
| E-cell | 1999 | [57] | Yes |
| EMMA2 | 2008 | [58] | Yes (†2013) |
| Edinburgh pathway editor | 2006 | [59] | Yes (†2013) |
| ExPASy | 2003 | [60] | Yes |
| ExPlain | 2006 | [61] | Yes |
| GENAW | n/a | [62] | No |
| GeneGobi | 2004 | [63] | No |
| GenePath | 2003 | [64] | Yes |
| GeneScene visualizer | 2005 | [65] | No |
| GeneSpring GX | 2008 | [66] | Yes |
| Genetic network analyzer | 2002 | [67] | Yes |
| GeneVestigator | 2004 | [16] | Yes |
| GeneView | 2007 | [68] | No |
| GeneWays | 2003 | [69] | No |
| GenMAPP | 2005 | [70] | No |
| GenoLink | 2006 | [71] | No |
| Genome3DExplorer | 2005 | [72] | No |
| Genomic object net | 2003 | [73] | No |
| GEOMI | 2006 | [74] | No |
| Gepasi | 1989 | [75] | Yes (†2002) |
| GEPAT | 2007 | [76] | Yes (†2013) |
| GeXpert | 2006 | [77] | Yes (†2013) |
| GlycoBrowser | 2008 | [78] | No |
| GoMiner | 2003 | [79] | No |
| Graphlet | 1999 | [80] | No |
| GraphViz | 2003 | [81] | Yes |
| Gravisto | 2004 | [82] | Yes |
| Grid cellware | 2004 | [83] | No |
| GridLayout | 2005 | [84] | No |
| GSCope | 2006 | [85] | No |
| IM browser | 2006 | [86] | Yes (†2012) |
| InNetics PathwayLab | n/a | [87] | No |
| INOH: pathways and ontologies | 2003 | [88] | No |
| IntAct | 2004 | [89] | Yes |
| Interviewer | 2005 | [90] | Yes (†2004) |
| Ingenuity pathways analysis | 2004 | [91] | Yes |
| J2dPathway | 2008 | [92] | Yes (†2016) |
| Jarnac | 2000 | [93] | Yes (†2012) |
| JDesigner | 2002 | [40] | Yes (†2012) |
| jSquid | 2008 | [94] | Yes (†2008) |
| KappaView | 2005 | [95] | Yes (†2016) |
| KEGGanim | 2007 | [96] | Yes |
| KGML-ED | 2007 | [97] | No |
| KGraphViewer | 2007 | [98] | Yes |
| Kinetikit | 2003 | [99] | Yes (†2005) |
| KnowledgeEditor | 2002 | [100] | No |
| MapMan | 2004 | [101] | Yes (†2013) |
| MAPPFinder | 2003 | [102] | No |
| MARGBench | 1999 | [103] | No |
| Mavisto | 2005 | [104] | Yes |
| megNet | 2005 | [105] | No |
| Metabolic IsaViz | 2005 | [106] | Yes (†2007) |
| MetaCore | n/a | [107] | Yes |
| EcoCyc | 2002 | [108] | Yes |
| MetaNetter | 2008 | [109] | Yes |
| MetaReg | 2008 | [110] | Yes (†2008) |
| metaSHARK | 2006 | [111] | No |
| MetNet3D | 2005 | [112] | No |
| MicroarrayDB | 2005 | [113] | No |
| Metabolic network visualizer | 2003 | [114] | No |
| MOVE | 2006 | [115] | No |
| Narrator – a graph-based modelling tool | 2007 | [116] | Yes (†2016) |
| NeAT | 2008 | [117] | No |
| NetBuilder | 2002 | [118] | No |
| Nodes3D | 2006 | [119] | No |
| ONDEX | 2005 | [120] | Yes (†2019) |
| ontoTools | 2007 | [121] | Yes (†2012) |
| Osprey | 2003 | [122] | No |
| Pajek | 1998 | [123] | Yes |
| PathArt | n/a | [124] | No |
| PathBank | 2006 | [125] | No |
| PathBuilder | 2007 | [126] | No |
| PathCase | 2003 | [127] | No |
| PathDB | 2000 | [128] | No |
| PathFinder | 2002 | [129] | No |
| PathMAPA | 2003 | [130] | No |
| pathSCOUT | 2003 | [131] | No |
| PathVisio | 2008 | [132] | Yes |
| Pathway analytics | 2007 | [133] | No |
| Pathway assist | 2003 | [134] | No |
| Pathway builder 2.0 | 2005 | [135] | Yes |
| Pathway builder | 2005 | [136] | No |
| Pathway processor | 2002 | [137] | No |
| Pathway studio | 2003 | [134] | No |
| Pathway tools | 2002 | [138] | Yes |
| PathwayLab | 2009 | [139] | No |
| PathwayLogic | 2002 | [140] | Yes |
| Patika | 2002 | [141] | No |
| PaVESy | 2004 | [142] | No |
| Pathway hunter tool | 2005 | [143] | Yes |
| PhyloGrapher | 2001 | [144] | Yes (†2003) |
| PIMWalker | 2005 | [145] | No |
| PIVOT | 2003 | [146] | Yes (†2003) |
| PNE – pathway network editor | 2007 | [59] | Yes (†2014) |
| Prefuse | 2005 | [147] | Yes |
| ProcessDB | 2001 | [148] | Yes |
| ProMoT | 2003 | [149] | No |
| ProteoLens | 2008 | [150] | Yes |
| PROTON | n/a | [151] | No |
| ProViz | 2005 | [152] | No |
| PubGene | 2000 | [153] | Yes |
| PWComp | 2002 | [154] | No |
| pyNetConv | 2005 | [155] | Yes (†2013) |
| QPACA | 2006 | [156] | No |
| Reactome | 2005 | [157] | Yes |
| ROSPath | 2004 | [158] | No |
| SBW | 2003 | [159] | Yes |
| SHARKview | 2007 | [160] | No |
| SHriMP | 2004 | [161] | No |
| simBio | 2006 | [162] | No |
| SimWiz | 2004 | [163] | No |
| Snoopy | 2000 | [164] | Yes |
| Sofia | 2008 | [165] | No |
| Spike | 2008 | [166] | Yes |
| SYCAMORE | 2008 | [167] | No |
| Teranode design suite | 2008 | [168] | No |
| BioPath | 2001 | [169] | No |
| Tom sawyer | 2009 | [170] | Yes |
| ToPNet | 2004 | [171] | No |
| Pathway editor | 2005 | [172] | No |
| Unipath | 2003 | [173] | No |
| Vanted | 2006 | [174] | Yes |
| Vector PathBlazer | n/a | [175] | No |
| VisANT | 2004 | [176] | No |
| VitaPad | 2005 | [177] | Yes (†2013) |
| WebGestalt | 2005 | [178] | Yes |
| WebInterViewer | 2003 | [179] | No |
| WikiPathways | 2008 | [180] | Yes |
| WilmaScope | 2002 | [181] | Yes (†2013) |
| YANAsquare | 2007 | [182] | Yes |
| yFiles | 2001 | [183] | Yes |
Importantly, with 48 tools, less than a third of all initial tools (about 28 %) are actively available or show no clear evidence of being unsupported. Here, “actively available” is defined as having undergone at least one update within the past five years. “No clear evidence of being unsupported” indicates that while recent updates could not be confirmed due to limited information, a functional download link is accessible. That means that the majority of tools is not available anymore. This has profound impact, for example, relating to the reproducibility of scientific studies conducted using those tools.
5 Vanted – a brief overview
As mentioned, Vanted is a tool for the exploration, analysis and visualisation of biological networks and related experimental data. The development of Vanted started in 2003/2004, with its first publication in 2006 [174], and version Vanted v2 [184] with significant changes to core plug-ins has been released in 2012. It should be noted that the underlying system is even older: Vanted is based on Gravisto [82], a general graph editing and layout system, which was already in development end of the 1990s. From Gravisto the Vanted software inherited a flexible and modular concept of plug-ins. Internally every major part of Vanted is a plug-in, and as of Vanted v2.8.8, there are 91 plug-ins in the core. Besides user interface and core framework functionality, plug-ins are organised into several sub-domains: (1) specialised import and export support, (2) database access, (3) network layout algorithms, and (4) other algorithms. Plug-ins for import and export include support for SBML [185], BioPAX [38], SBGN-ML [186], KGML (the exchange format for KEGG pathway maps) [187], GraphML [188], and GML [189] (Vanted’s default network format). Among the extensions for database access are plug-ins for KEGG [187], BioModels [190], MetaCrop [191], and RIMAS [192].
See Figure 1 for an overview of Vanted’s architecture. Vanted comprises a modular architecture, capable of supporting a range of different use cases and scenarios. In addition to the core’s internal plug-ins, external plug-ins, so called add-ons, are also part of the architecture. Vanted’s add-ons provide the necessary degree of customisation and extensibility to the core functionality, while assuring a proper separation of concerns. This concept has been important in the long-term maintenance of Vanted, such that Vanted’s core includes only the functionality which should be actively maintained and made compatible with past and new versions of its core, add-ons, and, of course, Java itself.
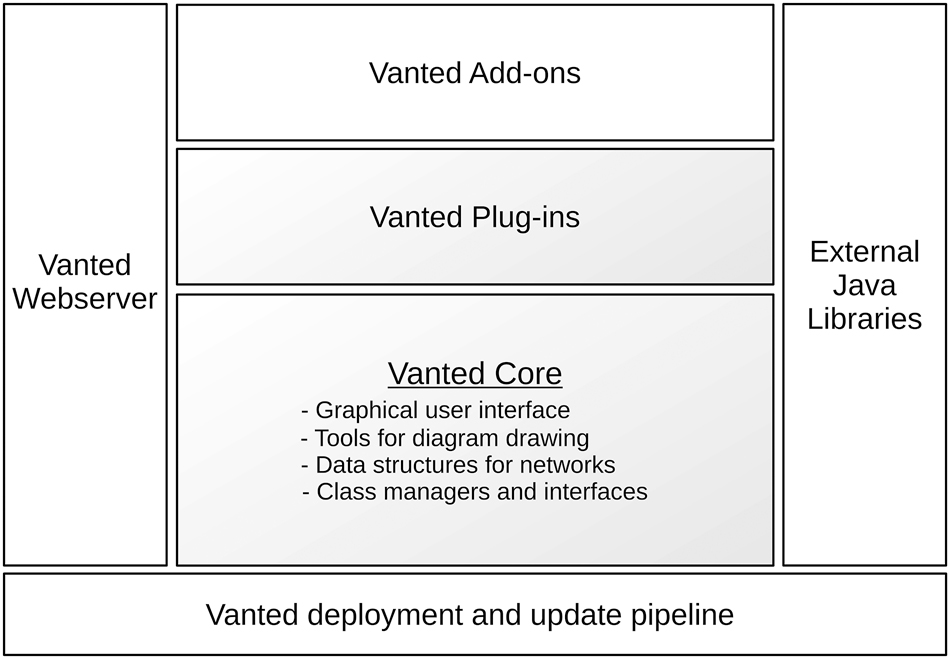
The architecture of Vanted consists of several classes of interfacing components. The core (shaded area) is responsible for overall architecture (class managers and interfaces), for network data structures, for diagram drawing and for the user interface. The core also consists of a number of plug-ins providing dedicated functionality. On top of the core, users write add-ons to extend for specific functionality. Java libraries provide external tools and interfacing with formats and standards. The core communicates with Vanted’s webserver to find updates. Any updates are deployed to the webserver through the deployment and update pipeline.
Developed using Java, Vanted embodies Java’s “write once, run everywhere” philosophy, enabling it to run on all three major operating systems with minimal additional setup. To install and run Vanted on a desktop, users need to have the Java Runtime Environment (JRE, available at www.java.com/download) pre-installed. To download and install Vanted, a user can simply download the latest version from the Vanted website [193].
Vanted is fully open-source, available on GitHub under the GPL-2.0 license. On GitHub, developers can also find a wiki and users can report issues. Add-on developers can use a so-called example add-on as a template. Tutorials, examples and further documentation are also available on the Vanted website.
6 Recommendation 1: long-term design and adaptability
Make the software modular and continuously adaptable from the beginning.
An important aspect of sustainable software development in science is creating systems that are flexible and adaptable enough to meet the (changing) demands of users while maintaining stability, reliability, and performance. A system should be modular to enable updates, adaptions, and additions of new functionalities without disrupting existing components. Vanted fulfils these principles through several design features:
Modular architecture: Internally, every major part of Vanted is a plug-in, which can be dynamically changed or replaced by new code. For example, different views of a network, such as a view “node-link diagram” or a view “statistical properties of the network” are implemented as plug-ins, being easily exchangeable. Another example are different algorithms, which are also implemented as separate plug-ins.
Extensible architecture: Vanted provides the concept of add-ons, external “plug-ins” which can provide new functionality without the need to change internal (core) functions and allow to add new algorithms, data types, visualisation techniques and similar without disrupting the core functionality.
Scalable performance: Leveraging the concept of plug-ins allows the core functionality to remain efficient even as datasets grow. For instance, visualising a network as a node-link diagram can be resource-intensive when dealing with networks (graphs) containing tens of thousands of nodes and edges with related data shown. The plug-in approach enables switching to a less resource-demanding view, for example, displaying only key information for large networks (such as statistical parameters) instead of all elements of the entire network.
Object-oriented approach: Using Java Vanted is based on an object-oriented approach that promotes code reusability, modularity, and maintainability in the long run.
This flexibility ensures that Vanted remains relevant as new scientific challenges and data types emerge. Several add-ons have been developed to extend the functionality, for example, FluxMap [194] for flux visualisation, PetriNets [195] to allow the simulation of Petri nets, CentiBiN [196] which extends the software to investigate different centrality measures in networks, FBA-SimViz [197] for interactive visualisation of constraint-based metabolic models, and SBGN-ED [198] for editing, validating, and translating of SBGN maps. Add-ons also offer a great way to encourage external (community) participation and enable the software to be used in teaching, such as allowing students to develop new functionality as part of their project.
However, we also learned that modifying the core system, as it was done for various reasons from version 1 to version 2 in 2012, introduced challenges. Due to changes in both the underlying Java system and related external libraries in version 2, not all add-ons remained compatible with the new Vanted version. However, separating functionality into core and add-ons allows us to prioritise resources to maintaining the core, while less relevant or outdated add-ons can be phased out over time.
7 Recommendation 2: continuous contribution to science: research in the application domain(s)
Make the software contributing to science – in the application area(s).
A key aspect of Vanted’s sustainability is its continued impact on scientific research. Over the past 20 years, the software has made significant contributions to the field of life sciences, enabling the visualisation and analysis of complex biological networks with related experimental data that were otherwise difficult to interpret. By facilitating the exploration of these networks, Vanted has helped researchers uncover new insights into cellular processes, disease mechanisms, and other important biological phenomena.
From our experience, it is crucial that scientific software is developed in continuous and close collaboration with partners from the application domain(s). This approach has been central to Vanted’s development, ensuring that it meets the needs of its diverse user base. Examples of such joint projects include plant sciences, where Vanted was initially developed in collaboration with plant scientists, e.g., [199], 200], animal sciences [201], medicine [202], 203], and microbiology [204], 205]. Additionally, Vanted has been used to build and graphically enhance with interactive visualisations biological databases such as MetaCrop [206], Rimas [192], and QSDB [207]. These collaborations have consistently brought new ideas and methods for the ongoing development of Vanted.
Vanted has been utilised in numerous external projects and publications, where it has often been explicitly cited; however, there are also instances where it is merely acknowledged or not mentioned at all despite its use. Examples from biology include its use in detailing the lipid composition in pollen [208], where it was applied to analyse and visualise the synthesis and breakdown of lipids, its contribution by means of statistical and visual analyses to the investigation of combined abiotic and biotic stress factors in plants [209], its use to analyse the central metabolism in developing oilseeds [210], and for the visualisation of flux and transcript data [211]. Examples from medicine, just one of the other application areas, include its use in the visual analysis of metabolites for their role in PD-1 blockade therapy in cancer research [212], to explore gut microbe metabolites in Alzheimer’s disease research [213], and to identify drug targets in Covid-19 disease mechanisms [214]. In visualising omics data, Vanted has been known to support “interactive editing particularly well” [215].
8 Recommendation 3: continuous contribution to science: research in the computer science domain
Make the software contributing to science – in computer science.
In addition to the application areas, Vanted has been used to drive novel methodological developments in computer science, in particular in the fields of network visualisation and topological network analysis.
Network layout methods are important for visual network exploration, and Vanted provides several well-known methods such as force-directed, stress minimisation, multi-level, grid and tree layout. However, existing network layout methods are often insufficient [216]. For example, hierarchical network representations (such as clustered graphs or networks of pathways) and their interactive exploration are often relevant for biological networks. Different novel approaches have been developed and implemented in the Vanted framework, already starting in 2007 with the dynamic exploration and editing of KEGG pathway diagrams [97]. To help preserve the mental-map [217] during the exploration of networks with clusters or sub-networks, Vanted provides methods which have been developed over the years. For example, NetPartVis to visualise non-overlapping clusters or partitions of graphs by laying out overview graph and sub-graphs (partitions) in a coordinated, mental-map preserving way [218], using glyphs, brushing, and topological information of the related pathways for interactive visualisation [219] as well as a decomposition method which is part of the LMME add-on [220]. We also investigated group-based visual transformations such as de-emphasising groups by opacity, position or size, aggregating groups and hiding groups to find the most suitable approach for the exploration of networks with clusters or sub-networks [221].
For the analysis of biological networks novel algorithms have been developed and usually implemented in Vanted, such as flux-based centrality analysis [222], motif-based centrality analysis [223], and pattern detection under different frequency concepts for the analysis of motifs in networks [224].
More recently, Vanted has been also used for analysing networks in other domains, for example, to investigate the relationship between Celtic knots and specific graphs [225].
These examples underscore the critical role of scientific contributions, such as new network analysis algorithms and novel visualisation methods, in pushing the boundaries of computer science during sustainable research software development. There has to be scientific progress in the application domain(s), but also in the computer science domain.
9 Recommendation 4: open-source nature and community contribution
Make the software open-source and support community involvement.
There are several advantages of open source software and community involvement, and the open-source nature of Vanted has been important for its longevity:
By making the software freely available and open for modification, researchers around the world can contribute improvements and bug fixes. This has helped build a diverse community of users and developers who contribute to the software’s enhancement. Examples include usage and extension independent of our team as done for the visualisations presented by Yugi et al. [226], as well as joint development of add-ons, for example, with the group of Andreas Kerren for glyph-based navigation of metabolic networks [219].
Our group has moved several times over the past 20 years including between different countries, as Vanted’s development sustained. Having the code open source has made it easier to transfer the code between different institutions or universities without facing licensing issues.
The ability to customise and adapt the software freely is a major advantage for long-term usability and maintainability. Vanted has embraced the concept of community-driven development, where users not only benefit from the software, but also contribute to its evolution, providing a sustainable cycle of usage, feedback, and improvement. A community-driven approach is crucial for the long-term support of software; it is a process that needs a low entry barrier to build an initial user base and then create further momentum, such as through events or other incentives.
10 Recommendation 5: user-centric development and support
Make the software user-friendly, also for non-expert users.
The development of Vanted was strongly driven by user needs, adapting the software based on feedback from both researchers and developers. This user-centric approach has helped that Vanted remains a relevant tool as new scientific challenges emerge. In particular, the use in collaborative projects has ensured that Vanted evolved in a way that addresses the real-world problems faced by its users. Early interdisciplinary work for the representation of experimental biological data in metabolic networks [228] and for analysing the topology of such networks led to prototypes called DBE-Gravisto [229], PatternGravisto [230] and MAVisto [104]. These early prototypes were instrumental for the successful development of Vanted which was directly based on experience with those prototypes and their early application to scientific questions such as presented by Rolletschek et al. [231]. Functionality of these early prototypes proved so useful in collaborative projects that it was later included into Vanted as plug-ins and add-ons. This user-focused collaboration continued over the years, recent examples of add-ons from interdisciplinary collaborations are PathwayNexus [232] for interactive metabolic data analysis together with the group of Marcel Leist, and for the layout of anatomical structures and blood vessels based on the foundational model of anatomy [233] together with Bernard de Bono.
Sustainability in scientific software development is also supported by comprehensive documentation. The Vanted developers have provided user guides, (video) tutorials and documentation that help users understand how to use the software effectively, even if they are new to bioinformatics and biological data analysis. There are also protocols and tutorials (e.g., [234], 235]) which provide guidelines and step-by-step training, and we provided several workshops and in-class tutorials to support users making their first steps with the tool and analysing their own data. The production of documentation and tutorials is time-intensive, but is important for onboarding new users and ensuring that users can take full advantage of the software.
In addition, it is often necessary to not only provide a tool but some broader ecosystem offering additional functionality necessary for data integration and analysis. For example, for Vanted this has included
11 Conclusions
The development of Vanted over the past two decades is an example of how research software can be developed to achieve long-term sustainability. Its modular architecture, adaptability, open-source nature and community-driven development have allowed it to thrive and remain an important tool for researchers. This led to five insights that we consider crucial for sustainable, long-term software development and software maintenance in science:
Recommendation 1: Long-Term Design and Adaptability
Recommendation 2: Continuous Contribution to Science: Research in the Application Domain(s)
Recommendation 3: Continuous Contribution to Science: Research in the Computer Science Domain
Recommendation 4: Open-Source Nature and Community Contribution
Recommendation 5: User-Centric Development and Support
Vanted is one of the tools for biological network analysis and visualisation still available and maintained after 15 years, and only roughly one third of the initially developed and published tools fall in this category.
We plan to develop Vanted further in the future. We like to improve the inclusion of three-dimensional (3D) data, both 3D network data and spatial information. The importance of 3D in network visualisation has already been discussed many years ago [241], 242], and a Vanted-based version for early data integration of 3D data that allowed creating views on integrated multi-domain data including 2D, 3D and network data has been made available already in 2011 [243]. Newer developments based on the raise of Immersive Analytics [244], 245] include the integration and virtual reality exploration of biomedical data [246] and the support of different display modalities such as transitional or hybrid interfaces in Vanted [247], 248]. Here, we plan to further extend this, for example, by including network-based information (such as signal transduction and gene regulatory networks) in our 3D based work for spatial transcriptomics [249]. We also started to investigate suitable network visualisation approaches in 2D, 2.5D (see e.g., [250]) and 3D [251] and plan to further investigate this and include useful approaches, for example, as Vanted add-ons. Another direction of future developments is a better support for constraint-based layout algorithms to provide more precise and customisable visual representations of complex networks while preserving structural and relational context (i.e., the user’s mental map).
The focus of the Journal of Integrative Bioinformatics over the last 20 years is also related to the development of the Vanted framework. Since its inception, the journal has supported software accessibility, offering an environment for this purpose through JIB.tools, and Vanted provides free accessibility and supports long term maintenance. In addition, integrative bioinformatics, the key topic of the journal, is an important aspect of the Vanted development, for example, by novel ways for data integration. The Journal of Integrative Bioinformatics is also very committed to support the development of standards in systems and synthetic biology; special issues focusing on COMBINE [252] standards have been released regularly, offering updates since 2015 [253]. We believe that standards are very important, and Vanted not only supports several COMBINE standards such as SBGN, SBML and BioPax, but it is also a reference implementation for the SBGN [254] standard, supporting all three graphical languages (Process Description [255], Entity Relationship [256] and Activity Flow [257]) and providing additional functionality such as editing and validating SBGN maps [198], conversion of KEGG metabolic pathways to SBGN maps including automatic layout [258] and the translation of SBGN maps from Process Description to Activity Flow [259].
Sustainable software development in science, as demonstrated by the Vanted system, ensures tools not only remain relevant and functional over decades, but also continue to evolve. This enables researchers to address new challenges and fosters enduring contributions to scientific discovery.
Funding source: Deutsche Forschungsgemeinschaft
Award Identifier / Grant number: 251654672-TRR 161
Award Identifier / Grant number: EXC 2117–422037984
Acknowledgements
We would like to thank the many developers (in particular the initial developer Christian Klukas), collaboration partners and users who have made the long-term Vanted project possible, contributing an immense amount of ideas, code and support. We thank Franz Brandenburg and his group at the University of Passau for the development of Gravisto and making this software open-source, and for help and support in the critical initial phase of the Vanted development.
-
Research ethics: Not applicable.
-
Informed consent: Not applicable.
-
Author contributions: The authors have accepted responsibility for the entire content of this manuscript and approved its submission.
-
Use of Large Language Models, AI and Machine Learning Tools: Language processing tools were used to check/improve the text.
-
Conflict of interest: The authors state no conflict of interest.
-
Research funding: The authors acknowledge current funding by the Deutsche Forschungsgemeinschaft (DFG), under Germany's Excellence Strategy-EXC 2117-422037984 and DFG project ID 251654672-TRR 161 as well as previous funding over the last 20 years which contributed to the Vanted development including by the German Ministry of Education and Research, the Land Sachsen-Anhalt, the German Academic Exchange Service, the Australian Research Council, the Leibniz Society, Sungene and Bayer Crop Sciences.
-
Data availability: Not applicable.
References
1. Hofestädt, R, Kormeier, B, Lange, M, Schreiber, F, Sommer, B, Weise, S. JIBtools: a strategy to reduce the bioinformatics analysis gap. J Integr Bioinform 2013;10.10.1515/jib-2013-226Search in Google Scholar PubMed
2. Friedrichs, M, Shoshi, A, Chmura, P, Ison, JC, Schwämmle, V, Schreiber, F, et al.. JIB.tools 2.0 – a bioinformatics registry for journal published tools with interoperability to bio.tools. J Integr Bioinform 2019;16:59. https://doi.org/10.1515/jib-2019-0059.Search in Google Scholar PubMed PubMed Central
3. Chimani, M, Klein, K. Algorithm engineering: concepts and practice. In: Experimental methods for the analysis of optimization algorithms. Berlin Heidelberg: Springer; 2010:131–58 pp.10.1007/978-3-642-02538-9_6Search in Google Scholar
4. Weiss, E. Konrad Zuse obituary. IEEE Ann Hist Comput 1996;18:3–5. https://doi.org/10.1109/mahc.1996.489747.Search in Google Scholar
5. Burks, AW, Burks, AR. First general-purpose electronic computer. Ann Hist Comput 1981;3:310–89. https://doi.org/10.1109/mahc.1981.10043.Search in Google Scholar
6. Walker, VC. Pioneer day 1981: UNIVAC I. Ann Hist Comput 1981;3:400–7.10.1109/MAHC.1981.10036Search in Google Scholar
7. Wirth, N. A brief history of software engineering. IEEE Ann Hist Comput 2008;30:32–9. https://doi.org/10.1109/mahc.2008.33.Search in Google Scholar
8. Royce, WW. Managing the development of large software systems. In: Proceedings of IEEE WESCON; 2008:1–9 pp.Search in Google Scholar
9. Hohl, P, Klünder, J, van Bennekum, A, Lockard, R, Gifford, J, Münch, J, et al.. Back to the future: origins and directions of the “agile manifesto” – views of the originators. J Softw Eng Res Dev 2018;6:15. https://doi.org/10.1186/s40411-018-0059-z.Search in Google Scholar
10. Prlic, A, Procter, JB. Ten simple rules for the open development of scientific software. PLoS Comput Biol 2012;8. https://doi.org/10.1371/journal.pcbi.1002802.Search in Google Scholar PubMed PubMed Central
11. Barker, M, Chue Hong, NP, Katz, DS, Lamprecht, AL, Martinez-Ortiz, C, Psomopoulos, F, et al.. Introducing the fair principles for research software. Sci Data 2022;9:622. https://doi.org/10.1038/s41597-022-01710-x.Search in Google Scholar PubMed PubMed Central
12. Pavlopoulos, GA, Wegener, AL, Schneider, R. A survey of visualization tools for biological network analysis. BioData Min 2008;1:12. https://doi.org/10.1186/1756-0381-1-12.Search in Google Scholar PubMed PubMed Central
13. Saraiya, P, North, C, Duca, K. Visualizing biological pathways: requirements analysis, systems evaluation and research agenda. Inf Visual 2005;4:191–205. https://doi.org/10.1057/palgrave.ivs.9500102.Search in Google Scholar
14. Suderman, M, Hallett, M. Tools for visually exploring biological networks. Bioinformatics 2007;23:2651–9. https://doi.org/10.1093/bioinformatics/btm401.Search in Google Scholar PubMed
15. Dennis, G, Sherman, BT, Hosack, DA, Yang, J, Gao, W, Lane, HC, et al.. DAVID: database for annotation, visualization, and integrated discovery. Genome Biol 2003;4:P3. https://doi.org/10.1186/gb-2003-4-5-p3.Search in Google Scholar
16. Zimmermann, P, Hirsch-Hoffmann, M, Hennig, L, Gruissem, W. GENEVESTIGATOR: arabidopsis microarray database and analysis toolbox. Plant Physiol 2004;136:2621–32. https://doi.org/10.1104/pp.104.046367.Search in Google Scholar PubMed PubMed Central
17. Shannon, P, Markiel, A, Ozier, O, Baliga, N, Wang, J, Ramage, D, et al.. Cytoscape: a software environment for integrated models of biomolecular interaction networks. Genome Res 2003;13:2498–504. https://doi.org/10.1101/gr.1239303.Search in Google Scholar PubMed PubMed Central
18. Ichikawa, K. A-cell: graphical user interface for the construction of biochemical reaction models. Bioinformatics 2001;17:483–4. https://doi.org/10.1093/bioinformatics/17.5.483.Search in Google Scholar PubMed
19. aiSee. * Not available as standalone tool anymore, integration into tool for static analysis of safety-critical applications; 2024. Available from: http://www.aisee.com/.Search in Google Scholar
20. Advanced Pathway Painter; 2024. Available from: http://www.gsa-online.de/eng/app.html.Search in Google Scholar
21. Villéger, AC, Pettifer, SR, Kell, DB. Arcadia: a visualization tool for metabolic pathways. Bioinformatics 2010;26:1470–1. https://doi.org/10.1093/bioinformatics/btq154.Search in Google Scholar PubMed PubMed Central
22. Chung, HJ, Kim, M, Park, CH, Kim, J, Kim, JH. ArrayXPath: mapping and visualizing microarray gene-expression data with integrated biological pathway resources using scalable vector graphics. Nucleic Acids Res 2004;32(2 Suppl):W460–4. https://doi.org/10.1093/nar/gkh476.Search in Google Scholar PubMed PubMed Central
23. Shah, SP, Huang, Y, Xu, T, Yuen, MM, Ling, J, Ouellette, BF. Atlas – a data warehouse for integrative bioinformatics. BMC Bioinf 2005;6:34. https://doi.org/10.1186/1471-2105-6-34. new Version [260].Search in Google Scholar PubMed PubMed Central
24. Berger, SI, Iyengar, R, Ma’ayan, A. AVIS: AJAX viewer of interactive signaling networks. Bioinformatics 2007;23:2803–5. https://doi.org/10.1093/bioinformatics/btm444.Search in Google Scholar PubMed PubMed Central
25. Yu, B, Jakupovic, E, Wilson, J, Dai, M, Xuan, W, Mirel, B, et al.. A diagram editor for efficient biomedical knowledge capture and integration. Summit Transl Bioinform 2008;2008:130–4.Search in Google Scholar
26. BINViz; 2024. Available from: https://sourceforge.net/projects/binviz/.Search in Google Scholar
27. Bio Sketch Pad. Internet Archive; 2024. Available from: https://web.archive.org/web/20080322122250/http://biocomp.cis.upenn.edu/biosketch.php3.Search in Google Scholar
28. Stapley, BJ, Benoit, G. Biobibliometrics: information retrieval and visualization from co-occurrences of gene names in medline abstracts. In: Pacific symposium on biocomputing; 2000:529–40 pp.10.1142/9789814447331_0050Search in Google Scholar PubMed
29. BioCarta. Internet Archive; 2024. Available from: https://web.archive.org/web/20090207000135/http://biocarta.com/.Search in Google Scholar
30. Dand, N, Sprengel, F, Ahlers, V, Schlitt, T. BioGranat-IG: a network analysis tool to suggest mechanisms of genetic heterogeneity from exome-sequencing data. Bioinformatics 2013;29:733–41. https://doi.org/10.1093/bioinformatics/btt045.Search in Google Scholar PubMed
31. BioGraphNet; 2024. Available from: https://sourceforge.net/projects/biographnet/.Search in Google Scholar
32. Salamonsen, W, Mok, KY, Kolatkar, P, Subbiah, S. BioJAKE: a tool for the creation, visualization and manipulation of metabolic pathways. Pacific Symp Biocomput 1999:392–400. https://doi.org/10.1142/9789814447300_0038.Search in Google Scholar PubMed
33. Freeman, TC, Goldovsky, L, Brosch, M, van Dongen, S, Mazière, P, Grocock, RJ, et al.. Construction, visualisation, and clustering of transcription networks from microarray expression data. PLoS Comput Biol 2007;3:1–11. https://doi.org/10.1371/journal.pcbi.0030206.Search in Google Scholar PubMed PubMed Central
34. Baitaluk, M, Sedova, M, Ray, A, Gupta, A. BiologicalNetworks: visualization and analysis tool for systems biology. Nucleic Acids Res 2006;34:W466–71. https://doi.org/10.1093/nar/gkl308.Search in Google Scholar PubMed PubMed Central
35. Šırava, M, Schäfer, T, Eiglsperger, M, Kaufmann, M, Kohlbacher, O, Bornberg-Bauer, E, et al.. Biominer – modeling, analyzing, and visualizing biochemical pathways and networks. Bioinformatics 2002;18(2 Suppl):S219–30. https://doi.org/10.1093/bioinformatics/18.suppl_2.s219.Search in Google Scholar PubMed
36. Schreiber, F. High quality visualization of biochemical pathways in BioPath. Silico Biol 2002;2:59–73.Search in Google Scholar
37. BioPathwise. Internet Archive; 2024. Available from: https://web.archive.org/web/20090527041910/http://www.bioanalyticsgroup.com/.Search in Google Scholar
38. Demir, E, Cary, MP, Paley, S, Fukuda, K, Lemer, C, Vastrik, I, et al.. The BioPAX community standard for pathway data sharing. Nat Biotechnol 2010;28:935–42. https://doi.org/10.1038/nbt.1666.Search in Google Scholar PubMed PubMed Central
39. Viswanathan, GA, Nudelman, G, Patil, S, Sealfon, SC. BioPP: a tool for web-publication of biological networks. BMC Bioinf 2007;8:168. https://doi.org/10.1186/1471-2105-8-168.Search in Google Scholar PubMed PubMed Central
40. Sauro, HM, Hucka, M, Finney, A, Wellock, C, Bolouri, H, Doyle, J, et al.. Next generation simulation tools: the systems biology workbench and BioSPICE integration. OMICS A J Integr Biol 2003;7:355–72. https://doi.org/10.1089/153623103322637670.Search in Google Scholar PubMed
41. Longabaugh, W, Davidson, E, Bolouri, H. Computational representation of developmental genetic regulatory networks. Dev Biol 2005;283:1–16. https://doi.org/10.1016/j.ydbio.2005.04.023.Search in Google Scholar PubMed
42. Kolpakov, F, Akberdin, I, Kiselev, I, Kolmykov, S, Kondrakhin, Y, Kulyashov, M, et al.. BioUML – towards a universal research platform. Nucleic Acids Res 2022;50:W124–31. https://doi.org/10.1093/nar/gkac286.Search in Google Scholar PubMed PubMed Central
43. Chen, X, Chen, M, Ning, K. BNArray: an R package for constructing gene regulatory networks from microarray data by using Bayesian network. Bioinformatics 2006;22:2952–4. https://doi.org/10.1093/bioinformatics/btl491.Search in Google Scholar PubMed
44. Kurata, H, Matoba, N, Shimizu, N. CADLIVE for constructing a large-scale biochemical network based on a simulation-directed notation and its application to yeast cell cycle. Nucleic Acids Res 2003;31:4071–84. https://doi.org/10.1093/nar/gkg461.Search in Google Scholar PubMed PubMed Central
45. Nagasaki, M, Saito, A, Jeong, E, Li, C, Kojima, K, Ikeda, E, et al.. Cell illustrator 4.0: a computational platform for systems biology. Stud Health Technol Inf 2011;162:160–81.10.3233/978-1-60750-704-8-160Search in Google Scholar
46. Funahashi, A, Morohashi, M, Kitano, H, Tanimura, N. CellDesigner: a process diagram editor for gene-regulatory and biochemical networks. Biosilico 2003;1:159–62. https://doi.org/10.1016/s1478-5382(03)02370-9.Search in Google Scholar
47. Klamt, S, Stelling, J, Ginkel, M, Gilles, ED. FluxAnalyzer: exploring structure, pathways, and flux distributions in metabolic networks on interactive flux maps. Bioinformatics 2003;19:261–9. https://doi.org/10.1093/bioinformatics/19.2.261.Search in Google Scholar PubMed
48. CentiBin; 2008. Available from: https://centibin.software.informer.com/versions/.Search in Google Scholar
49. Chuang, LY, Yang, CH. A novel biological pathways tool software. Biomed Eng Appl Basis Commun 2005;17:27–30. https://doi.org/10.4015/s1016237205000056.Search in Google Scholar
50. COB Editor; 2024. Available from: https://www.animalgenome.org/bioinfo/tools/share/COB/.Search in Google Scholar
51. Ratzer, AV, Wells, L, Lassen, HM, Laursen, M, Qvortrup, JF, Stissing, MS, et al.. CPN tools for editing, simulating, and analysing coloured petri nets. In: van der Aalst, WMP, Best, E, editors. Applications and theory of petri nets 2003. Berlin Heidelberg: Springer; 2003:450–62 pp. Available from: https://cpntools.org.10.1007/3-540-44919-1_28Search in Google Scholar
52. CSML. Internet Archive; 2024. Available from: https://web.archive.org/web/20090106150428/http://www.csml.org/csml/.Search in Google Scholar
53. Koike, T, Rzhetsky, A. A graphic editor for analyzing signal-transduction pathways. Gene 2001;259:235–44. https://doi.org/10.1016/s0378-1119(00)00458-3.Search in Google Scholar PubMed
54. Krummenacker, M, Paley, S, Mueller, L, Yan, T, Karp, PD. Querying and computing with BioCyc databases. Bioinformatics 2005;21:3454–5. https://doi.org/10.1093/bioinformatics/bti546.Search in Google Scholar PubMed PubMed Central
55. Husmeier, D. Sensitivity and specificity of inferring genetic regulatory interactions from microarray experiments with dynamic Bayesian networks. Bioinformatics 2003;19:2271–82. https://doi.org/10.1093/bioinformatics/btg313.Search in Google Scholar PubMed
56. Dynamic signaling maps. Internet Archive; 2024. Available from: https://web.archive.org/web/20080420125131/http://www.hippron.com/hippron/index.html.Search in Google Scholar
57. Tomita, M, Hashimoto, K, Takahashi, K, Shimizu, TS, Matsuzaki, Y, Miyoshi, F, et al.. E-cell: software environment for whole-cell simulation. Bioinformatics 1999;15:72–84. https://doi.org/10.1093/bioinformatics/15.1.72.Search in Google Scholar PubMed
58. EMMA2; 2024. Available from: https://sourceforge.net/projects/emma2/.Search in Google Scholar
59. Sorokin, A, Paliy, K, Selkov, A, Demin, O, Dronov, S, Ghazal, P, et al.. The pathway editor: a tool for managing complex biological networks. IBM J Res Dev 2006;50:561–74. https://doi.org/10.1147/rd.506.0561.Search in Google Scholar
60. Gasteiger, E, Gattiker, A, Hoogland, C, Ivanyi, I, Appel, RD, Bairoch, A. Expasy: the proteomics server for in-depth protein knowledge and analysis. Nucleic Acids Res 2003;31:3784–8. https://doi.org/10.1093/nar/gkg563.Search in Google Scholar PubMed PubMed Central
61. Kel, A, Konovalova, T, Waleev, T, Cheremushkin, E, Kel-Margoulis, O, Wingender, E. Composite module analyst: a fitness-based tool for identification of transcription factor binding site combinations. Bioinformatics 2006;22:1190–7. https://doi.org/10.1093/bioinformatics/btl041.Search in Google Scholar PubMed
62. GENAW. Internet Archive; 2024. Available from: https://web.archive.org/web/20050208150104/https://pearl.cs.pusan.ac.kr/genaw/.Search in Google Scholar
63. Lee, EK, Cook, D, Wurtele, E, Kim, D, Kim, J, An, H. Genegobi: visual data analysis aid tools for microarray data. In: COMPSTAT’2004 symposium; 2004.Search in Google Scholar
64. Zupan, B, Demsar, J, Bratko, I, Juvan, P, Halter, JA, Kuspa, A, et al.. GenePath: a system for automated construction of genetic networks from mutant data. Bioinformatics 2003;19:383–9. https://doi.org/10.1093/bioinformatics/btf871.Search in Google Scholar PubMed
65. GeneScene Visualizer; 2024. Internet Archive. Available from: https://web.archive.org/web/20080724111835/http://genescene.arizona.edu/index.html.Search in Google Scholar
66. GeneSpring GX; 2024. Available from: https://www.agilent.com/en/product/software-informatics/genomics-software-informatics/gene-expression/genespring-gx#features.Search in Google Scholar
67. de Jong, H, Geiselmann, J, Hernandez, C, Page, M. Genetic network analyzer: qualitative simulation of genetic regulatory networks. Bioinformatics 2003;19:336–44. https://doi.org/10.1093/bioinformatics/btf851.Search in Google Scholar PubMed
68. GeneView; 2024. Available from: http://www.geneview.org.Search in Google Scholar
69. Rzhetsky, A, Iossifov, I, Koike, T, Krauthammer, M, Kra, P, Morris, M, et al.. Geneways: a system for extracting, analyzing, visualizing, and integrating molecular pathway data. J Biomed Inf 2004;37:43–53. https://doi.org/10.1016/j.jbi.2003.10.001.Search in Google Scholar PubMed
70. Dahlquist, KD, Salomonis, N, Vranizan, K, Lawlor, SC, Conklin, BR. GenMAPP, a new tool for viewing and analyzing microarray data on biological pathways. Nat Genet 2002;31:19–20. https://doi.org/10.1038/ng0502-19.Search in Google Scholar PubMed
71. Durand, P, Labarre, L, Meil, A, Divol, JL, Vandenbrouck, Y, Viari, A, et al.. Genolink: a graph-based querying and browsing system for investigating the function of genes and proteins. BMC Bioinf 2006;7:21. https://doi.org/10.1186/1471-2105-7-21.Search in Google Scholar PubMed PubMed Central
72. Férey, N, Gros, PE, Hérisson, J, Gherbi, R. Visual data mining of genomic databases by immersive graph-based exploration. In: Proc. international conference on computer graphics and interactive techniques in Australasia and South East Asia, GRAPHITE ‘05; 2005:143–6 pp.10.1145/1101389.1101418Search in Google Scholar
73. Nagasaki, M, Doi, A, Matsuno, H, Miyano, S. Genomic object net: I. a platform for modelling and simulating biopathways. Appl Bioinf 2003;2:181–4.Search in Google Scholar
74. Ahmed, A, Dwyer, T, Forster, M, Fu, X, Ho, J, Hong, S-H, et al.. GEOMI: GEOmetry for maximum insight. In: Healy, P, Nikolov, NS, editors. Proc. international symposium on graph drawing (GD ‘05), volume 3843 of LNCS. Springer; 2006:468–79 pp.10.1007/11618058_42Search in Google Scholar
75. Mendes, P. GEPASI: a software package for modelling the dynamics, steady states and control of biochemical and other systems. Comput Appl Biosci 1993;9:563–71. https://doi.org/10.1093/bioinformatics/9.5.563.Search in Google Scholar PubMed
76. Weniger, M, Engelmann, JC, Schultz, J. Genome expression pathway analysis tool–analysis and visualization of microarray gene expression data under genomic, proteomic and metabolic context. BMC Bioinf 2007;8:179. https://doi.org/10.1186/1471-2105-8-179.Search in Google Scholar PubMed PubMed Central
77. Arredondo, T, Seeger, M, Dombrovskaia, L, Avarias, J, Calderón, F, Candel, D, et al.. Bioinformatics integration framework for metabolic pathway data-mining. In: Proc. international conference advances in applied artificial intelligence; 2006:917–26 pp. Available from: https://sourceforge.net/projects/gexpert/.Search in Google Scholar
78. Eavenson, M, Janik, M, Nimmagadda, S, Miller, JA, Kochut, KJ, York, WS. Glycobrowser: a tool for contextual visualization of biological data and pathways using ontologies. In: Măndoiu, I, Sunderraman, R, Zelikovsky, A, editors. Bioinformatics research and applications. Berlin Heidelberg: Springer; 2008:305–16 pp.10.1007/978-3-540-79450-9_29Search in Google Scholar
79. Zeeberg, BR, Feng, W, Wang, G, Wang, MD, Fojo, AT, Sunshine, M, et al.. Gominer: a resource for biological interpretation of genomic and proteomic data. Genome Biol 2003;4:R28. https://doi.org/10.1186/gb-2003-4-4-r28.Search in Google Scholar PubMed PubMed Central
80. Himsolt, M. Graphlet: design and implementation of a graph editor. Software Pract Ex 2000;30:1303–24. https://doi.org/10.1002/1097-024x(200009)30:11<1303::aid-spe341>3.0.co;2-3.10.1002/1097-024X(200009)30:11<1303::AID-SPE341>3.0.CO;2-3Search in Google Scholar
81. Ellson, J, Gansner, E, Koutsofios, L, North, S, Woodhull, G, S. Description and Lucent Technologies. Graphviz – open source graph drawing tools. In: LNCS. Springer-Verlag; 2002, vol 2265:483–4 pp. https://www.graphviz.org.10.1007/3-540-45848-4_57Search in Google Scholar
82. Bachmaier, C, Brandenburg, FJ, Forster, M, Holleis, P, Raitner, M. Gravisto: graph visualization toolkit. In: Pach, J, editor. Proc. international symposium on graph drawing (GD’04), volume 3383 of LNCS. Springer; 2005:502–3 pp.10.1007/978-3-540-31843-9_52Search in Google Scholar
83. Dhar, PK, Meng, TC, Somani, S, Ye, L, Sakharkar, K, Krishnan, A, et al.. Grid cellware: the first grid-enabled tool for modelling and simulating cellular processes. Bioinformatics 2004;21:1284–7. https://doi.org/10.1093/bioinformatics/bti143.Search in Google Scholar PubMed
84. Li, W, Kurata, H. A grid layout algorithm for automatic drawing of biochemical networks. Bioinformatics 2005;21:2036–42. https://doi.org/10.1093/bioinformatics/bti290.Search in Google Scholar PubMed
85. Hasegawa, Y, Seki, M, Mochizuki, Y, Heida, N, Hirosawa, K, Okamoto, N, et al.. A flexible representation of omic knowledge for thorough analysis of microarray data. Plant Methods 2006;2:5. https://doi.org/10.1186/1746-4811-2-5.Search in Google Scholar PubMed PubMed Central
86. Pacifico, S, Liu, G, Guest, S, Parrish, JR, Fotouhi, F, Finley, RL. A database and tool, im browser, for exploring and integrating emerging gene and protein interaction data for drosophila. BMC Bioinf 2006;7:195. https://doi.org/10.1186/1471-2105-7-195.Search in Google Scholar PubMed PubMed Central
87. InNetics PathwayLab. Internet Archive; 2024. Available from: https://web.archive.org/web/20090312082110/http://innetics.com/.Search in Google Scholar
88. Yamamoto, S, Sakai, N, Nakamura, H, Fukagawa, H, Fukuda, K, Takagi, T. INOH: ontology-based highly structured database of signal transduction pathways. Database 2011;2011:bar052. https://doi.org/10.1093/database/bar052.Search in Google Scholar PubMed PubMed Central
89. Hermjakob, H, Montecchi-Palazzi, L, Lewington, C, Mudali, S, Kerrien, S, Orchard, S, et al.. IntAct: an open source molecular interaction database. Nucleic Acids Res 2004;32(1 Suppl):D452–5. https://doi.org/10.1093/nar/gkh052.Search in Google Scholar PubMed PubMed Central
90. InterViewer; 2024. Available from: http://interviewer.inha.ac.kr.Search in Google Scholar
91. Ingenuity Pathways Analysis; 2024. Available from: https://digitalinsights.qiagen.com/products-overview/discovery-insights-portfolio/analysis-and-visualization/qiagen-ipa/.Search in Google Scholar
92. Song, EH, Ham, SI, Yang, SD, Rhie, AR, Park, HS, Lee, SH. J2dpathway: a global metabolic pathway viewer with node-abstracting features. Genomics Inform 2008;6:68–71. https://doi.org/10.5808/gi.2008.6.2.068.Search in Google Scholar
93. Sauro, H. Jarnac: an interactive metabolic systems language. Dept. of Computer Science Technical Report No. 345; 2000:11–18 pp. Available from: https://jdesigner.sourceforge.net/Site/Jarnac.html.Search in Google Scholar
94. Klammer, M, Roopra, S, Sonnhammer, ELL. jSquid: a java applet for graphical on-line network exploration. Bioinformatics 2008;24:1467–8. https://doi.org/10.1093/bioinformatics/btn213.Search in Google Scholar PubMed
95. Tokimatsu, T, Sakurai, N, Suzuki, H, Ohta, H, Nishitani, K, Koyama, T, et al.. KaPPA-view: a web-based analysis tool for integration of transcript and metabolite data on plant metabolic pathway maps. Plant Physiol 2005;138:1289–300. https://doi.org/10.1104/pp.105.060525.Search in Google Scholar PubMed PubMed Central
96. Adler, P, Reimand, J, Jänes, J, Kolde, R, Peterson, H, Vilo, J. KEGGanim: pathway animations for high-throughput data. Bioinformatics 2007;24:588–90. https://doi.org/10.1093/bioinformatics/btm581.Search in Google Scholar PubMed
97. Klukas, C, Schreiber, F. Dynamic exploration and editing of KEGG pathway diagrams. Bioinformatics 2007;23:344–50. https://doi.org/10.1093/bioinformatics/btl611.Search in Google Scholar PubMed
98. KGraphViewer; 2024. Available from: https://apps.kde.org/de/kgraphviewer/.Search in Google Scholar
99. Sivakumaran, S, Hariharaputran, S, Mishra, J, Bhalla, US. The database of quantitative cellular signaling: management and analysis of chemical kinetic models of signaling networks. Bioinformatics 2003;19:408–15. https://doi.org/10.1093/bioinformatics/btf860.Search in Google Scholar PubMed
100. Toyoda, T, Konagaya, A. Knowledgeeditor: a new tool for interactive modeling and analyzing biological pathways based on microarray data. Bioinformatics 2003;19:433–4. https://doi.org/10.1093/bioinformatics/btf874.Search in Google Scholar PubMed
101. Thimm, O, Bläsing, O, Gibon, Y, Nagel, A, Meyer, S, Krüger, P, et al.. MAPMAN: a user-driven tool to display genomics data sets onto diagrams of metabolic pathways and other biological processes. Plant J 2004;37:914–39. https://doi.org/10.1111/j.1365-313x.2004.02016.x.Search in Google Scholar PubMed
102. Doniger, SW, Salomonis, N, Dahlquist, KD, Vranizan, K, Lawlor, SC, Conklin, BR. MAPPFinder: using gene ontology and genmapp to create a global gene-expression profile from microarray data. Genome Biol 2003;4:R7. https://doi.org/10.1186/gb-2003-4-1-r7.Search in Google Scholar PubMed PubMed Central
103. Freier, A, Hofestädt, R, Lange, M, Scholz, U. MARGBench – an approach for integration, modeling and animation of metabolic networks. In: Wingender, E, Hofestädt, R, Giegerich, R, Lengauer, T, Mewes, W, Schomburg, D, et al.., editors. Computer science and biology: proc. German conference on bioinformatics GCB ‘99; 1999:190–4 pp.Search in Google Scholar
104. Schreiber, F, Schwöbbermeyer, H. MAVisto: a tool for the exploration of network motifs. Bioinformatics 2005;21:3572–4. https://doi.org/10.1093/bioinformatics/bti556.Search in Google Scholar PubMed
105. Gopalacharyulu, PV, Lindfors, E, Bounsaythip, C, Kivioja, T, Yetukuri, L, Hollmén, J, et al.. Data integration and visualization system for enabling conceptual biology. Bioinformatics 2005;21(1 Suppl):i177–85. https://doi.org/10.1093/bioinformatics/bti1015.Search in Google Scholar PubMed
106. Veiga, DF, Cecconello, PS, Lucca, JED, Porto, LM. Extension of the IsaViz software for the representation of metabolic and regulatory networks. Braz Arch Biol Technol 2005;48:197–205. https://doi.org/10.1590/s1516-89132005000400025.Search in Google Scholar
107. Metacore; 2024. Available from: https://libraries.emory.edu/health/subject-resources/resources/analysis-tools/metacore.Search in Google Scholar
108. Karp, PD, Riley, M, Saier, M, Paulsen, IT, Collado-Vides, J, Paley, SM, et al.. The EcoCyc database. Nucleic Acids Res 2002;30:56–8. https://doi.org/10.1093/nar/30.1.56.Search in Google Scholar PubMed PubMed Central
109. Jourdan, F, Breitling, R, Barrett, MP, Gilbert, D. MetaNetter: inference and visualization of high-resolution metabolomic networks. Bioinformatics 2008;24:143–5. https://doi.org/10.1093/bioinformatics/btm536.Search in Google Scholar PubMed
110. Ulitsky, I, Gat-Viks, I, Shamir, R. MetaReg: a platform for modeling, analysis and visualization of biological systems using large-scale experimental data. Genome Biol 2008;9:R1. https://doi.org/10.1186/gb-2008-9-1-r1.Search in Google Scholar PubMed PubMed Central
111. Pinney, JW, Shirley, MW, McConkey, GA, Westhead, DR. metaSHARK: software for automated metabolic network prediction from DNA sequence and its application to the genomes of plasmodium falciparum and eimeria tenella. Nucleic Acids Res 2005;33:1399–409. https://doi.org/10.1093/nar/gki285.Search in Google Scholar PubMed PubMed Central
112. Yang, Y, Engin, L, Wurtele, ES, Cruz-Neira, C, Dickerson, JA. Integration of metabolic networks and gene expression in virtual reality. Bioinformatics 2005;21:3645–50. https://doi.org/10.1093/bioinformatics/bti581.Search in Google Scholar PubMed
113. Arakawa, K, Kono, N, Yamada, Y, Mori, H, Tomita, M. KEGG-based pathway visualization tool for complex omics data. Silico Biol 2005;5:419–23. https://doi.org/10.3233/isb-00199.Search in Google Scholar
114. Rojdestvenski, I. Metabolic pathways in three dimensions. Bioinformatics 2003;19:2436–41. https://doi.org/10.1093/bioinformatics/btg342.Search in Google Scholar PubMed
115. Bosman, DWJ, Blom, E-J, Ogao, PJ, Kuipers, OP, Roerdink, JBTM. MOVE: a multi-level ontology-based visualization and exploration framework for genomic networks. Silico Biol 2007;7:35–59. https://doi.org/10.3233/isb-00274.Search in Google Scholar
116. Mandel, JJ, Fuss, H, Palfreyman, NM, Dubitzky, W. Modeling biochemical transformation processes and information processing with narrator. BMC Bioinf 2007;8:103. https://doi.org/10.1186/1471-2105-8-103.Search in Google Scholar PubMed PubMed Central
117. Brohée, S, Faust, K, Lima-Mendez, G, Sand, O, Janky, R, Vanderstocken, G, et al.. NeAT: a toolbox for the analysis of biological networks, clusters, classes and pathways. Nucleic Acids Res 2008;36:W444–51. https://doi.org/10.1093/nar/gkn336.Search in Google Scholar PubMed PubMed Central
118. Wegner, K, Knabe, J, Robinson, M, Egri-Nagy, A, Schilstra, M, Nehaniv, C. The NetBuilder’ project: development of a tool for constructing, simulating, evolving, and analysing complex regulatory networks. BMC Syst Biol 2007;1:P72. https://doi.org/10.1186/1752-0509-1-s1-p72.Search in Google Scholar
119. Nodes3D. Internet Archive; 2024. Available from: https://web.archive.org/web/20120829032716/http://nodes3d.sourceforge.net/.Search in Google Scholar
120. Köhler, J, Baumbach, J, Taubert, J, Specht, M, Skusa, A, Rüegg, A, et al.. Graph-based analysis and visualization of experimental results with ondex. Bioinformatics 2006;22:1383–90. https://doi.org/10.1093/bioinformatics/btl081.Search in Google Scholar PubMed
121. ontoTools; 2024. Available from: https://bioconductor.org/packages/2.7/bioc/html/ontoTools.html.Search in Google Scholar
122. Breitkreutz, BJ, Stark, C, Tyers, M. Osprey: a network visualization system. Genome Biol 2003;4:R22. https://doi.org/10.1186/gb-2003-4-3-r22.Search in Google Scholar PubMed PubMed Central
123. Batagelj, V, Mrvar, A. Pajek – analysis and visualization of large networks. In: Graph drawing software, mathematics and visualization. Springer Berlin Heidelberg; 2004:77–103 pp. Available from: http://mrvar.fdv.uni-lj.si/pajek/.10.1007/978-3-642-18638-7_4Search in Google Scholar
124. PathArt; 2024. Internet Archive. Available from: https://web.archive.org/web/20090212181750/https://www.jubilantbiosys.com/pathart.html.Search in Google Scholar
125. Ho, JWK, Manwaring, T, Hong, SH, Roehm, U, Fung, DCY, Xu, K, et al.. Pathbank: web-based querying and visualization of an integrated biological pathway database. In: International conference on computer graphics, imaging and visualisation (CGIV’06); 2006:84–9 pp.Search in Google Scholar
126. Kandasamy, K, Keerthikumar, S, Raju, R, Keshava Prasad, TS, Ramachandra, YL, Mohan, S, et al.. PathBuilder–open source software for annotating and developing pathway resources. Bioinformatics 2009;25:2860–2. https://doi.org/10.1093/bioinformatics/btp453.Search in Google Scholar PubMed PubMed Central
127. Ozsoyoglu, ZM, Nadeau, JH, Ozsoyoglu, G. Pathways database system. OMICS 2003;7:123–5. https://doi.org/10.1089/153623103322006779.Search in Google Scholar PubMed
128. Mendes, P, Bulmore, DL, Farmer, AD, Steadman, PA, Waugh, ME, Wlodek, ST. PathDB: a second generation metabolic database. In: Hofmeyr, JHS, Rohwer, JM, Snoep, JL, editors. Proc. international BioThermoKinetics meeting. Stellenbosch University Press; 2000:207–12 pp.Search in Google Scholar
129. Goesmann, A, Haubrock, M, Meyer, F, Kalinowski, J, Giegerich, R. PathFinder: reconstruction and dynamic visualization of metabolic pathways. Bioinformatics 2002;18:124–9. https://doi.org/10.1093/bioinformatics/18.1.124.Search in Google Scholar PubMed
130. Pan, D, Sun, N, Cheung, K-H, Guan, Z, Ma, L, Holford, M, et al.. PathMAPA: a tool for displaying gene expression and performing statistical tests on metabolic pathways at multiple levels for arabidopsis. BMC Bioinf 2003;4:56. https://doi.org/10.1186/1471-2105-4-56.Search in Google Scholar PubMed PubMed Central
131. Minch, E, de Rinaldis, M, Weiss, S. pathSCOUT™: exploration and analysis of biochemical pathways. Bioinformatics 2003;19:431–2. https://doi.org/10.1093/bioinformatics/btf880.Search in Google Scholar PubMed
132. van Iersel, MP, Kelder, T, Pico, AR, Hanspers, K, Coort, S, Conklin, BR, et al.. Presenting and exploring biological pathways with PathVisio. BMC Bioinf 2008;9:399. https://doi.org/10.1186/1471-2105-9-399.Search in Google Scholar PubMed PubMed Central
133. Goo, YA, Li, Z, Pajkovic, N, Shaffer, S, Taylor, G, Chen, J, et al.. Systematic investigation of lycopene effects in LNCaP cells by use of novel large-scale proteomic analysis software. Proteonomics Clin Appl 2007;1:513–23. https://doi.org/10.1002/prca.200600511.Search in Google Scholar PubMed PubMed Central
134. Nikitin, A, Egorov, S, Daraselia, N, Mazo, I. Pathway studio–the analysis and navigation of molecular networks. Bioinformatics 2003;19:2155–7. https://doi.org/10.1093/bioinformatics/btg290.Search in Google Scholar PubMed
135. Pathway Builder 3.0; 2024. Available from: http://e.informer.com/proteinlounge.com/.Search in Google Scholar
136. Mlecnik, B, Scheideler, M, Hackl, H, Hartler, J, Sanchez-Cabo, F, Trajanoski, Z. PathwayExplorer: web service for visualizing high-throughput expression data on biological pathways. Nucleic Acids Res 2005;33:W633–7. https://doi.org/10.1093/nar/gki391.Search in Google Scholar PubMed PubMed Central
137. Grosu, P, Townsend, JP, Hartl, DL, Cavalieri, D. Pathway processor: a tool for integrating whole-genome expression results into metabolic networks. Genome Res 2002;12:1121–6. https://doi.org/10.1101/gr.226602.Search in Google Scholar PubMed PubMed Central
138. Karp, PD, Paley, S, Romero, P. The pathway tools software. Bioinformatics 2002;18(1 Suppl):S225–32. https://doi.org/10.1093/bioinformatics/18.suppl_1.s225.Search in Google Scholar PubMed
139. PathwayLab. Internet Archive; 2024. Available from: https://web.archive.org/web/20081118175917/http://www.innetics.com/download/download.htm.Search in Google Scholar
140. Eker, S, Knapp, M, Laderoute, K, Lincoln, P, Meseguer, J, Sonmez, K. Pathway logic: symbolic analysis of biological signaling. In: Proc. pacific symposium on biocomputing; 2002:400–12 pp. Available from: https://pl.csl.sri.com/index.html.10.1142/9789812799623_0038Search in Google Scholar
141. Demir, E, Babur, O, Dogrusoz, U, Gursoy, A, Nisanci, G, Cetin-Atalay, R, et al.. PATIKA: an integrated visual environment for collaborative construction and analysis of cellular pathways. Bioinformatics 2002;18:996–1003. https://doi.org/10.1093/bioinformatics/18.7.996.Search in Google Scholar PubMed
142. Lüdemann, A, Weicht, D, Selbig, J, Kopka, J. PaVESy: pathway visualization and editing system. Bioinformatics 2004;20:2841–4. https://doi.org/10.1093/bioinformatics/bth278.Search in Google Scholar PubMed
143. Rahman, SA, Advani, P, Schunk, R, Schrader, R, Schomburg, D. Metabolic pathway analysis web service (pathway hunter tool at CUBIC). Bioinformatics 2005;21:1189–93. https://doi.org/10.1093/bioinformatics/bti116.Search in Google Scholar PubMed
144. PhyloGrapher; 2024. Available from: http://atgc.org/PhyloGrapher/.Search in Google Scholar
145. Meil, A, Durand, P, Wojcik, J. PIMWalker: visualising protein interaction networks using the HUPO PSI molecular interaction format. Appl Bioinf 2005;4:137–9. https://doi.org/10.2165/00822942-200504020-00007.Search in Google Scholar PubMed
146. Orlev, N, Shamir, R, Shiloh, Y. PIVOT: protein interacions visualization tool. Bioinformatics 2004;20:424–5. https://doi.org/10.1093/bioinformatics/btg426.Search in Google Scholar PubMed
147. Heer, J, Card, SK, Landay, JA. prefuse: a toolkit for interactive information visualization. In: Proc. SIGCHI conference on human factors in computing systems, CHI ‘05. Association for Computing Machinery; 2005:421–30 pp. Available from: https://github.com/Prefuse.git.10.1145/1054972.1055031Search in Google Scholar
148. Chasson, AK, Phair, RD. ProcessDB: a cellular process database supporting large-scale integrative kinetic modeling in cell biology. In: 2nd international conference on systems biology (ICSB2001). Pasadena, CA: Citeseer; 2001. Available from: https://integrativebioinformatics.com/processdb/.Search in Google Scholar
149. Ginkel, M, Kremling, A, Nutsch, T, Rehner, R, Gilles, ED. Modular modeling of cellular systems with ProMoT/Diva. Bioinformatics 2003;19:1169–76. https://doi.org/10.1093/bioinformatics/btg128.Search in Google Scholar PubMed
150. Huan, T, Sivachenko, AY, Harrison, SH, Chen, JY. ProteoLens: a visual analytic tool for multi-scale database-driven biological network data mining. BMC Bioinf 2008;9(9 Suppl):S5. https://doi.org/10.1186/1471-2105-9-s9-s5.Search in Google Scholar PubMed PubMed Central
151. Proton. Internet Archive; 2024. Available from: https://web.archive.org/web/20090609223104/http://tunicata.techfak.uni-bielefeld.de/proton/web/main.jsp.Search in Google Scholar
152. Iragne, F, Nikolski, M, Mathieu, B, Auber, D, Sherman, D. ProViz: protein interaction visualization and exploration. Bioinformatics 2005;21:272–4. https://doi.org/10.1093/bioinformatics/bth494.Search in Google Scholar PubMed
153. PubGene; 2024. Available from: https://www.pubgene.com.Search in Google Scholar
154. Heymans, M, Singh, AK. Deriving phylogenetic trees from the similarity analysis of metabolic pathways. Bioinformatics 2003;19(1 Suppl):i138–46. https://doi.org/10.1093/bioinformatics/btg1018.Search in Google Scholar PubMed
155. pyNetConv – Network Conversion Tool; 2024. Available from: https://pynetconv.sourceforge.net.Search in Google Scholar
156. Novak, BA, Jain, AN. Pathway recognition and augmentation by computational analysis of microarray expression data. Bioinformatics 2006;22:233–41. https://doi.org/10.1093/bioinformatics/bti764.Search in Google Scholar PubMed
157. Joshi-Tope, G, Gillespie, M, Vastrik, I, D'Eustachio, P,Schmidt, E,de Bono, B,et al.. Reactome: a knowledge base of biological pathways. Nucleic Acids Res 2005;33:D428–432. https://doi.org/10.1093/nar/gki072.Search in Google Scholar PubMed PubMed Central
158. Paek, E, Park, J, Lee, KJ. Multi-layered representation for cell signaling pathways. Mol Cell Proteomics 2004;3:1009–22. https://doi.org/10.1074/mcp.m400039-mcp200.Search in Google Scholar
159. Hucka, M, Finney, A, Sauro, H, Bolouri, H, Doyle, J, Kitano, H. The ERATO systems biology workbench: an integrated environment for multiscale and multitheoretic simulations in systems biology. Cambridge, Massachusetts, USA: MIT Press; 2001:450–61 pp.10.1142/9789812799623_0042Search in Google Scholar PubMed
160. Pinney, JW, Starkovich, JM, Li, P, Robertson, DL. SHARKview: a tool for the visualization of systems biology data. BMC Syst Biol 2007;1:P33. https://doi.org/10.1186/1752-0509-1-s1-p33.Search in Google Scholar
161. Storey, M-A, Best, C, Michand, J. SHriMP views: an interactive environment for exploring java programs. In: Proc. international workshop on program comprehension. IWPC 2001; 2001:111–12 pp. Available from: https://thechiselgroup.org/shrimp/.10.1109/WPC.2001.921719Search in Google Scholar
162. Sarai, N, Matsuoka, S, Noma, A. simBio: a java package for the development of detailed cell models. Prog Biophys Mol Biol 2006;90:360–77. https://doi.org/10.1016/j.pbiomolbio.2005.05.008.Search in Google Scholar PubMed
163. Rost, U, Kummer, U. Visualisation of biochemical network simulations with SimWiz. Syst Biol 2004;1:184–9. https://doi.org/10.1049/sb:20045018.10.1049/sb:20045018Search in Google Scholar PubMed
164. Aitenbichler, E. Entwurf und Implementierung eines programmierten Graphersetzungssystems in Java [Ph.D. thesis]. TU Cottbus; 2000. Available from: https://www-dssz.informatik.tu-cottbus.de/DSSZ/Software/Snoopy.Search in Google Scholar
165. Sofia. Internet Archive; 2024. Available from: https://web.archive.org/web/20071119132143/http://www.biowisdom.com/content/sofia.Search in Google Scholar
166. Elkon, R, Vesterman, R, Amit, N, Ulitsky, I, Zohar, I, Weisz, M, et al.. SPIKE–a database, visualization and analysis tool of cellular signaling pathways. BMC Bioinf 2008;9:110. https://doi.org/10.1186/1471-2105-9-110.Search in Google Scholar PubMed PubMed Central
167. Weidemann, A, Richter, S, Stein, M, Sahle, S, Gauges, R, Gabdoulline, R, et al.. SYCAMORE–a systems biology computational analysis and modeling research environment. Bioinformatics 2008;24:1463–4. https://doi.org/10.1093/bioinformatics/btn207.Search in Google Scholar PubMed
168. TERANODE Design Suite. Internet Archive; 2024. Available from: https://web.archive.org/web/20060215032608/https://teranode.com/products/tds/biological_modeler.php.Search in Google Scholar
169. The Biochemical Pathways Database (BioPath). Internet Archive; 2024. Available from: https://web.archive.org/web/20090831011901/http://www.molecular-networks.com/databases/biopath/index.html.Search in Google Scholar
170. Tom Sawyer Visualization; 2024. Available from: https://www.tomsawyer.com.Search in Google Scholar
171. Hanisch, D, Sohler, F, Zimmer, R. ToPNet–an application for interactive analysis of expression data and biological networks. Bioinformatics 2004;20:1470–1. https://doi.org/10.1093/bioinformatics/bth096.Search in Google Scholar PubMed
172. Trost, E, Hackl, H, Maurer, M, Trajanoski, Z. Java editor for biological pathways. Bioinformatics 2003;19:786–7. https://doi.org/10.1093/bioinformatics/btg052.Search in Google Scholar PubMed
173. Lee, MS, Park, SS, Park, HS. Unipath: a knowledge representation system for biological pathways. Genome Inform 2003;14:681–2.Search in Google Scholar
174. Junker, BH, Klukas, C, Schreiber, F. VANTED: a system for advanced data analysis and visualization in the context of biological networks. BMC Bioinf 2006;7. https://doi.org/10.1186/1471-2105-7-109.Search in Google Scholar PubMed PubMed Central
175. VectorPathBlazer. Internet Archive; 2024. Available from: https://web.archive.org/web/20050404094223/http://invitrogen.com/content.cfm?pageid=10352.Search in Google Scholar
176. Hu, Z, Mellor, J, Wu, J, DeLisi, C. VisANT: an online visualization and analysis tool for biological interaction data. BMC Bioinf 2004;5:17. https://doi.org/10.1186/1471-2105-5-17.Search in Google Scholar PubMed PubMed Central
177. Holford, M, Li, N, Nadkarni, P, Zhao, H. VitaPad: visualization tools for the analysis of pathway data. Bioinformatics 2005;21:1596–602. https://doi.org/10.1093/bioinformatics/bti153.Search in Google Scholar PubMed
178. Zhang, B, Kirov, S, Snoddy, J. WebGestalt: an integrated system for exploring gene sets in various biological contexts. Nucleic Acids Res 2005;33:W741–8. https://doi.org/10.1093/nar/gki475.Search in Google Scholar PubMed PubMed Central
179. Han, K, Ju, BH, Jung, H. WebInterViewer: visualizing and analyzing molecular interaction networks. Nucleic Acids Res 2004;32:W89–95. https://doi.org/10.1093/nar/gkh462.Search in Google Scholar PubMed PubMed Central
180. Kelder, T, Pico, A, Iersel, M, Conklin, B, Evelo, C. WikiPathways: pathway editing for the people. In: 11Th annual international conference on research in computational biology; 2007. Available from: https://www.wikipathways.org.Search in Google Scholar
181. Ahmed, A, Dwyer, T, Murray, C, Song, L, Wu, YX. WilmaScope graph visualisation. In: IEEE symposium on information visualization; 2004:r4 p. Available from: https://sourceforge.net/projects/wilma/.10.1109/INFVIS.2004.77Search in Google Scholar
182. Schwarz, R, Liang, C, Kaleta, C, Kühnel, M, Hoffmann, E, Kuznetsov, S, et al.. Integrated network reconstruction, visualization and analysis using YANAsquare. BMC Bioinf 2007;8:313. https://doi.org/10.1186/1471-2105-8-313.Search in Google Scholar PubMed PubMed Central
183. Wiese, R, Eiglsperger, M, Kaufmann, M. yFiles: visualization and automatic layout of graphs. In: Mutzel, P, Jünger, M, Leipert, S, editors. Proc. international symposium on graph drawing (GD’01), volume 2265 of LNCS. Springer; 2001:453–4 pp. Available from: https://www.yworks.com.10.1007/3-540-45848-4_42Search in Google Scholar
184. Rohn, H, Junker, A, Hartmann, A, Grafahrend-Belau, E, Treutler, H, Klapperstück, M, et al.. VANTED v2: a framework for systems biology applications. BMC Syst Biol 2012;6. https://doi.org/10.1186/1752-0509-6-139.Search in Google Scholar PubMed PubMed Central
185. Keating, SM, Waltemath, D, König, M, Zhang, F, Dräger, A, Chaouiya, C, et al.. SBML level 3: an extensible format for the exchange and reuse of biological models. Mol Syst Biol 2020;16:e9110. https://doi.org/10.15252/msb.20199110.Search in Google Scholar PubMed PubMed Central
186. van Iersel, MP, Villéger, A, Czauderna, T, Boyd, SE, Bergmann, FT, Luna, A, et al.. Software support for SBGN maps: SBGN-ML and LibSBGN. Bioinformatics 2012;28:2016–21. https://doi.org/10.1093/bioinformatics/bts270.Search in Google Scholar PubMed PubMed Central
187. Kanehisa, M, Goto, S. KEGG: Kyoto encyclopedia of genes and genomes. Nucleic Acids Res 2000;28:27–30. https://doi.org/10.1093/nar/28.1.27.Search in Google Scholar PubMed PubMed Central
188. Brandes, U, Eiglsperger, M, Lerner, J, Pich, C. Graph markup language (GraphML). In: Tamassia, R, editor. Handbook on graph drawing and visualization. New York: Chapman and Hall/CRC; 2013:517–41 pp.Search in Google Scholar
189. Himsolt, M. GML: a portable graph file format. Technical report. University of Passau; 1996.Search in Google Scholar
190. Chelliah, V, Laibe, C, Le Novère, N. BioModels database: a repository of mathematical models of biological processes. Methods Mol Biol 2013;1021:189–99. https://doi.org/10.1007/978-1-62703-450-0_10.Search in Google Scholar PubMed
191. Hippe, K, Colmsee, C, Czauderna, T, Grafahrend-Belau, E, Junker, BH, Klukas, C, et al.. Novel developments of the metacrop information system for facilitating systems biological approaches. J Integr Bioinform 2010;7:125. https://doi.org/10.1515/jib-2010-125.Search in Google Scholar
192. Junker, A, Hartmann, A, Schreiber, F, Bäumlein, H. An engineer’s view on regulation of seed development. Trends Plant Sci 2010;15:303–7. https://doi.org/10.1016/j.tplants.2010.03.005.Search in Google Scholar PubMed
193. Vanted; 2024. Available from: https://www.vanted.org.Search in Google Scholar
194. Rohn, H, Hartmann, A, Junker, A, Junker, BH, Schreiber, F. FluxMap: a VANTED add-on for the visual exploration of flux distributions in biological networks. BMC Syst Biol 2012;6:33.1–9. https://doi.org/10.1186/1752-0509-6-33.Search in Google Scholar PubMed PubMed Central
195. Hartmann, A, Rohn, H, Pucknat, K, Schreiber, F. Petri nets in VANTED: simulation of barley seed metabolism. In: Proceedings of the 3rd international workshop on biological processes & petri nets; 2012:20–8 pp.Search in Google Scholar
196. Junker, BH, Koschützki, D, Schreiber, F. Exploration of biological network centralities with CentiBiN. BMC Bioinf 2006;7:e219. https://doi.org/10.1186/1471-2105-7-219.Search in Google Scholar PubMed PubMed Central
197. Grafahrend-Belau, E, Klukas, C, Junker, BH, Schreiber, F. FBA-SimViz: interactive visualisation of constraint-based metabolic models. Bioinformatics 2009;25:2755–7. https://doi.org/10.1093/bioinformatics/btp408.Search in Google Scholar PubMed PubMed Central
198. Czauderna, T, Klukas, C, Schreiber, F. Editing, validating, and translating of SBGN maps. Bioinformatics 2010;26:2340–1. https://doi.org/10.1093/bioinformatics/btq407.Search in Google Scholar PubMed PubMed Central
199. Melkus, G, Rolletschek, H, Fuchs, J, Radchuk, V, Grafahrend-Belau, E, Sreenivasulu, N, et al.. Dynamic 13C/1H NMR imaging uncovers sugar allocation in the living seed. Plant Biotechnol J 2011;9:1022–37. https://doi.org/10.1111/j.1467-7652.2011.00618.x.Search in Google Scholar PubMed
200. Rolletschek, H, Grafahrend-Belau, E, Munz, E, Radchuk, V, Kartäusch, R, Tschiersch, H, et al.. Metabolic architecture of the cereal grain and its relevance to maximize carbon use efficiency. Plant Physiol 2015;169:1698–713. https://doi.org/10.1104/pp.15.00981.Search in Google Scholar PubMed PubMed Central
201. Jax, E, Müller, I, Börno, S, Borlinghaus, H, Eriksson, G, Fricke, E, et al.. Health monitoring in birds using bio-loggers and whole blood transcriptomics. Sci Rep 2021;11:10815. https://doi.org/10.1038/s41598-021-90212-8.Search in Google Scholar PubMed PubMed Central
202. Weidemann, W, Klukas, C, Klein, A, Simm, A, Schreiber, F, Horstkorte, R. Lessons from GNE-deficient embryonic stem cells: sialic acid biosynthesis is involved in proliferation and gene expression. Glycobiology 2010;20:107–17. https://doi.org/10.1093/glycob/cwp153.Search in Google Scholar PubMed
203. Delp, J, Gutbier, S, Cerff, M, Zasada, C, Niedenführ, S, Zhao, L, et al.. Stage-specific metabolic features of differentiating neurons: implications for toxicant sensitivity. Toxicol Appl Pharmacol 2018;354:64–80. https://doi.org/10.1016/j.taap.2017.12.013.Search in Google Scholar PubMed
204. Zhu, Y, Czauderna, T, Zhao, J, Klapperstueck, M, Maifiah, MHM, Han, ML, et al.. Genome-scale metabolic modeling of responses to polymyxins in Pseudomonas aeruginosa. GigaScience 2018;7:giy021. https://doi.org/10.1093/gigascience/giy021.Search in Google Scholar PubMed PubMed Central
205. Ostaszewski, M, Niarakis, A, Mazein, A, Kuperstein, I, Phair, R, Orta-Resendiz, A, et al.. COVID19 disease map, a computational knowledge repository of virus-host interaction mechanisms. Mol Syst Biol 2021;17:e10387. https://doi.org/10.15252/msb.202110387.Search in Google Scholar PubMed PubMed Central
206. Grafahrend-Belau, E, Weise, S, Koschützki, D, Scholz, U, Junker, BH, Schreiber, F. MetaCrop – a detailed database of crop plant metabolism. Nucleic Acids Res 2008;36:D954–8. https://doi.org/10.1093/nar/gkm835.Search in Google Scholar PubMed PubMed Central
207. Klein, K, Garkov, D, Rütschlin, S, Böttcher, T, Schreiber, F. QSDB – a graphical quorum sensing database. Database 2021;2021:baab058. https://doi.org/10.1093/database/baab058.Search in Google Scholar PubMed PubMed Central
208. Ischebeck, T. Lipids in pollen – they are different. Biochim Biophys Acta Mol Cell Biol Lipids 2016;1861:1315–28. https://doi.org/10.1016/j.bbalip.2016.03.023.Search in Google Scholar PubMed
209. Prasch, CM, Sonnewald, U. Simultaneous application of heat, drought, and virus to arabidopsis plants reveals significant shifts in signaling networks. Plant Physiol 2013;162:1849–66. https://doi.org/10.1104/pp.113.221044.Search in Google Scholar PubMed PubMed Central
210. Schwender, J, Hebbelmann, I, Heinzel, N, Hildebrandt, T, Rogers, A, Naik, D, et al.. Quantitative multilevel analysis of central metabolism in developing oilseeds of oilseed rape during in vitro culture. Plant Physiol 2015;168:828–48. https://doi.org/10.1104/pp.15.00385.Search in Google Scholar PubMed PubMed Central
211. Schwender, J, König, C, Klapperstück, M, Heinzel, N, Munz, E, Hebbelmann, I, et al.. Transcript abundance on its own cannot be used to infer fluxes in central metabolism. Front Plant Sci 2014;5:668. https://doi.org/10.3389/fpls.2014.00668.Search in Google Scholar PubMed PubMed Central
212. Kumagai, S, Koyama, S, Itahashi, K, Tanegashima, T, Lin, Y, Togashi, Y, et al.. Lactic acid promotes pd-1 expression in regulatory t cells in highly glycolytic tumor microenvironments. Cancer Cell 2022;40:201–18. https://doi.org/10.1016/j.ccell.2022.01.001.Search in Google Scholar PubMed
213. Fujii, Y, Nguyen, TTT, Fujimura, Y, Kameya, N, Nakamura, S, Arakawa, K, et al.. Fecal metabolite of a gnotobiotic mouse transplanted with gut microbiota from a patient with Alzheimer’s disease. Biosci Biotechnol Biochem 2019;83:2144–52. https://doi.org/10.1080/09168451.2019.1644149.Search in Google Scholar PubMed
214. Niarakis, A, Ostaszewski, M, Mazein, A, Kuperstein, I, Kutmon, M, Gillespie, ME, et al.. Drug-target identification in COVID-19 disease mechanisms using computational systems biology approaches. Front Immunol 2024;14:1282859. https://doi.org/10.3389/fimmu.2023.1282859.Search in Google Scholar PubMed PubMed Central
215. Gehlenborg, N, O’Donoghue, SI, Baliga, NS, Goesmann, A, Hibbs, MA, Kitano, H, et al.. Visualization of omics data for systems biology. Nat Methods 2010;7:S56–8. https://doi.org/10.1038/nmeth.1436.Search in Google Scholar PubMed
216. Albrecht, M, Kerren, A, Klein, K, Kohlbacher, O, Mutzel, P, Paul, W, et al.. On open problems in biological network visualization. In: Eppstein, D, Gansner, ER, editors. Graph drawing, 17th international symposium, GD 2009, volume 5849 of LNCS. Springer; 2010:256–67 pp.10.1007/978-3-642-11805-0_25Search in Google Scholar
217. Purchase, HC, Hoggan, E, Görg, C. How important is the “mental map”? – An empirical investigation of a dynamic graph layout algorithm. In: Graph drawing: 14th internat. symp. Springer; 2007:184–95 pp.10.1007/978-3-540-70904-6_19Search in Google Scholar
218. Garkov, D, Klein, K, Klukas, C, Schreiber, F. Mental-map preserving visualisation of partitioned networks in Vanted. J Integr Bioinform 2019;16:26.1–7. https://doi.org/10.1515/jib-2019-0026.Search in Google Scholar PubMed PubMed Central
219. Jusufi, I, Klukas, C, Kerren, A, Schreiber, F. Guiding the interactive exploration of metabolic pathway interconnections. Inf Visual 2012;11:136–50. https://doi.org/10.1177/1473871611405677.Search in Google Scholar
220. Aichem, M, Czauderna, T, Zhu, Y, Zhao, J, Klapperstück, M, Klein, K, et al.. Visual exploration of large metabolic models. Bioinformatics 2021;37:4460–8. https://doi.org/10.1093/bioinformatics/btab335.Search in Google Scholar PubMed
221. Aichem, M, Klein, K, Kobourov, S, Schreiber, F. De-emphasise, aggregate, and hide: a study of interactive visual transformations for group structures in network visualisations. IEEE Trans Visual Comput Graph 2024. https://doi.org/10.1109/tvcg.2024.3397785.Search in Google Scholar
222. Koschützki, D, Junker, BH, Schwender, J, Schreiber, F. Structural analysis of metabolic networks based on flux centrality. J Theor Biol 2010;265:261–9. https://doi.org/10.1016/j.jtbi.2010.05.009.Search in Google Scholar PubMed
223. Koschützki, D, Schwöbbermeyer, H, Schreiberer, F. Ranking of network elements based on functional substructures. J Theor Biol 2007;248:471–9. https://doi.org/10.1016/j.jtbi.2007.05.038.Search in Google Scholar PubMed
224. Schreiber, F, Schwöbbermeyer, H. Frequency concepts and pattern detection for the analysis of motifs in networks. Trans Comput Syst Biol 2005;3:89–104. https://doi.org/10.1007/11599128_7.Search in Google Scholar
225. Eades, P, Gröne, N, Klein, K, Eades, P, Schreiber, L, Hailer, U, et al.. Drawing graphs as celtic knots and links. In: Bekos, MA, Chimani, M, editors. Proc. graph drawing and network visualization (GD), volume 14465 of lecture notes in computer science. Springer; 2023:18–35 pp.10.1007/978-3-031-49272-3_2Search in Google Scholar
226. Yugi, K, Kubota, H, Toyoshima, Y, Noguchi, R, Kawata, K, Komori, Y, et al.. Reconstruction of insulin signal flow from phosphoproteome and metabolome data. Cell Rep 2014;8:1171–83. https://doi.org/10.1016/j.celrep.2014.07.021.Search in Google Scholar PubMed
227. Ostaszewski, M, Mazein, A, Gillespie, ME, Kuperstein, I, Niarakis, A, Hermjakob, H, et al.. COVID-19 disease map, building a computational repository of SARS-CoV-2 virus-host interaction mechanisms. Sci Data 2020;7:136.1–4. https://doi.org/10.1038/s41597-020-0477-8.Search in Google Scholar PubMed PubMed Central
228. Dwyer, T, Rolletschek, H, Schreiber, F. Representing experimental biological data in metabolic networks. In: Chen, YP, editor. Proc. Asia-Pacific bioinformatics conference (APBC’04), volume 29 of CRPIT. ACS; 2004:13–20 pp.Search in Google Scholar
229. Borisjuk, L, Hajirezaei, M, Klukas, C, Rolletschek, H, Schreiber, F. Integrating data from biological experiments into metabolic networks with the DBE information system. Silico Biol 2005;5:93–102.Search in Google Scholar
230. Klukas, C, Koschützki, D, Schreiber, F. Graph pattern analysis with PatternGravisto. J Graph Algorithm Appl 2005;9:19–29. https://doi.org/10.7155/jgaa.00098.Search in Google Scholar
231. Rolletschek, H, Radchuk, R, Klukas, C, Schreiber, F, Wobus, U, Borisjuk, L. Evidence of a key role for photosynthetic oxygen release in oil storage in developing soybean seeds. New Phytol 2005;167:777–86. https://doi.org/10.1111/j.1469-8137.2005.01473.x.Search in Google Scholar PubMed
232. Eberhard, P, Kern, M, Aichem, M, Borlinghaus, H, Klein, K, Delp, J, et al.. PathwayNexus: a tool for interactive metabolic data analysis. Bioinformatics 2024;40:btae310. https://doi.org/10.1093/bioinformatics/btae310.Search in Google Scholar PubMed PubMed Central
233. Gröne, N, Grüneisen, B, Klein, K, de Bono, B, Czauderna, T, Schreiber, F. Layout of anatomical structures and blood vessels based on the foundational model of anatomy. J Integr Bioinform 2024;22:2024.0023. https://doi.org/10.1515/jib-2024-0023.Search in Google Scholar PubMed PubMed Central
234. Junker, A, Rohn, H, Czauderna, T, Klukas, C, Hartmann, A, Schreiber, F. Creating interactive, web-based and data-enriched maps using the systems biology graphical notation. Nat Protoc 2012;7:579–93. https://doi.org/10.1038/nprot.2012.002.Search in Google Scholar PubMed
235. Czauderna, T, Schreiber, F. Creating aesthetically pleasing SBGN visualisations for presentation and exploration. bioRxiv 2023;19:2023.12.23.573191.10.1101/2023.12.23.573191Search in Google Scholar
236. Mehlhorn, H, Schreiber, F. DBE2 – management of experimental data for the vanted system. J Integr Bioinform 2011;8:162.1–10. https://doi.org/10.1515/jib-2011-162.Search in Google Scholar
237. Schreiber, F, Colmsee, C, Czauderna, T, Grafahrend-Belau, E, Hartmann, A, Junker, A, et al.. MetaCrop 2.0: managing and exploring information about crop plant metabolism. Nucleic Acids Res 2012;40:D1173–7. https://doi.org/10.1093/nar/gkr1004.Search in Google Scholar PubMed PubMed Central
238. Colmsee, C, Czauderna, T, Grafahrend-Belau, E, Hartmann, A, Lange, M, Mascher, M, et al.. OPTIMAS-DW, MetaCrop and VANTED: a case study for data integration, curation and visualisation in life sciences. Proc Ontol Data Life Sci 2013;P-220:1834–40.Search in Google Scholar
239. Mehlhorn, H, Lange, M, Scholz, U, Schreiber, F. IDPredictor: predict database links in biomedical databases. J Integr Bioinform 2012;9:190.1–15.10.1515/jib-2012-190Search in Google Scholar
240. Mehlhorn, H, Schreiber, F. TransID – the flexible identifier mapping service. In: Proc. integrative bioinformatics – IB; 2013:112–21 pp.Search in Google Scholar
241. Ware, C, Franck, G. Viewing a graph in a virtual reality display is three times as good as a 2D diagram. In: Proc. IEEE symposium on visual languages, VL-94; 1994.Search in Google Scholar
242. Kerren, A, Schreiber, F. Why integrate infovis and scivis? An example from systems biology. IEEE Comput Graph Appl 2014;34:69–73. https://doi.org/10.1109/mcg.2014.122.Search in Google Scholar PubMed
243. Rohn, H, Klukas, C, Schreiber, F. Creating views on integrated multidomain data. Bioinformatics 2011;27:1839–45. https://doi.org/10.1093/bioinformatics/btr282.Search in Google Scholar PubMed PubMed Central
244. Chandler, T, Cordeil, M, Czauderna, T, Dwyer, T, Glowacki, J, Goncu, C, et al.. Immersive analytics. In: Proc. big data visual analytics – BDVA; 2015:73–80 pp.10.1109/BDVA.2015.7314296Search in Google Scholar
245. Marriott, K, Schreiber, F, Dwyer, T, Klein, K, Riche, NH, Itoh, T, et al.. Immersive analytics, volume 11190 of LNCS. Berlin Heidelberg: Springer; 2018.10.1007/978-3-030-01388-2Search in Google Scholar
246. Sommer, B, Schreiber, F. Integration and virtual reality exploration of biomedical data with CmPI and VANTED. IT Inf Technol 2017;59:181–90. https://doi.org/10.1515/itit-2016-0030.Search in Google Scholar
247. Sommer, B, Wang, SJ, Xu, L, Chen, M, Schreiber, F. Hybrid-dimensional visualization and interaction – integrating 2D and 3D visualization with semi-immersive navigation techniques. In: Proc. big data visual analytics – BDVA; 2015:65–72 pp.10.1109/BDVA.2015.7314295Search in Google Scholar
248. Aichem, M, Klein, K, Czauderna, T, Garkov, D, Zhao, J, Li, J, et al.. Towards a hybrid user interface for the visual exploration of large biomolecular networks using virtual reality. J Integr Bioinform 2022;19:20220034. https://doi.org/10.1515/jib-2022-0034.Search in Google Scholar PubMed PubMed Central
249. Bienroth, D, Nim, HT, Garkov, D, Klein, K, Jaeger-Honz, S, Ramialison, M, et al.. Spatially-resolved transcriptomics in immersive environments. Vis Comput Ind Biomed Art 2022;5:1–13. https://doi.org/10.1186/s42492-021-00098-6.Search in Google Scholar PubMed PubMed Central
250. Brandes, U, Dwyer, T, Schreiber, F. Visual understanding of metabolic pathways across organisms using layout in two and a half dimensions. J Integr Bioinform 2004;1:e2. https://doi.org/10.1515/jib-2004-2.Search in Google Scholar
251. Feyer, SP, Pinaud, B, Kobourov, SG, Brich, N, Krone, M, Kerren, A, et al.. 2D, 2.5D, or 3D? An exploratory study on multilayer network visualisations in virtual reality. IEEE Trans Vis Comput Graph 2023;30:469–79. https://doi.org/10.1109/tvcg.2023.3327402.Search in Google Scholar PubMed
252. Hucka, M, Nickerson, DP, Bader, GD, Bergmann, FT, Cooper, J, Demir, E, et al.. Promoting coordinated development of community-based information standards for modeling in biology: the COMBINE initiative. Front Bioeng Biotechnol 2015;3:19. https://doi.org/10.3389/fbioe.2015.00019.Search in Google Scholar PubMed PubMed Central
253. Schreiber, F, Bader, GD, Golebiewski, M, Gorochowski, TE, Hucka, M, Keating, SM, et al.. Specifications of standards in systems and synthetic biology. J Integr Bioinform 2015;12.10.1515/jib-2015-258Search in Google Scholar
254. Le Novère, N, Hucka, M, Mi, H, Moodie, S, Schreiber, F, Sorokin, A, et al.. The systems biology graphical notation. Nat Biotechnol 2009;27:735–41. https://doi.org/10.1038/nbt.1558.Search in Google Scholar PubMed
255. Rougny, A, Toure, V, Moodie, S, Balaur, I, Czauderna, T, Borlinghaus, H, et al.. Systems biology graphical notation: process description language level 1 version 2.0. J Integr Bioinform 2019;16:22.1–87. https://doi.org/10.1515/jib-2019-0022.Search in Google Scholar PubMed PubMed Central
256. Sorokin, AA, Le Novère, N, Luna, A, Czauderna, T, Demir, E, Haw, R, et al.. Systems biology graphical notation: entity relationship language level 1 version 2. J Integr Bioinform 2015;12:264.1–59. https://doi.org/10.2390/biecoll-jib-2015-264.Search in Google Scholar PubMed
257. Mi, H, Schreiber, F, Moodie, SL, Czauderna, T, Demir, E, Haw, R, et al.. Systems biology graphical notation: activity flow language level 1 version 1.2. J Integr Bioinform 2015;12:265.1–42. https://doi.org/10.1515/jib-2015-265.Search in Google Scholar
258. Czauderna, T, Wybrow, M, Marriott, K, Schreiber, F. Conversion of KEGG metabolic pathways to SBGN maps including automatic layout. BMC Bioinf 2013;14:250. https://doi.org/10.1186/1471-2105-14-250.Search in Google Scholar PubMed PubMed Central
259. Vogt, T, Czauderna, T, Schreiber, F. Translation of SBGN maps: process description to activity flow. BMC Syst Biol 2013;7:115. https://doi.org/10.1186/1752-0509-7-115.Search in Google Scholar PubMed PubMed Central
260. Kieser, S, Brown, J, Zdobnov, EM, Trajkovski, M, McCue, LA. ATLAS: a snakemake workflow for assembly, annotation, and genomic binning of metagenome sequence data. BMC Bioinf 2020;21:257. https://doi.org/10.1186/s12859-020-03585-4.Search in Google Scholar PubMed PubMed Central
© 2025 the author(s), published by De Gruyter, Berlin/Boston
This work is licensed under the Creative Commons Attribution 4.0 International License.
Articles in the same Issue
- Frontmatter
- Special Issue: 20 Years Journal of Integrative Bioinformatics; Guest Editor: Ralf Hofestädt
- Editorial – 20 years Journal of Integrative Bioinformatics
- Data management in balance – a decade of balancing pragmatism, sustainability and innovation at plant research center IPK Gatersleben
- Bioinformatic analysis of the regulatory potential of tagging SNPs provides evidence of the involvement of genes encoding the heat-resistant obscure (Hero) proteins in the pathogenesis of cardiovascular diseases
- Sustainable software development in science – insights from 20 years of Vanted
- Petri net modeling and simulation of post-transcriptional regulatory networks of human embryonic stem cell (hESC) differentiation to cardiomyocytes
- Regular contributions
- Designing an optimized theta-defensin peptide for HIV therapy using in-silico approaches