Export Similarity Networks and Proximity Control Methods for Comparative Case Studies
-
Sachin Gathani


Abstract
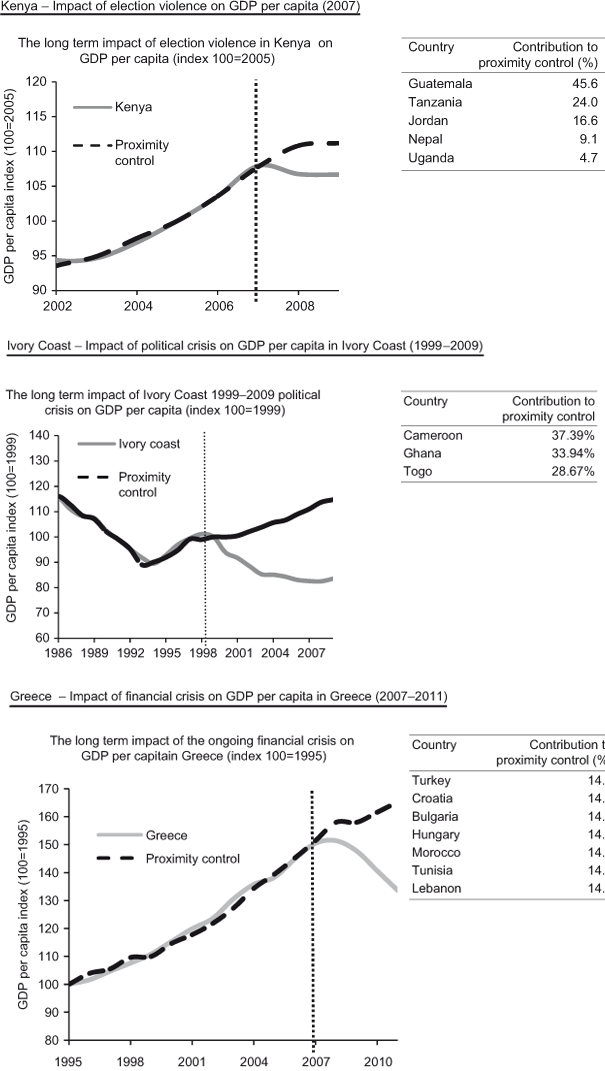
In the paper we explore just how similar the growth trajectory of countries with similar exports is, and exploit this similarity to conduct counter-factual analysis. We find that a synthetic combination of a country’s most similar exporters often perfectly matches economic growth in the reference country over a long period of time. We call this method Proximity Controls and apply it to the case of Indonesia’s 1997 financial and political crisis. We also highlight applications to the cases of political instability in Ivory Coast, election violence in Kenya and Greece’s debt crisis.
We are extremely grateful to Miguel Almunia, Jonathan Argent, Ricardo Hausmann, Cesar Hidalgo, Michele Savini, and Rupert Simons for their insights and advice.
7 Technical Annexes
7.1 Annex 1 – Revealed Comparative Advantage
The measure of revealed comparative advantage (RCA) we use is Balassa’s index, developed in 1965 (Balassa 1986). Balassa’s RCA index defines country i’s comparative advantage in product j as:
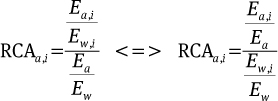
where RCAa,i is the revealed comparative advantage of country a in product i, Ea,i is total exports of country a in product i, Ew,i is total global export of product i, Ea is total exports of country a, and Ew total global exports. Basically what this formula measures is a country’s share of world exports of a specific product divided by its share of total world exports. A country is said to have a revealed comparative advantage in a certain product when its RCA in that product is >1, i.e., when the country’s share of world exports of that product is greater than the country’s share of global exports. This is the definition of revealed comparative advantage we use in this paper.
7.2 Annex 2 – Other Interesting Examples of Aggregate Impact
7.3 Annex 3
Comparing the Long-term Compounded Annual GDP per capita Growth Rates of Countries and their Three Closest Exporters in the 1995 Export Proximity Space (1995–2010).
| Reference Country | Most Similar Exporter | Second Most Similar Exporter | Third Most Similar Exporter | Compounded GDP per capita Growth Reference (%) | Compounded GDP per capita Growth Comparators (%) |
|---|---|---|---|---|---|
| Angola | Congo | Liberia | Yemen | 6.2 | 0.5 |
| Albania | Bangladesh | Vietnam | Dominican republic | 5.2 | 5.1 |
| UAE | Bangladesh | Madagascar | Honduras | –3.1 | 5.1 |
| Argentina | Uruguay | Australia | New Zealand | 2.7 | 2.6 |
| Armenia | Iran | Azerbaijan | Cuba | 7.3 | 2.0 |
| Australia | New Zealand | South Africa | Argentina | 2.0 | 1.5 |
| Austria | Czech republic | Germany | Italy | 1.7 | 1.1 |
| Azerbaijan | Uzbekistan | Turkmenistan | Tajikistan | 11.0 | 8.1 |
| Burundi | Congo, Dem. Rep. | Rwanda | Central African Republic | –0.4 | 1.2 |
| Burkina Faso | Niger | Mali | Ethiopia | 3.2 | 3.8 |
| Bangladesh | Sri Lanka | Vietnam | Albania | 4.0 | 3.9 |
| Bulgaria | Romania | Turkey | Poland | 3.5 | 4.1 |
| Bosnia Herzegovina | Albania | Bangladesh | Sri Lanka | 10.5 | 4.7 |
| Belarus | Ukraine | Lithuania | Russian federation | 7.5 | 5.0 |
| Bolivia | Paraguay | Peru | Nicaragua | 1.8 | 1.2 |
| Brazil | South Africa | Bulgaria | Slovak Republic | 1.8 | 0.3 |
| Central African Republic | Guinea | Congo, Dem. Rep. | Burundi | –0.5 | 1.2 |
| Canada | Finland | Sweden | South Africa | 1.6 | 1.8 |
| Switzerland, Liechtenstein | Germany | Austria | Japan | 1.1 | 1.4 |
| Chile | Peru | New Zealand | Argentina | 2.8 | 2.1 |
| China | Hong Kong | India | Czech republic | 9.1 | 5.5 |
| Ivory Coast | Cameroon | Ghana | Togo | –0.2 | 2.0 |
| Cameroon | Ivory Coast | Ghana | Tanzania | 1.5 | 1.5 |
| Congo | Congo, Dem. Rep. | Nigeria | Central African Republic | 1.2 | 1.2 |
| Colombia | Guatemala | El Salvador | Tunisia | 1.5 | 1.9 |
| Costa Rica | Guatemala | El Salvador | Honduras | 2.5 | 1.9 |
| Cuba | Mozambique | Ghana | Guinea | 4.7 | 3.6 |
| Czech republic | Italy | Austria | Germany | 2.7 | 1.7 |
| Germany | Italy | France | Czech republic | 1.2 | 1.7 |
| Denmark | Netherlands | Sweden | Poland | 0.9 | 1.2 |
| Dominican republic | Haiti | Bangladesh | Honduras | 4.2 | 3.4 |
| Algeria | Libya | Iran | Saudi Arabia | 2.0 | 1.2 |
| Ecuador | Ivory Coast | Chile | Senegal | 1.7 | 1.5 |
| Egypt | Pakistan | Morocco | Turkey | 3.1 | 3.6 |
| Eritrea | Ethiopia | Burkina Faso | Sudan | –1.7 | 3.1 |
| Spain | Italy | France | Belgium-Luxembourg | 1.7 | 1.7 |
| Ethiopia | Sudan | Mali | Burkina Faso | 4.4 | 3.3 |
| Finland | Sweden | Austria | Canada | 2.4 | 1.7 |
| France | Germany | Italy | United kingdom | 1.0 | 1.4 |
| United kingdom | USA | Germany | France | 2.0 | 1.4 |
| Georgia | Azerbaijan | Russian federation | Kazakhstan | 6.5 | 5.9 |
| Ghana | Guinea | Ivory Coast | Cameroon | 2.8 | 1.2 |
| Guinea | Ghana | Central African Republic | Mauritania | 3.4 | 1.5 |
| Greece | Turkey | Portugal | Croatia | 2.1 | 3.0 |
| Guatemala | El Salvador | Costa Rica | Colombia | 1.1 | 2.6 |
| Hong Kong | China | Thailand | India | 2.6 | 3.5 |
| Honduras | Costa Rica | Dominican republic | El Salvador | 1.6 | 1.5 |
| Croatia | Hungary | Portugal | Romania | 3.3 | 4.0 |
| Haiti | Dominican republic | Bangladesh | Nepal | –0.7 | 1.6 |
| Hungary | Poland | Croatia | Slovak Republic | 2.5 | 3.2 |
| Indonesia | Thailand | Hong Kong | Portugal | 2.4 | 4.7 |
| India | China | Hong Kong | Turkey | 5.3 | 3.5 |
| Israel | Greece | Switzerland, Liechtenstein | Hungary | 1.6 | 2.4 |
| Italy | Germany | Czech republic | France | 0.5 | 1.4 |
| Jordan | Lebanon | Kenya | Guatemala | 2.7 | 3.1 |
| Japan | Switzerland, Liechtenstein | Germany | USA | 0.7 | 1.2 |
| Kazakhstan | Kyrgyzstan | Russian federation | Ukraine | 6.1 | 4.4 |
| Kenya | Zimbabwe | Costa Rica | El Salvador | 0.8 | 1.9 |
| Kyrgyzstan | Kazakhstan | Uzbekistan | Moldova, republic of | 3.3 | 3.4 |
| Cambodia | Lao | Myanmar | Bangladesh | 6.1 | 5.0 |
| Korea, republic of | Hong Kong | Thailand | China | 3.6 | 5.5 |
| Lao | Cambodia | Myanmar | Bangladesh | 5.0 | 4.5 |
| Lebanon | Morocco | Tunisia | Greece | 2.5 | 3.5 |
| Liberia | Angola | Congo | Congo, Dem. Rep. | 11.0 | 4.5 |
| Sri Lanka | Vietnam | Philippines | Tunisia | 4.2 | 3.5 |
| Lithuania | Poland | Croatia | Romania | 5.1 | 3.2 |
| Morocco | Tunisia | Sri Lanka | Lebanon | 3.3 | 4.5 |
| Moldova, republic of | Lithuania | Ukraine | Lebanon | 2.8 | 3.5 |
| Madagascar | Bangladesh | Myanmar | Vietnam | –0.1 | 5.1 |
| Mexico | Thailand | Brazil | Turkey | 1.6 | 4.7 |
| Mali | Burkina Faso | Ethiopia | Sudan | 2.4 | 2.4 |
| Mozambique | Tanzania | Ghana | Cuba | 4.9 | 1.9 |
| Mauritania | Somalia | Senegal | Yemen | 1.4 | 2.2 |
| Malawi | Tanzania | Bangladesh | Togo | 1.6 | 1.9 |
| Malaysia | Singapore | Thailand | Indonesia | 2.5 | 1.9 |
| Niger | Burkina Faso | Ethiopia | Sudan | 0.3 | 2.4 |
| Nigeria | Congo, Dem. Rep. | Cameroon | Ethiopia | 2.8 | 1.2 |
| Nicaragua | Honduras | Costa Rica | Dominican republic | 2.1 | 2.8 |
| Netherlands | Belgium-Luxembourg | Denmark | USA | 1.8 | 1.5 |
| Norway | Finland | Sweden | Russian federation | 1.4 | 1.8 |
| Nepal | Bangladesh | Haiti | Madagascar | 2.0 | 5.1 |
| New Zealand | Australia | Denmark | Ireland | 1.3 | 1.9 |
| Pakistan | Egypt | Morocco | Sri Lanka | 2.0 | 2.6 |
| Panama | Thailand | Morocco | Tunisia | 3.9 | 4.7 |
| Peru | Chile | Pakistan | Honduras | 3.2 | 2.4 |
| Philippines | Sri Lanka | Vietnam | Thailand | 2.3 | 3.9 |
| Papa New Guinea | Yemen | Congo, Dem. Rep. | Guinea | –0.1 | 0.6 |
| Poland | Romania | Hungary | Slovak Republic | 4.5 | 4.1 |
| Portugal | Turkey | Croatia | Greece | 1.4 | 3.0 |
| Paraguay | Nicaragua | Ivory Coast | Bolivia | 0.6 | 2.8 |
| Romania | Poland | Bulgaria | Slovak Republic | 2.8 | 3.2 |
| Russian federation | Ukraine | South Africa | Belarus | 4.0 | 5.0 |
| Rwanda | Congo, Dem. Rep. | Burundi | Central African Republic | 3.8 | 1.2 |
| Saudi Arabia | UAE | Libya | Iran | 0.4 | 1.8 |
| Sudan | Ethiopia | Mali | Burkina Faso | 3.8 | 3.1 |
| Senegal | Tanzania | Mauritania | Togo | 1.4 | 1.9 |
| Singapore | Malaysia | Hong Kong | Japan | 3.1 | 2.5 |
| Sierra Leone | Ghana | Guinea | Senegal | 2.1 | 1.5 |
| El Salvador | Guatemala | Costa Rica | Sri Lanka | 1.7 | 1.9 |
| Slovak Republic | Romania | Poland | Hungary | 4.2 | 4.1 |
| Sweden | Finland | Austria | Denmark | 2.2 | 1.8 |
| Syria | Bangladesh | Lebanon | Morocco | 1.5 | 5.1 |
| Chad | Somalia | Mauritania | Sudan | 3.7 | 2.2 |
| Togo | Ivory Coast | Malawi | Cameroon | 0.2 | 1.5 |
| Thailand | Indonesia | Hong Kong | China | 2.0 | 2.0 |
| Tajikistan | Uzbekistan | Azerbaijan | Turkmenistan | 4.3 | 8.1 |
| Turkmenistan | Azerbaijan | Uzbekistan | Sudan | 9.0 | 5.9 |
| Tunisia | Morocco | Sri Lanka | Vietnam | 3.7 | 3.5 |
| Turkey | Portugal | Greece | India | 2.5 | 2.6 |
| Tanzania | Uganda | Zambia | Madagascar | 3.3 | 2.4 |
| Uganda | Tanzania | Malawi | Myanmar | 3.7 | 1.9 |
| Ukraine | Russian federation | Belarus | Bulgaria | 2.9 | 4.0 |
| Uruguay | Argentina | New Zealand | Tunisia | 2.6 | 2.0 |
| USA | United kingdom | Germany | France | 1.5 | 1.2 |
| Uzbekistan | Azerbaijan | Turkmenistan | Tajikistan | 4.3 | 5.9 |
| Venezuela | Kazakhstan | Russian federation | Ecuador | 0.5 | 3.4 |
| Vietnam | Sri Lanka | Philippines | Bangladesh | 5.8 | 3.9 |
| Yemen | Somalia | Mauritania | Papa New Guinea | 1.4 | 2.2 |
| South Africa | Australia | Zimbabwe | Brazil | 1.6 | 1.9 |
| Congo, Dem. Rep. | Nigeria | Congo | Burundi | –0.8 | 1.7 |
| Zambia | Tanzania | Zimbabwe | Uganda | 2.1 | 1.9 |
| Zimbabwe | South Africa | Guatemala | Egypt | –3.1 | 0.3 |
- 1
In this paper we define capabilities as all the inputs, infrastructure (soft and hard), processes, technology and skills required to produce a certain product with a comparative advantage. Amongst others, this includes endowments (minerals, geography, etc.) and non-tradable capabilities such as property rights, regulations, infrastructure, labor skills, etc.
- 2
See Annex 1 for a definition of revealed comparative advantage.
- 3
Gaulier and Zignago (2010).
- 4
Barro et al., April 2010.
- 5
Please note that this measure of proximity can be expanded to include triplets, quadruplets, quintuplets, etc., of countries, rather than simply pairs. A measure of proximity based on n-tuplets, would measure the similarity in the exports of n countries, resulting in exponentially increasing combinations of countries.
- 6
This network representation was designed using Cytoscape 2.8.3. For more information see http://www.cytoscape.org/.
- 7
See Sachin Gathani and Dimitri Stoelinga (2011).
- 8
There is no particular reason why one case study was selected over another. The only criteria we had was to find some interesting case studies to highlight how this methodology works.
- 9
See Stefan EklÖf (2004).
- 10
We exclude Turkey, which experienced a major financial crisis itself during the 1999–2001 period.
- 11
We measure how well proximity controls match growth in Indonesia before the East Asian financial crisis using the squared sum of the difference between the indexed GDP per capita of Indonesia and each individual proximity control between 1990–1997.
References
Abadie, A. and J. Gardeazabal (2003) “The Economic Costs of Conflict: A Case Study of the Basque Country,” American Economic Review, 93(1):113–132.10.1257/000282803321455188Search in Google Scholar
Abadie, A., A. Diamond and J. Hainmueller (2010) “Synthetic Control Methods for Comparative Case Studies: Estimating the Effect of California’s Tobacco Control Program,” Journal of the American Statistical Association, 105:493–505.10.1198/jasa.2009.ap08746Search in Google Scholar
Bahar, D., R. Hausmann and C. Hidalgo (2012) International Knowledge Diffusion and the Comparative Advantage of Nations. CID Working Paper, 235.10.2139/ssrn.2087607Search in Google Scholar
Balassa, B. (1986) “Comparative Advantage in Manufactured Goods – A Reappraisal,” The Review of Economics and Statistics, 68:315–319.10.2307/1925512Search in Google Scholar
Barro, R. J. and J.-W. Lee (2010). “A New Data Set of Educational Attainment in the World, 1950–2010,” NBER Working Papers 15902, National Bureau of Economic Research, Inc.10.3386/w15902Search in Google Scholar
Finger, M. and M. Kreinin (1979) “A Measure of ‘Export Similarity’ and Its Possible Uses,” Economic Journal, 89:905–912.10.2307/2231506Search in Google Scholar
Gaulier, G. and S. Zignago (2010) BACI: International Trade Database at the Product-level The 1994–2007 Version. CEPII Working Paper 2010–2023.10.2139/ssrn.1994500Search in Google Scholar
Hausmann, R. and B. Klinger. (2006) Structural Transformation and Patterns of Comparative Advantage in the Product Space. Working Paper Series rwp06-041, Harvard University, John F. Kennedy School of Government.10.2139/ssrn.939646Search in Google Scholar
Hausmann, R. and C. Hidalgo (2008) “A Network View of Economic Development”, Developing Alternatives 12(1):5–10.Search in Google Scholar
Hausmann, R. and C. Hidalgo (2009) “The Building Blocks of Economic Complexity,” Proc. Natl. Acad. Sci. USA 106(26):10570–10575.10.1073/pnas.0900943106Search in Google Scholar
Hausmann, R. and C. Hidalgo (2011) “The Network Structure of Economic Output,” Journal of Economic Growth, Springer 16(4):309–342.10.1007/s10887-011-9071-4Search in Google Scholar
Hausmann, R., C. Hidalgo, B. Klinger and A.-L. Barabasi (2007) “The Product Space Conditions the Development of Nations,” Science 317:482–487.10.1126/science.1144581Search in Google Scholar
Lin, J. and C. Monga (2010) The Growth Report and New Structural Economics. No. 5336, Policy Research Working Paper, World Bank.Search in Google Scholar
©2012 by Walter de Gruyter Berlin Boston
Articles in the same Issue
- Research Foundation
- Caught in a Poverty Trap? Testing for Single vs. Multiple Equilibrium Models of Growth
- Macroeconomic Policy Coordination in a Competitive Real Exchange Rate Strategy for Development
- Policy Analysis
- The Declining Labor Share of Income
- The Structure and Dynamics of International Development Assistance
- Latin America’s Trade and Growth Patterns, the China Factor, and Prebisch’s Nightmare
- Export Similarity Networks and Proximity Control Methods for Comparative Case Studies