The Netherlands’ Minimum Wage 1969–2022: Can We Learn from Decline?
-
Wiemer Salverda


Abstract
This paper evaluates the evolution of the Dutch minimum wage since its introduction in 1969 and discusses this as an intriguing case suggesting that a deeper, economic analysis of firm and employee behaviours is required for minimum-wage analysis in general. The real level of the minimum wage has fallen tremendously after 1979, all the way back nowadays to the level of the early 1970s, due to the system of uprating and to government interventions. The minimum-wage employment share shows an even stronger decline after 1979, but, surprisingly, the share below the unchanged real minimum wage of 1979 and in bands above this has remained largely unchanged. Intriguingly, firms have continued paying the same. Composition shifts in minimum-wage employment are significant, towards larger enterprise on the demand side and towards part-time employees on the supply side. Nationally and internationally, virtually all available minimum-wage analyses of employment effects focus on rises of the minimum wage and ignore drops. However, OECD data show that declines are surprisingly frequent, making them perfectly normal economic occurrences that firms will account for. I argue that declines deserve examination in their own right, certainly also from a monopsonistic perspective. Plausibly, declines incite different responses from increases, and their analysis will require the examination of heterogeneous behaviour of both firms and employees. Such analysis will reinforce the economics of minimum-wage analysis as advocated by David Neumark and its integration in labour economics as advocated by David Card.
I am grateful to Stephen Bazen, Joop Hartog and John Schmitt for their comments and suggestions on earlier drafts, without implying that they necessarily share all arguments expressed in the article.
How can we generate more systematic evidence on the relationship between the bite of the minimum wage and estimated employment effects? David Neumark (2019, 324)
Once we accept that firms set wages, the analysis of wage setting becomes a part of labor economics David Card (2022, 1,086)
1 Introduction
As of January 2024, the hourly gross adult minimum wage in the Netherlands amounts to € 13.27, which corresponds with a monthly amount of € 2,069 (excluding 8 % statutory holiday allowance). This level of the minimum wage is commonly seen as high in international comparison, next to Luxembourg only. That contrasts strongly, however, with its low position relative to the national average wage and median wage: 19th and 21st, respectively, out of 27 countries with a minimum wage in 2022 according to the OECD, meaningfully different in international comparison.[1] It contrasts even more strongly with the Netherlands’ position at the very top of the relative ranking in 1979, 1st out of 12 countries (5.6 pp above next-lower), down to 9th (3 pp below next-higher) among the same 12 in 2022.
The sea-change of minimum-wage decline incites a careful search for appropriate and consistent data over more than half a century. It finds, firstly, a strong long-run decline in both the real level, after deflation, and the relative level, compared to other wages, and, secondly, an even stronger decline in the share of minimum-wage employment. This joint decline motivates, thirdly, an examination of minimum wages internationally according to the OECD, which finds a surprisingly massive frequency of decreases of the minimum wage. That is followed, fourthly, by a first exploration of the potential implications that decreases have for the international literature of minimum-wage research, which focuses exclusively on effects of increasing the minimum wage. The Dutch minimum-wage experience appears to be no oddity but deserves further attention. Seemingly a black swan, it can tell us something important about the white swans populating econometricians’ minimum-wage research.
First, I contribute the most thorough evaluation to date of the evolution of the Dutch minimum wage and corresponding minimum-wage employment since its inception in 1969, and, second, I discuss the analytical significance of minimum-wage decrease, which characterises the Dutch experience and appears to be widely shared internationally but poses a new question to minimum-wage research, which is entirely focused on increases. The lay out is as follows. Section 2 describes the institutional features of the Dutch minimum wage, especially the uprating mechanism and government interference with it. Section 3 considers these features to explain the strong decline of the level that has characterised the minimum wage since 1979. Section 4 examines the evolution of minimum-wage employment with the help of (tabulated) data focused on hours worked, which I’ve brought together for this purpose (and explain with their imperfections in the Appendix). It declines even more strongly than the level of the minimum wage.
Section 5 turns to the research literature with regard to effects on employment.[2] It briefly discusses Dutch studies, which are few and derive employment elasticities from foreign studies. They completely ignore the steep decline in minimum-wage employment, in line with the increase-focused international literature. I argue that this is a basic shortcoming of the research literature and discuss the need for a proper treatment of decreases, real and relative, which the OECD minimum-wage database shows to be surprisingly frequent – more frequent, actually, than increases for the two Kaitz indices. In addition, the Dutch experience of the joint strong decline of level and employment share is largely paralleled by the American federal MW over the same years. Analysing decreases shines a light on employer behaviour that may also be relevant for analysing increases. It can help answering Neumark’s question above. It is beyond this contribution, however, to explore this empirically for the many countries experiencing declines. Section 6 summarises and concludes.
2 The Distinctive Regime of Dutch Minimum Wages
Stimulated by the introduction by social partners of a minimum wage in their collective agreements (CLAs) in 1964, the Netherlands introduced a statutory minimum wage (further: S-MW) by law in 1969.[3] The aim was and is that ‘if possible, the general evolution of prosperity be expressed in the incomes of employees earning the minimum wage and of persons entitled to benefits’.[4]
Four prominent features strongly impact the structure, level and employment share of the minimum wage.
The law concerns adults only, but a highly characteristic range of youth minimum wages (further: Y-MWs) for ages 15 to 22 was added by ministerial decree in 1974, expressed as percentages of the adult minimum wage[5] (implying a broad range of legal minimum wages with non-minimum wages in between),
Only since 1993 has the S-MW applied to employees working in small jobs of less than one-third of full-time hours, ending discrimination against women, and securing comprehensive coverage of all employees in private enterprise.
Twice yearly, by ministerial decree the level of the S-MW is increased according to the rise of CLA wages, while maximum every 4 years, the need of a special adjustment is evaluated; in 1992,[8] the minister was granted the legal right to decide against such adjustment if, expectedly, ‘the growth of wages would hurt employment or the growth of social benefits would necessitate a meaningful increase in taxation and social contributions’.
A most serious contextual feature regards the formal embedding of the S-MW in the Dutch regime of minimum incomes motivated by the desire that people on benefits will also share in the growth of prosperity. Since 1974, the backbone of this regime has been the so-called ‘net-net-coupling’ of the minimum income for a household of a couple to the minimum wage for an individual employee – both net after taxes and social contributions.[9] Obviously, through its regular uprating, this lends the S-MW a critical role in the evolution of a substantial part of public expenditure.[10]
The institutional design of the S-MW and government policy measures have together determined the evolution of the S-MW level and S-MW employment. Importantly, the significant share of youth (almost 50 %) and therewith of Y-MWs, which imply a sevenfold layer-upon-layer of Y-MW/non-Y-MW for ages 15–22, plus the changes made to Y-MWs on three occasions, taken together with the full-time hours variation across CLAs, and the inclusion of smaller jobs in 1993 all add complexity to the S-MW. They deprive it as an analytical concept of a clear and uniform economic meaning across the economy, which hampers the analysis of employment effects and may partly explain the lack of relevant Dutch studies below. Instead, I will focus on all employment up to the adult minimum wage, further mentioned as A-MW. Measurement is on a full-time basis first and on the basis of 36 weekly hours later, once the data concern hourly wages (1991–2021, see Appendix). The latter makes no difference to the monthly or weekly minimum-wage level but slightly overestimates hourly minimum wages for workers working more than 36 h (but this diminishes also the risk of a spike). Note that, in contrast with S-MW that includes youth only if paid their specific minimum wage, A-MW employment includes youth also when they are paid between their appropriate Y-MWs but less than the A-MW.[11] This A-MW has a single economic meaning both across the economy and over tim,e and it is also consistent with the policy change to an hourly basis of 2024. Section 3 examines how the level of the A-MW has evolved, and Section 4 considers corresponding A-MW employment.
3 Evolution of Dutch Minimum-Wage Level
After 1969, the real level of the A-MW, gross and deflated with consumer prices, first increases considerably (+43 %) up to 1979 (Figure 1). Next, up to 1997, it loses two-thirds of this gain or 22 % of its real value. Then, it increases slightly with ups and downs up to 2021 but suffers a steep decline in 2022, the year of 10 % inflation. Note that a special 10 %-increase wrought by the government in 2023 more than compensated for this decline and returned it to about the level reached in 2020, which, however, still barely equals the level of the year 1974. A stunning 50 years leave the minimum wage without any gain, on balance, in purchasing power. The relative level, compared to other wages, has fallen even more, as indicated by the median-based Kaitz index. Derived from OECD data, the only long-run statistic available, it shows the annual minimum wage including the holiday allowance as a percentage of full-time median actual annual earnings.[12] From a level of 66 % in 1979, the ratio fell to 46 % in 2022. This drop by one-third exceeds the real drop, reflecting the fact that median earnings have risen faster (+18 %) than prices.[13]
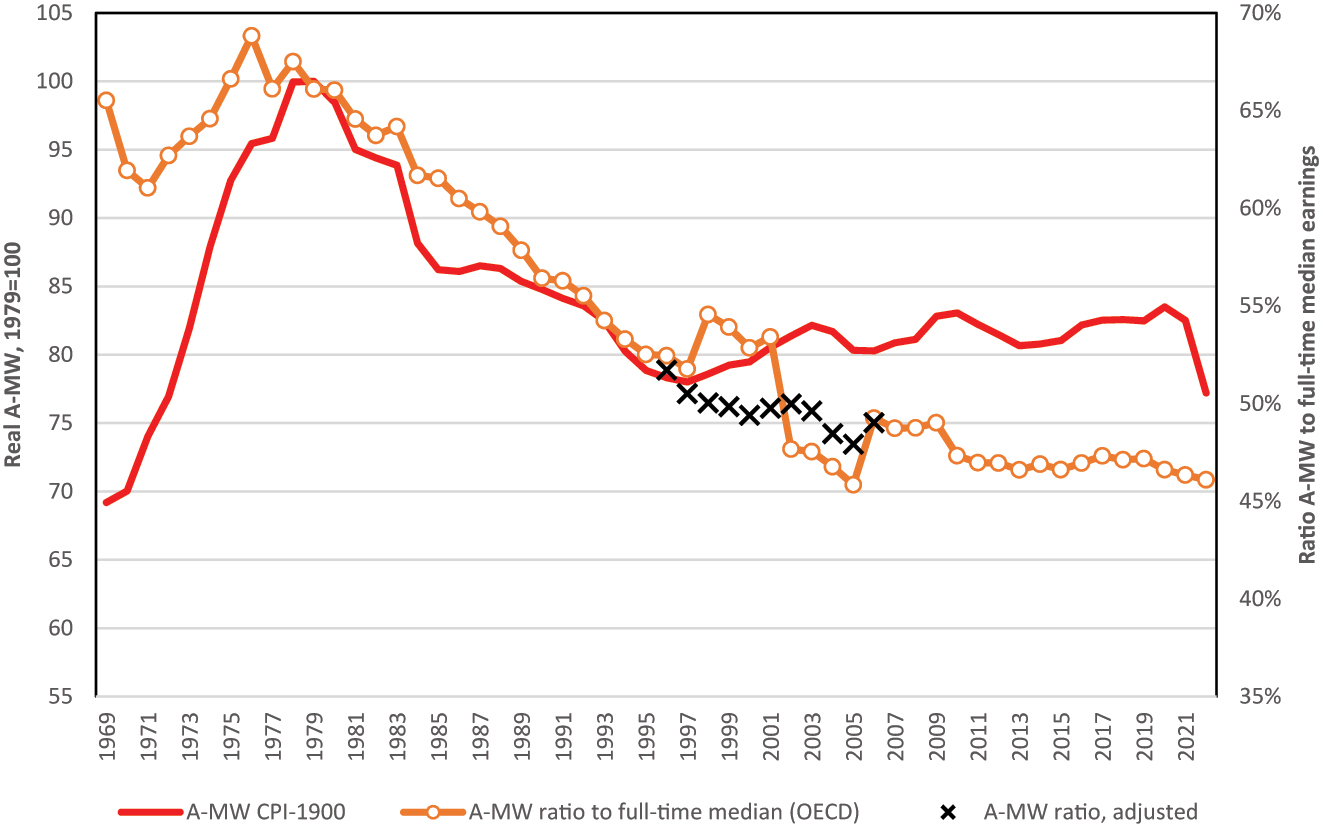
Adult minimum wage: real level (1979 = 100) and relative level (Kaitz index), 1969–2022. Note: the adjusted ratio for 1996–2006 tentatively corrects for a problem of statistical observation regarding the median wage. Sources: weekly A-MW according to Ministry of Social Affairs and Employment deflated by the CPI-1900 (consumer price index 1900 = 100) series from statistics Netherlands, full-time median earnings from OECD.
Both the nature of the uprating by the evolution of CLAs and the various measures taken by the government regarding the level and uprating of the minimum wage bear responsibility for the huge decline, real as well as relative. The uprating is not based on actual earnings but on collectively agreed wages. For this, a special CLA index number is used that is maintained by Statistics Netherlands. This index averages wage increases agreed in a selection of individual CLAs that are weighted by their numbers of covered employees, both CLAs and numbers being kept fixed for a duration of about 10 years each time before being updated. Unfortunately, it is impossible to evaluate the adequacy of the index for lack of information about individual CLAs and earnings covered by CLAs. In all probability, it significantly underestimates actual wage trends under CLAs, which in turn may underestimate trends in actual earnings.[14] Running actual wages, as used for the Kaitz indices and proposed by the recent EU Directive for minimum wages, seem a more accurate measure for national prosperity – composition change is part and parcel of that.
Indexed CLA-wages substantially lag behind actual average wage formation (Figure 2). They increase also up to 1979 and then fall significantly until 1985 (−12 %) but subsequently gradually halve this loss up to 2021 (−6%), only to lose this improvement in 2022 (−11 %).[15] Without government interventions, this would have been the decline of the minimum wage resulting from the regular uprating. The figure shows that average actual wages share the rise and decline of CLAs up to 1984 but subsequently rise in an almost straight line to a level 25 % higher in the 2010s than in 1979. In comparison with actual earnings, in 2021, the CLA-wage indexation misses out on prosperity growth by one quarter. The A-MW, however, continues to fall after the CLA decline stops, down to a low in 1997 (−22 %). There it largely remains, running again in parallel with (also stagnating) CLA wages.
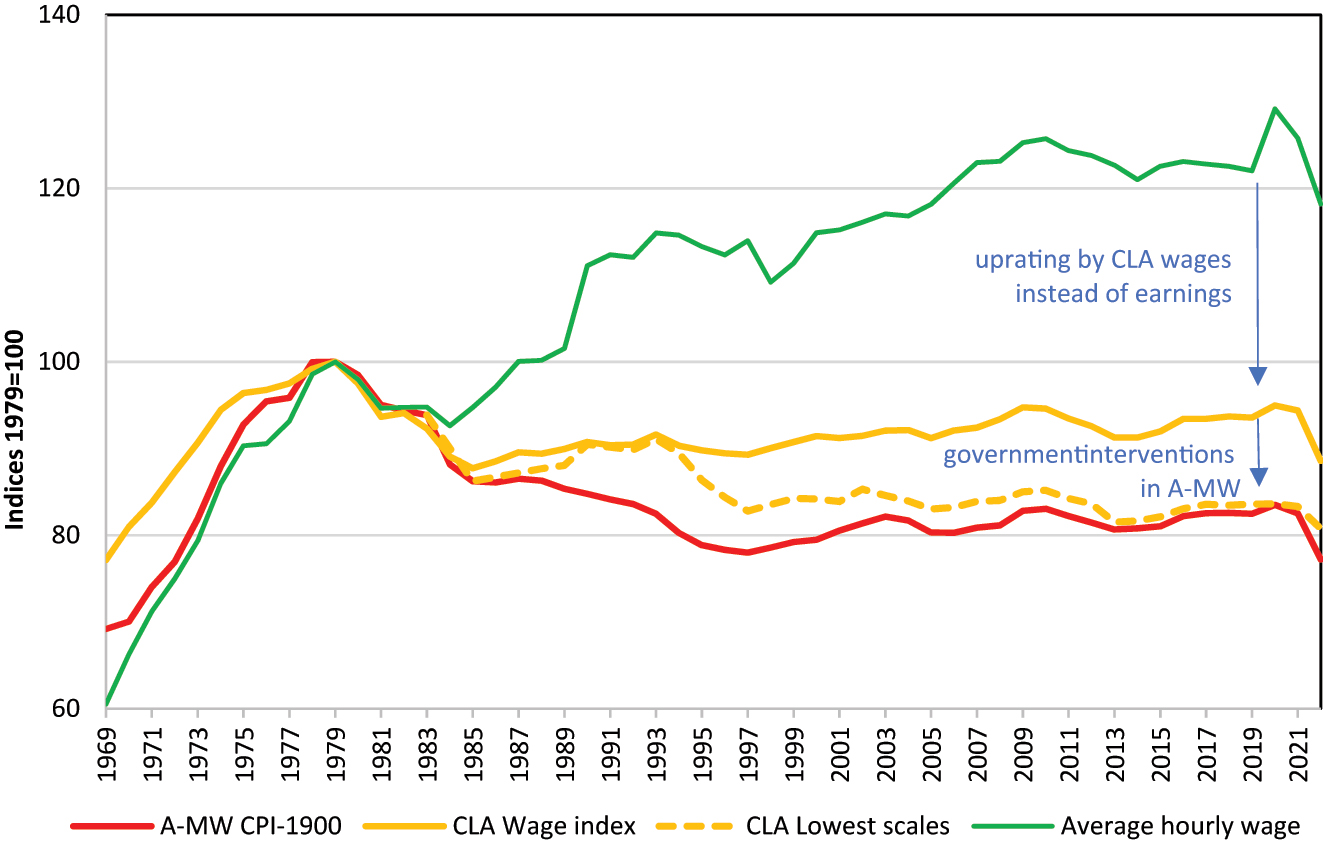
Adult minimum wage (A-MW) versus CLA wages and actual earnings, real, 1979 = 100, 1969–2022. Sources: see Figure 1; statistics Netherlands for CLA wage index and average actual hourly wage (derived from National Accounts).
The astonishing minimum-wage gap may be attributed to CLA wages in the first place (apart from the effect of the index’s construction as such). CLA wages are the very expression of the wage-moderation-without-end that has come to characterise the tripartite consensual socioeconomic decision-making, known as the ‘Polder Model’, of the Netherlands (Salverda 2008a, 2018a).[16] A structural problem of uprating on the basis of CLAs is that they increasingly miss out on high wages,[17] which obviously contributes to the gap with actual earnings. Plausibly, wage moderation holds median earnings down compared to average earnings, as shown by the steeper decline of the mean-based Kaitz index compared to the median-based one.
The moderation of CLA wages seems to rest partly on trade unions’ regulatory capture by the (consensual) idea that lowering wages would foster job chances for the low educated and restraining public expenditure employment in general. This conviction has lasted long after the 1980s. It has gone hand in hand with a strong decline in union membership rates between 1979 and 1988 (−12 pp) and a slower further decline (−8 pp) to a low of 16 % in 2023, which in a vicious circle has undermined unions’ negotiating force. While bargaining coverage remained largely unchanged,[18] employers may have been put more monopsonistically in the driver’s seat at CLA negotiations, reinforced by the fact that industry-level CLAs need to be declared legally binding for all firms in the industry by the Minister of Social Affairs and Employment conditional on sufficient representation (≥ 60 %, with a possible margin from 55 %) by the negotiating partners of all employees in the industry. The membership of employer associations with their number of employees is increasingly decisive for this, instead of employees’ union membership.
Secondly, drastic government interventions in the level and the uprating of the minimum wage bear responsibility for the fact that the A-MW has lagged behind CLA wages. Motivated by the effects of the second oil crisis deliberate interventions started[19] with a nominal freeze in July 1983 followed by a nominal lowering (−3%) as of 1 January 1984.[20] Frequent other government interventions (1984–1989, 1993–1995, 2004–2005) temporarily froze the A-MW despite continuing inflation and without restoration in later years. At the time, the interventions of the 1980s were a unique event in the European Union. In the 1990s, the government added to this by putting pressure on social partners to bring the lowest wage scales of the CLAs down to the level of the A-MW, threatening that otherwise CLAs would no longer be declared generally binding. This was argued as a means to promote employment chances for the less skilled and reduce unemployment among them. Indeed, the gap between the lowest scales and the A-MW (‘lowest scales’ in Figure 2) has been bridged, pretty rapidly from 1993 to 1997 and then more slowly, to virtual identity with the A-MW. Evidently, this opened up a gap between the CLA average and its lowest scales, a clear sign how unions and employers have given in to the pressure and to the idea that this would help the most severely unemployed category. The actual use of the scales, however, is unknown. Generally binding CLAs run a risk of creating a collective, government-supported monopsony that leaves no place to hide for labour supply, e.g. for youth in retail trade dominated by four or five large super market chains.[21]
Thus, the A-MW has stabilised at a much lower level than before and has never recovered from preceding interventions. On balance, between 1979 and 2022, one half of the decline of the real minimum wage by more than one fifth is due to the decline of indexed CLA wages and the other half to government interventions in the level and uprating of the A-MW. However, the A-MW’s decline compared to the purchasing power of actual earnings, i.e. prosperity, is largely due to the gap that has opened up between indexed CLA wages and average earnings.
4 Evolution of Dutch Minimum-Wage Employment
4.1 Two Measures of Minimum-Wage Employment
Employment effects are the focus of most minimum-wage research. Due to its complex features, the S-MW implies such a varied wage concept that it cannot be used as a clear and uniquely defined driving factor in an economic analysis of employment effects, be it macroeconomic or microeconomic. The statistic of S-MW employment is basically a legal statistic, not an economic observation of low wages. This motivates the use here of taking together all wages up to the level of the A-MW as a single uniform concept of measuring what has happened to employment given the drastic changes in the minimum-wage level. While S-MW counts youth earnings at the specific Y-MWs only, A-MW includes all earnings above the Y-MWs up to the A-MW. This inclusion of all lower wages does away with measurement error below the A-MW and ignores enforcement problems.[22]
The application of the A-MW still faces a complicated data situation of four separate distributions of wages that have been maintained by CBS during the life of the minimum wage since it was fully developed including the tail of youth minimum wages: 1974 to 1984, 1984 to 2005, 1991 to 2014 and 2006 to 2021 (unfortunately, missing 2022) (see Table A.1). The distributions differ by type of employees and concept of wage, and the first series also misses out on part of the economy, especially the public sector. The unit of observation makes a notable difference to the measurement due to the prevalence of part-time jobs: 5.1 % of jobs versus 4.1 % of hours worked for S-MW employment in 2021, and 11.9 % of jobs versus 5.9 % of hours, respectively, for A-MW. Jobs may shine a light on employers’ hiring efforts, but hours worked are arguably the better measure for an economic analysis of employment effects (Card and Krueger 1995, 185). Much of the minimum-wage literature observes persons but has difficulty answering the question what happens to their working hours. Hours also improve the consistency of the data over time for the purpose of this contribution and are insensitive to the significant shift towards part-time jobs especially for minimum-wage employment (Salverda 2010).
Nonetheless, A-MW employment shows a surprisingly consistent picture in spite of these data breaks (Figure 3). For measurement error above the A-MW, a sensitivity test counting people in up to 2.5 % above the A-MW lifts the employment share somewhat, on average by around 1 pp up to 1990 and 0.5 pp for 1991–2021, but leaves the long-run trend unchanged if not reinforcing it (not shown here). A-MW employment exceeds the S-MW shares by definition. It also smooths away the increase of the S-MW share in 1993 due to the inclusion of small jobs. High levels are reached before 1979, but their restriction to the private sector inflates the level compared to later years when the public sector became included. On balance, from 1979 to 2021, A-MW employment halves, from 12.9 % to 5.9 % (8.9 %–4.1 % for S-MW). The halving of the employment share is twice as steep a decline as that of the A-MW level itself.
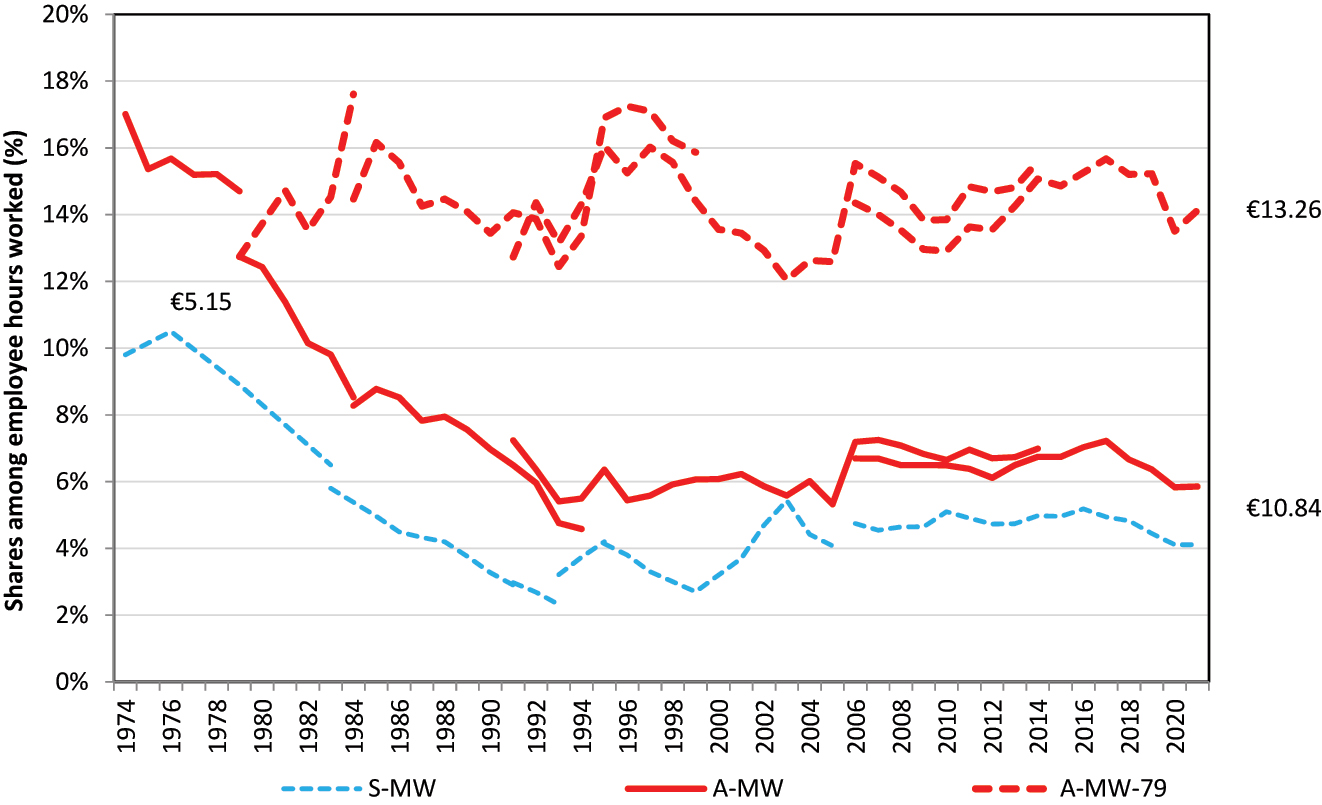
Employment shares (%) up to adult minimum wage (A-MW) versus statutory minimum wage (S-MW) and real adult minimum wage of 1979 (A-MW-79), 1974–2021. Source: author’s calculation using linear interpolation in classes of CBS wage distributions (see Appendix).
Notably, this sharp reduction differs from at least some rise that the simple competitive demand and supply model of the labour market (e.g. Neumark 2018, Figure 1) would in principle predict to result from a decrease of a minimum wage from a higher level down to, ultimately, the equilibrium wage.[23] Often this is interpreted as an aggregate own-wage elasticity of demand (OWE) affecting aggregate employment. However, any lower wage, including the minimum wage, is potentially attractive for employers and there is no a priori that this would not affect minimum-wage employment itself. Lichter, Peichl, and Siegloch (2014, 3) extensively evaluate demand elasticities and find a higher elasticity at the lower end of the labour market, which makes the common measurement of minimum wage employment effects by the OWE less appropriate. Cengiz et al. (2019, 1,407) develop their approach of wage bins partly to show that increasing the minimum wage does not causally affect wages higher up the distribution; in addition to wage bins, Bezooijen, Berge, and Salomons (2022, 21) distinguish a specific minimum-wage elasticity MWE next to the general OWE (and actually find it to be positive in the case of increasing youth minimum wages that they studied). The elasticity works both ways, for declining wages as for increasing wages, and is symmetrical in case of a linear demand curve.[24] For the minimum wage, this symmetry may not necessarily show up as increases are obligatory while decreases are not.[25] That may be the case in the short run, but it seems largely irrelevant in the longer run as new supply may be hired at the lower minimum wage[26] and long-run demand elasticities are thought to be higher compared to the short run.
Naturally, this is all in a ceteris paribus world and actual employment effects may depend on a host of other control factors commonly found in the literature (e.g. Manning 2021b). For example, such a lowering may discourage the supply of labour following its own-wage supply elasticity.[27] Thus, in practice, employers might not always find employees willing to be hired at the lower MW. This, however, seems highly unlikely in the present case in view of the ample supply of labour that became available at the same time (and the high personnel turnover in footnote 25). The steep decline of the MW went together with an unprecedented escalation of the rate of unemployment from 3.9 % in 1979 to 11.7 % in 1983, with a strong overrepresentation of youth and less educated persons (Salverda 1992, 1998) who are often candidates for minimum-wage jobs. This was followed by a gradual decline to an unemployment rate of 7.5 % in 1994, when the long period of minimum-wage employment decline ended – still with an ample supply at twice the level of 1979 and without any visible effect of rising demand. While from 1981 to 1983 employment declined by 5 %, it grew significantly thereafter (see Figure A.1) but minimum-wage numbers continued to fall with the declining share.
4.2 Employment Just Above the Minimum Wage
For an evaluation of the expectation that a lower minimum wage would not specifically benefit minimum-wage employment but employment growth more broadly, I consider the evolution of employment above the lowered minimum wage, where new wage options were opened for employers. This takes inspiration from the state-of-the-art studies of minimum-wage increase that aim to disaggregate employment effects by ‘wage bins’ below and above the minimum wage (Cengiz et al. 2019 – up to $ 4 below and above; Bezooijen, Berg, and Salomons 2021 – up to € 2.50).
I take a look, first, at the original, real level of the A-MW in 1979 (further: A-MW-79, Figure 3 dashed line) during the rest of the period, i.e. all wages below € 5.15 in 1979 inflated to € 13.26 in 2021, opening up a gap of € 2.42 to the A-MW (€ 10.84). Importantly, the employment share of A-MW-79 has not grown but has remained basically unchanged instead, hovering around 15 % of total hours worked albeit with some clear ups and downs. As such, this employment has evolved in line with total employment (Figure A.1) while the frozen level of real pay implies a decreasing share in total earnings, given the rise in the mean hourly wage (Figure 2; footnote 2). Apparently, the employment coverage of the A-MW-79 has hardly altered and its bite relative to the mean has fallen (not shown). The two results of A-MW and A-MW-79 should be seen as stylised facts of decline and stability, respectively. Equally important, though the share of the current A-MW fell from 100 % of A-MW-79 employment to around 40 %, this has hardly affected the wage distribution within the A-MW-79 segment. The upper half of total A-MW-79 employment remains largely unchanged at roughly between 83 % (€ 11.49) and 100 % of the wage level of the A-MW-79 – representing an unchanged wage bin with a width of € 2.35. The employment share up to half the level of the A-MW-79 mostly drifts around 2 %–3 % of total employment, which is close to half of A-MW employment since about 1990.[28]
In addition to this picture of ‘within’, little or no change occurs ‘above’, i.e. in the wage bands up to 10 % or 20 % above the threshold of A-MW-79 – two further wage bins of € 1.33 each (Figure 4). In total, this implies an unchanged density for the bottom quarter of the wage distribution. Evidently, it means a general long-run standstill of real wages for a large chunk of employees at the lower end of the wage distribution with a virtually unchanged density distribution within that chunk. The average increase in wages concentrates in the upper three quarters of the wage distribution as a whole. The very long duration implies a stable situation, unaffected by firms’ new hirings at the lower wages that were in principle enabled by the falling minimum wage. This represents a third stylised fact.
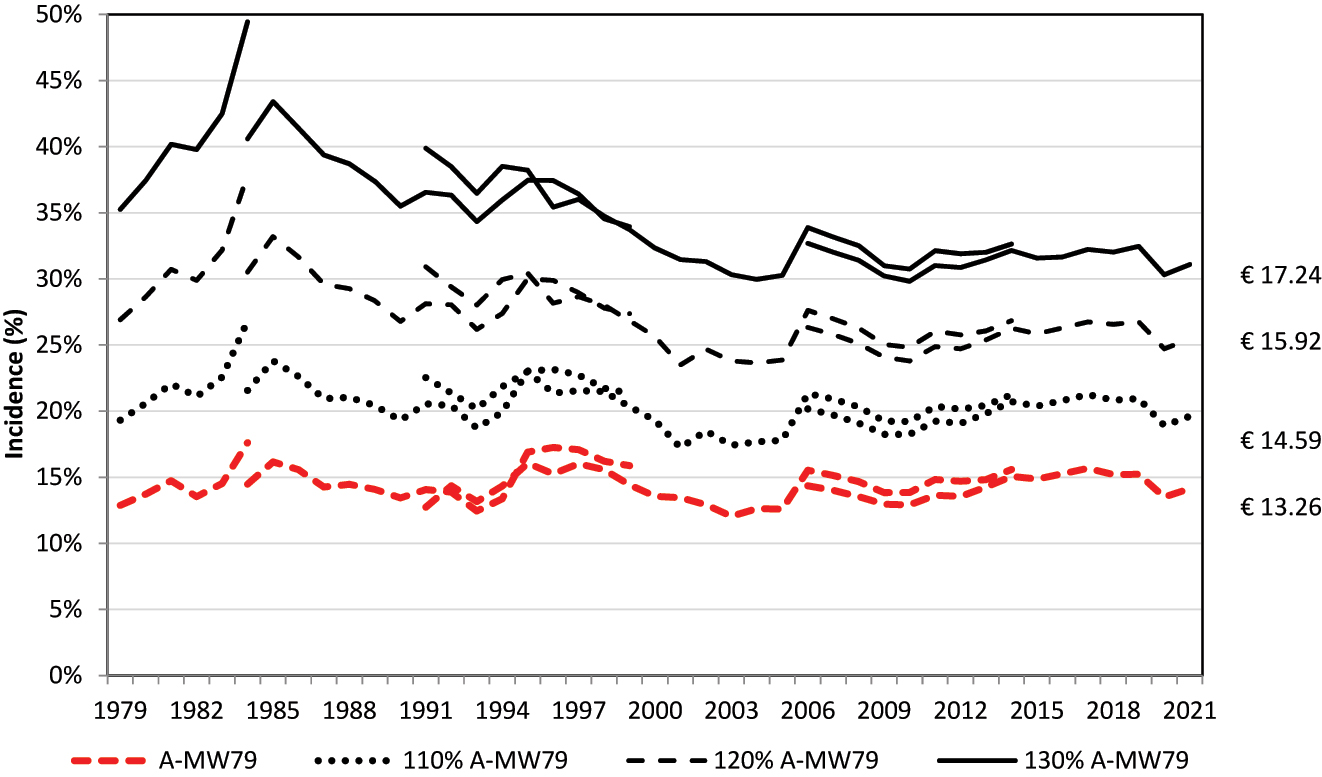
Employment shares (%), up to adult minimum wage of 1979 (A-MW-79) and bands above, 1979–2021. Source: author’s calculation using linear interpolation in classes of CBS wage distributions (see Appendix).
Only the third band to A-MW-79 plus 30 % shows more shrinkage (−9 pp), implying that part of it has shifted to higher real hourly wages. By contrast, low-wage employment, which is commonly defined as wages below or at 66 % of the median wage (€ 14.36 in 2021), does grow – from 11.5 % in 1979 to 18.6 % of all hours worked in 2021 (not shown). It reflects the 8 % rise in real value of the median wage while A-MW-79 remains unchanged: the growth of low-wage employment rests on the persistent stagnation of pay. A-MW employment happened to be almost identical to low-wage employment in the year 1979 but amounts to less than one-third of it in 2021. By then, A-MW-79 employment falls short of low-wage employment by one quarter (4.5 pp), while the A-WM-79 plus 10 % band virtually matches it in 2021. Note that the rise of the low-wage employment share implies an equally large shrinking of the band between 66 % and 100 % of the median wage, reducing its size from 39.5 % to 31.6 % of all hours. While the 10 % and 20 % bands above the minimum wage remain virtually unchanged, the thinning of the 30 % band may have other reasons than the evolution of the minimum wage, such as the famous job polarisation, in other words a contraction of middle-level occupations due to technological change (e.g. CPB 2023).
Potentially, the presence of CLAs could offer an explanation for the simultaneous fall of A-MW employment and A-MW level as they could prohibit employers to actually pay the lower S-MW where this falls short of the lowest CLA wage scales. However, witness Figure 2, those scales have been lowered down to the level of the very S-MW and became available for hiring. Consequently, the most of the long-run decline in minimum-wage employment may be interpreted as that employers have massively refrained for reasons to be clarified from following the decline of the A-MW and profit from the opportunity of paying lower wages than before.
4.3 Composition
The demographics[29] of general employment change significantly over the period: female employment expanded very significantly and youth employment shifted drastically from full-time to part-time in an overlap with prolonged participation in education. Surprisingly, these changes are hardly reflected in minimum-wage employment (S-MW): the share of females (all ages) actually decreases from 60 % to 50 % and that of youth remains virtually the same, on balance, at around 50 %. For A-MW-79 in 2021 (taken as S-MW plus 20 %), the female share declines somewhat less to 55 % and the youth share does show some decline to 45 %. These modest demographic changes go together with substantial changes in supply behaviour (in terms of jobs).[30] The share of part-time employment among S-MW employment doubles, from 31 % to 60 % in 2021.[31] Secondary earners in higher-income households have come to play a dominant role in low-wage employment and may entertain different preferences regarding, e.g. pay and occupational level versus working hours and commuting time (Salverda and Rook 2023; Salverda 2018b; Salverda and Thewissen 2018).[32] Demographic stability and simultaneous behavioural change define a fourth stylised fact.
Limited information is available on the characteristics of employers employing minimum-wage workers, but, fortunately, we can fathom the changes in firm size. Between 1979 and 2021, the share of small enterprise (< 10 employees) in S-MW employment halves from 39 % to 19 % while the role of larger enterprise (10+ employees) rises from 61 % to 81 %.[33] Behind this is not a shrinking share of small firms in total employment but a spectacular fall in the incidence of S-MW among them from 22 % to 6 %, while that of larger enterprise hardly declines (6 %–5 %). It leaves small firms only slightly overrepresented nowadays. For A-MW-79 employment in 2021 (again S-MW plus 20 %), the incidence among small firms (20 %) lies below that of 1979 while among larger enterprise it expands significantly from 6 % to 13 %.[34] About half of these changes concentrate in the period between 1979 and 1989 when the declines are steepest. Over those same years while S-MW employment more than halves the distribution of S-MW employment over branches of industry[35] does not really change. The combined share of the main contributors: agriculture, trade, and hotels, restaurants and catering (horeca), remains unchanged at 62 % while manufacturing and construction (−12 pp) trade places – plausibly quite literally – with growing temporary agency work (+11 %) as part of business services. After 1989, the incidence among small firms continues to decline gradually while that among larger enterprise grows. Compared to 1979, A-MW-79 employment in 2021 reduces trade employment (−24 pp) to the advantage of horeca (+6 pp) and, again, business services (+19 pp). Because small firms make up the vast mass of all firms (> 80 %), the halving of the minimum-wage incidence among them suggests a great reduction in the number of firms that are actually involved with minimum-wage employment. The increased role of larger enterprise points to a meaningful change in the nature of firms involved in minimum-wage employment, and largely within the same industries – a fifth stylised fact.
Together with the steep decline of the real and relative minimum wage, the five stylised facts raise important questions about the nature and significance of the bite of the minimum wage and its relationship with employment – Neumark’s issue. The diverging coverage of the current A-MW and the A-MW-79 and the shift towards larger firms cast doubt on traditional assumptions of firm behaviour regarding the minimum wage. Changing preferences of labour supply regarding the nature of jobs may have contributed to the standstill of real wages for the bottom quarter of wages.
5 The Importance of Analysing Minimum-Wage Decline
5.1 Dutch and International Literature
Also in the Netherlands, minimum-wage employment effects are a bone of contention in the political debate, perhaps more strongly even than in other countries because of the coupling with benefits and public finance. However, no Dutch study is available of the striking experience of the much-lowered minimum wage, let alone that minimum-wage employment more than withered with it. There is no lack of attention paid to minimum-wage effects in the country but independent studies are very few, also on minimum-wage increases. The CPB, the government’s main economic advisory body,[36] habitually advises on policy proposals concerning the S-MW. However, this mostly regards the effects on public finance following from the idiosyncratic coupling. Understandably, this is the government’s most pressing concern, and it may also be easier to examine than employment effects. Recent reports of CPB that deal with those effects notably derive the elasticities from the international literature (literally taking the median of six American studies, one German and one Hungarian), which are then applied to Dutch wage and employment data (CPB 2020a,b). Thus, the reports tend to move with the trend in the minimum-wage literature towards lower or zero elasticities and nowadays they proclaim much smaller effects than before (e.g. CPB 2016). Without independent checks of national elasticities, this work is better considered as simulations of foreign situations on Dutch data without regard for the specificities of the S-MW including the long tail of Y-MWs.
Three independent contributions do derive their results on the basis of Dutch microdata. All are partial and focus on the very recent event of changes made to Y-MWs in 2017–19, which have lifted the 22 and 21 year olds from their Y-MWs to the A-MW, and they have nothing to say about the effect of the S-MW overall nor on the lowering. Bezooijen, Berge, and Salomons (2021) adopt a difference-in-difference design with the wage-bins approach of Cengiz et al. (2019) and find a ‘robust absence of negative effects’ on employment and a substantial increase in income from earnings, which is largely due to spill-over effects. Two other studies performed at the request of the Ministry of Social Affairs and Employment (Werff, Zwetsloot, and Weel 2018; Zwetsloot et al. 2020) use also a difference-in-difference method and find no (short-run) effects on labour force participation and educational participation together with an increase in earnings. An interesting fourth study (Kabátek 2021) evaluates the effects that Y-MWs as a system may have on the employment chances of young individuals when they age and qualify for the next-higher Y-MW, with pretty steep steps (16 % on average).[37] It finds a clear effect that youth tend to be fired from their jobs when they approach their next birthday with its correspondingly higher minimum wage and are then replaced by a younger and cheaper person.
Therefore, I turn to the international literature where ‘the employment effect of the minimum wage is one of the most studied topics in all of economics’ (Schmitt 2015). Wolfson and Belman (2019) mention 800 English-language studies since 1991; plausibly 200 more may be added in other languages. In a long, especially American tradition, there are so many studies that comparative overviews and critical metastudies[38] are also multiplying (e.g. Belman and Wolfson 2014; Doucouliagos and Stanley 2009; Neumark and Wascher 2006), which, in turn, are scrutinised by further overviews and metastudies (Dube 2019; Neumark 2019; Neumark and Shirley 2022; Schmitt 2015; Wolfson and Belman 2019). Labour econometricians seem to keep each other occupied in a play of leapfrog – if not ‘trench warfare’ (Manning 2021b, 9). Along the way, the dominant view slowly but increasingly seems to become that employment effects are barely visible. It is as if workers in the ‘minimum wage’ zone (and perhaps a spill-over zone above) can be given a higher wage at will. An earlier qualification of the debate as generating ‘a lot of heat but not much light’ (Dolton, Bondibene, and Wadsworth 2012) may now be less to the point.
The growing econometrical sophistication along the way (Allegretto et al. 2017) is one explanation of the new insights but the prime reason is that the analysis was liberated by Card and Kruger (1994) from the a priori that employment could only decrease in response to an increase and that the question was by how much? Their ‘new economics of the minimum wage’ has fostered attention on the employer side and its heterogeneity. Traditionally a black box, light is now increasingly cast into this darkness with the help initially of researchers’ own establishment surveys (e.g. Card and Krueger 1994; Machin, Manning, and Rahman 2003) and progressively of large matched employer-employee datasets. This approach revives older arguments (Card et al. 2018; Lester 1946) arguing that when the price of labour mounts employers may have other ways at their disposal to respond than simply cutting jobs while they may vary also in their use of those other ways.
5.2 The International Significance of Minimum-Wage Declines
At the same time, virtually all studies and metastudies examine effects of raising the minimum wage, saying nothing about lowering it. It would be a mistake to consider the Dutch lowering an exception, a peculiar outcome needing no further attention. Scrutiny of the OECD’s minimum-wage database points to a much broader, international significance of minimum-wage reductions (Table 1). The database contains about 1,000 annual changes in 25 countries’ minimum-wage levels, nominal and relative, over the period 1961–2022. Admittedly, nominal lowerings basically concern only the Netherlands (1984) and, much later, Greece (2012, 2013).[39] However, the initial Dutch decrease is followed by successive nominal freezes generating a long-run decline in the real and relative value of the minimum wage, which are as material to firms’ employment decisions as formal increases of the minimum wage.
Real and relative minimum-wage changes, OECD databasesa 1960–2022.
| Real minimum-wage level | Relative minimum-wage ratio to | |||||||||
|---|---|---|---|---|---|---|---|---|---|---|
| Purchasing power | Mean wage | Median wage | ||||||||
| Number | % | Average | Number | % | Average | Number | % | Average | ||
| Total | 1,000 | 100 | 973 | 100 | 969 | 100 | ||||
| Decline | 348 | 35 | −2.4 % | 504 | 52 | −3.1 % | 485 | 50 | −3.0 % | |
| Increase | 651 | 65 | +4.8 %a | 445 | 46 | +3.6 % | 450 | 46 | +3.6 % | |
| Zero | 0 | 0 | 0 | 24 | 2 | 0 | 34 | 4 | 0 | |
|
|
||||||||||
| MW nominal level | Long-run shifts of countries from 2000 to 2022 | |||||||||
| Number | % | Average | Number | Average mean ratio | Average median ratio | |||||
|
|
||||||||||
| Total | 1,015 | 100 | 22 | |||||||
| Decline | 3 | 1 | −7.5 % | 7b | −5.0 pp | −4.4 pp | ||||
| Increase | 882 | 87 | +8.4 % | 15 | +10.0 pp | +12.1 pp | ||||
| Zero | 130 | 13 | 0 | |||||||
-
aExcluding very strong growth (175 %, 72 %) at the start of Polish MW. bAUS, BEL, FRA, IRL, LTH, NLD, USA. Notes: data cover 17 EU countries with minimum wages, Australia, Canada, Israel, Japan, Korea, New Zealand, UK and USA. Source: author’s calculations on OECD minimum wages at current prices, consumer prices indices and minimum relative to median and average wages of full-time workers.
The OECD data indicate that real declines (deflated by CPI’s) concern 35 % of all annual observations, with an average effect of −2.4 %, sufficiently large to allow and deserve further study.[40] Relative declines to the median or the mean Kaitz indices occur in no less than half of all cases, significantly more frequently even than positive changes and implying also that when the real minimum wage increases the median and average wage often rise more. These high frequencies imply serial declines that endure beyond a single annual change, witness the downward shift by 4.4 pp on average between 2000 and 2022 of the median-wage Kaitz in seven countries.[41] Thus, minimum-wage declines constitute a full-grown elephant in a room unnoticed by analysts who are busy scrutinising the little hairs at the end of the animal’s tail.
Unfortunately, the OECD offers no data on minimum-wage employment shares to match with these results, precluding adequate empirical research. But, tellingly, the long decline, both real and relative, of the Dutch minimum-wage level and employment since 1979 seems to be entirely shared by the American federal minimum wage (Figure 5), which is the principal subject of minimum-wage research. Secular trends of the level are largely the same in the two countries (panels A and B).[42] Ultimately, the greater volatility of the saw-tooth pattern caused by the notoriously difficult American political decision making on any rise and the more gradual development due to the Dutch regular uprating both produce almost the same result. The American employment share (panel C) concerns workers paid by the hour (55–60 % of all workers, next to salary workers).[43] In addition, this decline (known from 2002 to 2022 only) is largely shared between the US states (31) with own state minimum wages, which commonly exceed the federal one, and those (20) where only the federal minimum wage applies.[44] It leaves a surprisingly small difference in federal minimum-wage incidence in 2022: 1.1 % for the former 31 states versus 1.7 % for the other 20 states. Clearly, if the Dutch minimum wage would be a black swan of (joint) decline, it is in good company of another much sturdier one.
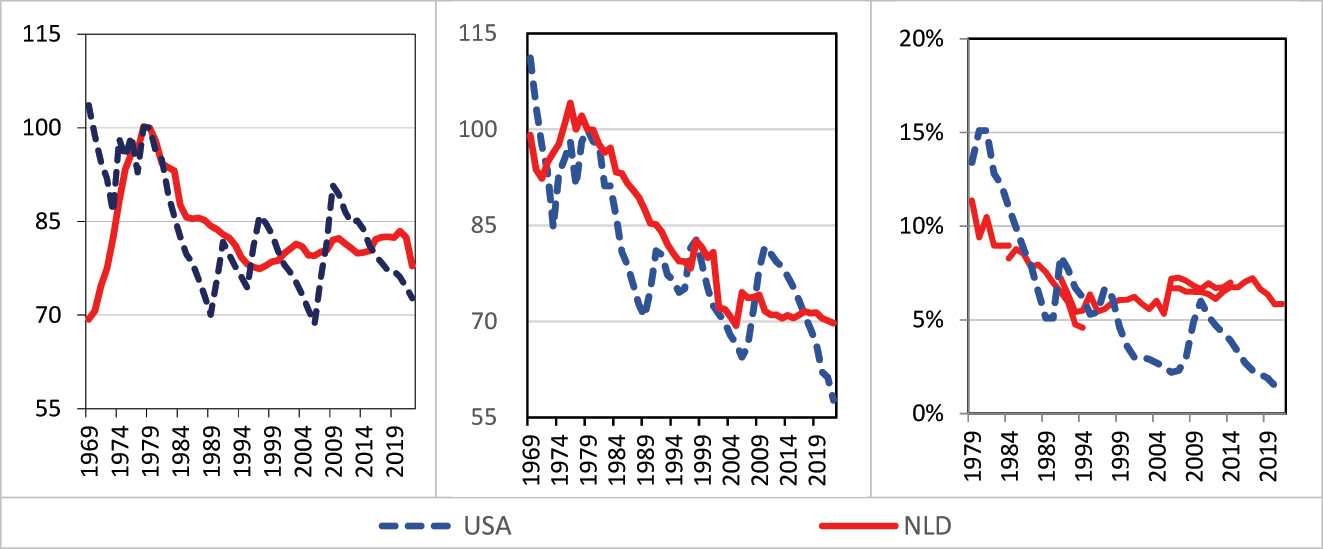
Minimum-wage levels (1979 = 100) and employment shares (%), Netherlands and United States, A and B: 1969–2022, C: 1979–2021. A: Real MW, 1979 = 100a. B: Relative MW, 1979 = 100b. C: MW employment share, %c. Notes: Dutch A-MW and US federal MW. aReal MW: deflated by CPI, brelative MW: Kaitz median-based index, cemployment share US among hourly paid workers and Netherlands as in Figure 4. Sources: see Appendix, OECD databases and BLS, characteristics of minimum-wage workers.
5.3 Researching Minimum-Wage Declines
These findings make it hard to understand that employment effects of minimum-wage declines have never been the explicit subject of economic analysis (except once for Greece – see below). Note that the high frequency of declines implies that they will be present in many time-series studies, but unfortunately stay under the radar which remains fixated on the effects of increases. It seems a mistake to focus minimum-wage analysis exclusively on increases and ignore the many decreases. These deserve examination in their own right and their analysis may also benefit the analysis of raises. Technically, such analysis may be more demanding, as declines usually do not figure as clear events or breaks and may be harder to disentangle from other, confounding trends in the economy. However, taking a longer-term perspective and using firm-level data can help as declines cumulate over time and influence employer expectations.
Methodologically, in time-series analyses, decreases are accounted for on the same basis as increases, generating a single measure of employment elasticity be it upward or downward. In other words, ‘the implicit assumption is that, controlling for the other explanatory variables, employment would be the same over time if the minimum wage were constant’ (Card and Krueger 1995, 183). It implies that any prima-facie difference between upward and downward effects needs to be attributed to and entirely accounted for by control variables.[45] If not, the elasticity for both will be misestimated. In addition, the ceteris paribus condition for estimating long-run elasticities of minimum-wage hikes as distinct from the short-run ones is not satisfied in the case of declines after the hike. ‘If minimum wage increases are sufficiently temporary … there would be little difference in the observed short- and long-run employment responses’ (Sorkin 2015, 317). In Sorkin’s view, firms’ expectations regarding the ‘temporariness’ of the hike matter for their long-run labour demand, depending on the dissimilar nature of their production.[46] This temporariness affects both time-series, cross section and panel studies. Neumark (2019, 317) deems this a ‘different perspective’ on the bite of the minimum wage, but it may be more fundamental than that given the high frequency of declines.
Theoretically, employment effects of a lowering may differ as much as those of an increase between the two main strands of minimum-wage research: the mainstream neoclassical one and the ‘new-economics’ monopsonistic one. In their textbook versions, the former is fully competitive with price-takers on both sides: firms and employees, while in the monopsonistic approach employees can be price-takers while firms are not if they enjoy some degree of labour-market power, or employees and firms can be mutually non-competitive to the extent that firms’ power depends also on workers’ heterogeneous non-wage job preferences regarding firms (Card 2022; Card et al. 2018; Manning 2021a). As the degree of power may vary across firms and puts their individual behaviour on the research agenda, heterogeneity is an essential corollary of monopsony. Following the neoclassical strand, minimum-wage employment will increase if the minimum wage is lowered[47] to a level closer to or at the equilibrium wage, while following the monopsonistic strand, minimum-wage employment and/or the wages of the employees will decrease depending on the level at which the minimum wage is situated before and after the lowering relative to monopsonists’ profit-maximising wages (cf. Elliott 1991, Figures 10.3 and 10.5).
Differently from these textbook versions, a firm will be legally obliged to pay an increased minimum wage but not a nominally decreased one, let alone a nominally unchanged one facing real or relative decline. Commonly, employers can hire at will but not necessarily fire because of institutional regulations. Upwards, the minimum wage is an obligation for the firm and provides an attraction for new and existing labour supply. Downwards, by contrast, employees at the initial minimum wage may retain their pay turning the minimum wage into a label attached to a shrinking part of a firm’s labour force and a disincentive to new labour supply. In the longer run, job mobility will substitute new hires paid the lower wage. This legal difference lends a degree of freedom to an employer who in his right mind would trade off maintaining the existing situation – freezing the previous minimum wage – at no more costs than before, against the uncertain net benefit of lower labour costs minus the deduction of the costs that would be incurred by the firing and hiring actions needed to bring the new situation about. Such a freeze can offer an attractive lowering of labour costs in a longer-run perspective of increasing productivity or passing through to prices (Aaronson 2001) without the need to adopt the lower minimum wage.
The least one can say is that a lowering potentially incites a more heterogeneous response than an increase. Georgiadis, Kaplanis, and Monastiriotis (2020) provide the one and only study of the employment effects of a lowering that I have been able to discover. With matched employer-employee data, they examine the effects of the extreme decrease of the Greek minimum wage in 2012, wrought by the Troïka during the Eurocrisis. The authors stress in their results the heterogeneity of firm responses ‘that are not entirely consistent with the competitive model of the labour market’ (p. 3). Naturally, we cannot infer more heterogeneity from this in lowering than in increasing the minimum wage, but the finding underlines the importance of paying attention to the firm side of the equation. Importantly, a significant decline in minimum-wage employment may go together with a shrinking and changing population of firms that actually pay the minimum wage. Remember the drastic shifts towards larger firms and part-time work between 1979 and 2021 found above for the Netherlands. Similarly, the relevant labour supply may get more restricted. The combination of both sides is important if the monopsony power of firms depends also on heterogenous preferences that people may entertain for non-wage employer characteristics.
All of this draws attention to the economics of the ‘bite’ of the minimum wage. Studies that find little or no employment effect seem to attribute this ex post to a relatively low level of the minimum wage, i.e. a weak ‘bite’, but without a firm criterion what that might be. The concept of a bite purely defined as ‘how high the minimum wage is relative to the wage distribution’ (Neumark 2017, 11) risks being tautological to the share of minimum-wage employment.[48] Instead, the concept should be given actual economic content, independent from the level of minimum-wage employment itself. That seems to be the point of Neumark when he further advocates a ‘more serious consideration of the economic factors to help explain long-standing differences in minimum-wage employment effects across studies’ (p. 300). Behind the bite lingers the question what part of the economy does the minimum wage affect and for what reasons? This applies as much to changing minimum wages as to unchanged ones. Different bites, but also similar bites, may have different effects because of differences in those reasons. For example, assuming a difference in and heterogeneity of behaviour of monopsonistic firms compared to competitive ones, either the contributions of those two categories of firms to the relevant segment of the labour market may change and give rise to a different bite or, alternatively, the monopsonistic behaviours and/or their heterogeneity may change, perhaps even at the same time, and affect the bite in a different way.
It suggests to systematically extend the question ‘Who is affected by the minimum wage?’ (Belman, Wolfson, and Nawakitphaitoon 2015), pertaining to workers receiving the minimum wage, also to the firms paying it. These authors extract the answers for a range of demographic characteristics and a few specific industries from the existing literature. Unfortunately, they pay no attention to changes over time. On the firm side, Cengiz et al. (2019) discuss the bite by industry and London Economics (2016) does by firm size, but both do not match with employee data while Wursten and Reich (2023) do by firm size. Matched employer-employee data will be essential (Manning 2021a, 16), but very little is available over a longer time span and their use is only just beginning. What has become available pays no attention to changes over time. Bachmann and Frings (2017), who study monopsony in great detail, contend that their conclusions based on the years 2000–2002 still hold in 2015, the time the German minimum wage was introduced. It is unfortunate that matched data do not stretch back to the 1980s for a study of the times that American and Dutch declines were steepest, to probe whether the growing role of larger enterprise implies an intensification of monopsony. Shorter stretches of matched data could enable studies of more recent years but variation may be insufficient.[49] However, pure individual matched data will need to be supplemented by the firms’ functioning in the relevant low-wage labour market, e.g. their contribution to labour market concentration (Azar et al. 2021). Also, a concentration of monopsonistic firms may actually affect the behaviour of competitive firms and blur the analytical distinction between the two.[50]
Obviously, such a study is beyond this contribution to undertake. All in all, minimum-wage analysis must not ignore such perfectly reasonable economic facts of declining minimum-wage costs, often gradual but also accumulating over time, and try to find a way to deal with declining minimum-wage levels and shares and scrutinise the implications of significantly differing levels of minimum-wage employment. Hopefully, the growing use of matched employer-employee data together with a focus on the combined changes over time in their populations and behaviours can give birth to minimum-wage analysis 2.0. That would suit David Card’s (2022, 1,086) plea to drop the axiom that ‘markets set wages’ and instead consider firms’ wage setting an integral part of labour economics.
6 Conclusions
First, I have depicted the evolution of the level of the Dutch minimum wage since its establishment in 1969–2021/22. After an initial strong rise, I find extraordinary declines (−22 %) in its purchasing power and its ratios to median and average wages up to the mid-1990s, followed by essentially stagnating purchasing power, that notably hovers nowadays at a level comparable to the level of the early 1970s, and further declining ratios to the median (−33 %) and the average (−37 %). The declines can be attributed to the statutory uprating procedure and to government interferences therein. The uprating follows an official statistical index of wage increases negotiated in collective labour agreements between unions and employers. The index is used in spite of its likely inaccuracy as in real terms the index currently hovers at the level of the early 1970s and lags far behind actual real earnings growth since then (+57 %), which implausibly makes 50 years of trade union activity entirely redundant. Government policies lowered the level of the minimum wage nominally in 1984, a time of high inflation, and frequently disallowed the uprating, mostly between 1983 and the mid-1990s but again in the 2000s. These policies prolonged the decline of the minimum wage more than a decade past that of negotiated wages. This evolution undermines the double statutory aim given to the minimum wage from the start and still attributed nowadays: ensuring both fair pay and fair income that enables people with bottom wages and/or bottom incomes to share in the growth of national prosperity.
Second, I have constructed a sequence of four wage statistics to examine the corresponding minimum-wage employment: its share in the volume of hours worked, measured against the adult minimum wage A-MW (and bands closely above). This measure counts young employees in because of their highly comparable economic position, solidly within the range of adult minimum pay, instead of ignoring this and legally counting only those paid precisely their age-specific statutory minimum wages. The exercise establishes five stylised facts:
Strong decline of the minimum-wage employment share, halving from 13 to 6 %;
Largely stable employment (around 15 %) below the real minimum wage of 1979, before the decline, with an unchanging internal density distribution;
Stable level and density distribution up to almost 20 % above this real 1979 level, meaning completely stagnated real earnings for the bottom quartile of the wage distribution;
Stable demographic composition by age and gender, going together with significant shifts towards part-time jobs and second earners;
Strong decline in the incidence of the minimum wage among small enterprise and a considerably rising concentration of minimum-wage employment among larger enterprise, with only a modest shift in the industrial composition, which largely reflects a rapid growth of temporary agency jobs.
Thus, instead of leading to a growth in minimum-wage employment, the decreasing level went hand in hand with an even steeper employment decline. Surprisingly, employers continued to hire as often as before at the same real wages and did not subscribe to the massive lowering of the minimum wage despite its long continuation. No proper analysis is available of this joint decline of level and employment.
Third, I have pointed out that it is a mistake to consider the lowering of the level a unique Dutch experience as I showed that one-third of about 1,000 annual minimum-wage level changes collected by the OECD involve real declines and no less than half concern relative declines. Such level declines are economically as relevant to employers as increases in the minimum wage but, unfortunately, are entirely unnoticed by the international minimum-wage literature, which exclusively focuses on increases of the minimum wage (except once for Greece in 2012). Importantly, the joint decline of level and employment in the Netherlands is wholly shared by the United States.
Arguably, the effects of a lowering may differ from an increase, especially with regard to the employer side of the equation. For its understanding, the focus on firm behaviour of the monopsonistic strand of minimum-wage analysis seems indispensable, possibly next to and in interaction with the competitive approach. The contraction of minimum-wage employment likely goes together with smaller, more selected populations of firms, which actually pay the minimum wage and also of workers who receive it. The question is, first, how far composition changes influence the (distribution of) heterogenous behaviours of individual firms, and, second, how far such changes affect the mutual interactions between those firms, e.g. as an increasing concentration of large monopsonistic firms (say, Walmart) would shape also the competitive behaviour of small firms. The same holds for shifting labour-supply behaviours, on their own as well as in interaction with firm behaviours. For answering those questions, the growing availability of matched employer-employee data will be a great help, but it needs to be embedded in a broader analysis of the relevant segment of employment and the labour market. It warrants further scrutiny of behaviours at different levels of the bite of the minimum wage and different behaviours at similar levels of the bite. May a ‘fifth generation’ of minimum-wage analysis, next to the four suggested by Dube (2011), come about: time-series analysis 2.0 that links bite and effects economically. Alas, I can only advocate this as it is beyond this contribution to provide this empirically.
To conclude, giving the ‘bite’ real content in terms of economic behaviour in the sense of David Neumark’s question in the epigraph, no longer econometrics but economics should to get into the driver’s seat and steer minimum-wage research towards a comprehensive integration of wage setting into labour economics – which is David Card’s hope, not by accident also in the epigraph.
Appendix: Data Used
No comprehensive and consistent set of data on the distribution of wages is available for the entire period. As second best, I have linked up a sequence of four different data sets, which differ by their wage concepts, coverage of employees and survey nature and timing (see Table A.1 for more detail and online appendix for raw data):
1972–84 weekly wages of full-time employees working the full week on a persons basis, and (roughly) excluding agriculture and up to 1979 also the public sector, measured in October, which explains the gap in 1979 between 14.7 % (excluding the public sector) and 12.7 % +(including) in Figure 3;
1984–2005 annual wages of full-time employees working the full month on a persons basis, measured in December;
1991–2014 hourly wages (including holiday allowance) of all employee jobs by bands of weekly working hours, measured in December;[51]
2006–2021 hourly wages (excluding holiday allowance) of all employees on full-time equivalent (FTE) basis, with a comprehensive monthly coverage of all employees, jobs and hours worked.[52]
Four data periods.
| 1972–84 | 1984–2005 | 1991–2014 | 2006–2021 | |
|---|---|---|---|---|
| Gathering of data | Survey | Survey | Survey | Administrative data |
| Time of observation | October | December | December | All months |
| Coverage of economy | Except agriculture. Private sector only to 1979; | Full NACE | Full NACE | Full NACE |
| Exclusion of WSWa | Yes | Yes until 1990 | ||
| Observation breaks | 1979 | 1995 | 1995, 1999, 2006 | |
| Presentation breaks | Relevant wage classes change in 1977, 1979 and 1980 | Relevant wage classes change in 1995 | ||
| Wage concept | Weekly Incl. overtime |
Annual incl. holiday allowance, bonuses | Hourly basic wage | Hourly basic wage |
| Width of relevant classes | 50 guilders (2.20371 in a euro) | 2,500 guilders to 1994, then 5,000 | 2.5 guilders to 2001, then single euros | Percentiles for hours worked, max. width € 0.92 for A-MW, € 0.25–0.24 for A-MW-79 and A-MW-79 + 20 % |
| Population | Full-time employees | Full-time employees | All employees | All employees |
| Full-time as % of FTE (PT = 1/2FT) | 95 % | 87 % | 75 %, but included with PT | Not applicable |
| Unit of observation | Persons | Persons | Jobs by 6 h bands: < 12. 20-20, 20–25, 25–30, 30–35, > 35 | Hours, less detail on jobs |
| Minimum Y-MW as % of A-MW | 35 % to June 1981, 32 % to June 1983, then 30 % - always at age 15 | 30 % | 30 % | 30 % |
| Maximum Y-MW as % of A-MW | 90 % to June ’81, 87.5 % to June ’83, then 85 % | 85 % | 85 % | 85 % to June 2019, then 80 % (now at age 21 instead of 23). |
| Holiday allowance % of wage | 6 % to 7 % (1975) to 7.5 % (1980) | 7.5 %–8 % (1988) | 8 % | 8 % |
-
aSheltered workplaces (about 35,000 full-time employees) at the time, most of them low paid.
Sets 1 to 3 are mainly derived here from the author’s paper archive of old publications as well as separate tabulations provided by Statistics Netherlands. I profited also from material archived by my colleague Paul de Beer. Compare also CBS (1999, 2019. Incidentally, for detail of S-MW, I use the special surveys (1974, 1976, 1979, 1981, 1983) conducted by CBS that targeted minimum-wage employment, but they present results differently and contain no information on the overall distribution of wages. After 1983, CBS derived the information on the minimum wage statistically from the general wage surveys.
Over time, the coverage of the economy, particularly of small low-paid employment, has much improved and nears perfection in the fourth series. Two notable coverage improvements occur for set 3 in 1995 and 2006. The four data sets stick relatively closely to the latest insight of Statistics Netherlands for hours worked (Figure A.1), because almost all jobs added were (small) part-time ones.
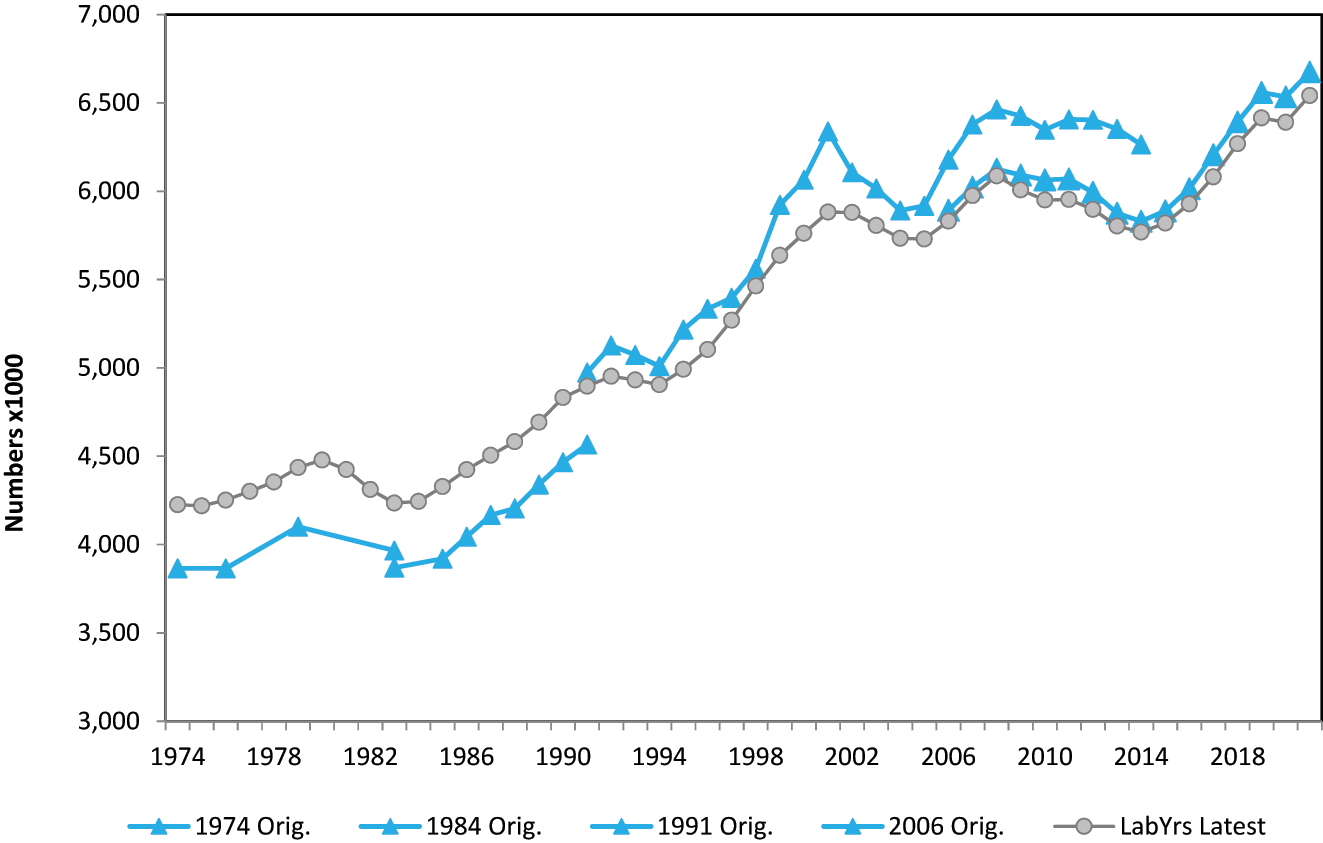
Employee labour years (x 1,000), fours datasets versus latest available data, 1974–2021. Source: CBS.
Note that since the reporting shifted to jobs in 1991, there has no longer been a statistic of persons earning the minimum wage but one of jobs and hours worked that are paid at the minimum wage (and may still be classified by the personal characteristics of the occupant).[53] The massive comprehensive reporting in force since 2006 may observe the same person more than once in case of more than one job either at the same time or during the year. This complicates characterising a person as a minimum-wage earner for the year. Plausibly, this phenomenon is more important at the lower end of the wage distribution, because of labour-market entries and exits, high contract flexibility and further careers upwards from low pay. However, it also means that, in contrast with the preceding surveys, the data now catch all small and brief jobs that contribute significantly to low pay.
As argued above for analytical reasons, I have taken hours worked as the unit of measurement as consistently as possible. Data sets 1 and 2 report on full-time working persons, who then still provide the overwhelming majority of all workers and working hours covered. For set 3, I have estimated FTEs based on six bands of weekly working hours, while set 4 reports all hours worked during the year. Relatively small differences revealed in the years that the series overlap with each other (Figure 3) suggest surprisingly limited uncertainty in the overall picture. Note that with sets 3 and 4, the reporting shifted to a basis of hours, necessitating a choice of weekly hours by which to divide the weekly minimum wage. I have chosen 36 h for consistency with the new hourly minimum wage enacted for 2024. Alternatively, 40 h could have been chosen. This would have reduced the share of A-MW employment by 1.3 pp on average for 1991–2021, generating an even stronger decline compared to earlier years in Figure 3.
Shares in employment up to the A-MW and related wage thresholds are estimated by linear interpolation in classes of wages. These classes vary in width or density between datasets and between years within datasets, and estimations may sometimes be less precise as a result. They are most precise for 2006–2019 when data are presented by percentiles. The linear interpolation disregards within the marginal class the presence of possible spikes, a well-known phenomenon in minimum-wage analysis. However, the focus on A-MW mitigates such spikes in comparison with the S-MW, which adds the legal age-related spikes together and disregards wages in between. Firstly, the uniform 36-h A-MW counts people in beyond S-MW spikes in jobs where applicable CLAs stipulate full-time hours between 40 and 36 per week. Secondly, A-MW counts young workers in beyond the spikes of their legal Y-MWs who earn more up to the A-MW (they massively work also in retail trade and restaurants and cafés).
References
Aaronson, Daniel. 2001. “Price Pass-Through and the Minimum Wage.” The Review of Economics and Statistics 83 (1): 158–69. https://doi.org/10.1086/508734.Search in Google Scholar
Allegretto, Sylvia, Arindrajit Dube, Michael Reich, and Ben Zipperer. 2017. “Credible Research Designs for Minimum Wage Studies: a Response to Neumark, Salas, and Wascher.” ILR Review 70 (3): 559–92. https://doi.org/10.1177/0019793917692788.Search in Google Scholar
Autor, David, Alan Manning, and Christopher Smith. 2016. “The Contribution of the Minimum Wage to US Wage Inequality over Three Decades: A Reassessment.” American Economic Journal: Applied Economics 8 (1): 58–99. https://doi.org/10.1257/app.20140073.Search in Google Scholar
Azar, José, Emiliano Huet-Vaughn, Ioana Marinescu, Bledi Taska, and Till von Wachter. 2021. Minimum Wage Employment Effects and Labor Market Concentration. NBER Working Paper 26101. Title (nber.org). Cambridge, MA: National Bureau of Economic Research.Search in Google Scholar
Bachmann, Ronald, and Hanna Frings. 2017. “Monopsonistic Competition, Low-Wage Labour Markets, and Minimum Wages – an Empirical Analysis.” Applied Economics 49 (51): 5268–86. https://doi.org/10.1080/00036846.2017.1302069.Search in Google Scholar
Been, Wike, Paul de Beer, and Wiemer Salverda. 2021. “Downward Convergence between Negotiated Wages and the Minimum Wage: The Case of the Netherlands.” In Minimum Wage Regimes. Statutory Regulation, Collective Bargaining and Adequate Levels, edited by Irene Dingeldey, Thorsten Schulten, and Damian Grimshaw, 137–61. London: Routledge.10.4324/9780429402234-9Search in Google Scholar
Beer, Paul de, Wike Been, and Wiemer Salverda. 2017. The Interplay between the Minimum Wage and Collective Bargaining in the Netherlands. An Overview and a Case Study of Three Sectors. AIAS Working Paper 173. AIAS (uva-aias.net). Amsterdam: University of Amsterdam.Search in Google Scholar
Belman, Dale, and Paul Wolfson. 2014. What Does the Minimum Wage Do? Kalamazoo: W.E. Upjohn Institute for Employment Research.10.17848/9780880994583Search in Google Scholar
Belman, Dale, Paul Wolfson, and Kritkorn Nawakitphaitoon. 2015. “Who Is Affected by the Minimum Wage?” Industrial Relations 54 (4): 582–621. https://doi.org/10.1111/irel.12107.Search in Google Scholar
Bezooijen, Emiel van, Wiljan van Berge, and Anna Salomons. 2021. The Young Bunch: Youth Minimum Wages and Labor Market Outcomes. Discussion paper 422. The Hague: CPB.Search in Google Scholar
Brown, Alessio, Christian Merkl, and Dennis Snower. 2014. “The Minimum Wage from a Two-Sided Perspective.” Economics Letters 124 (2014): 389–91. https://doi.org/10.1016/j.econlet.2014.06.020.Search in Google Scholar
Card, David. 2022. “Who Set Your Wage?” The American Economic Review 112 (4): 1075–90. https://doi.org/10.1257/aer.112.4.1075.Search in Google Scholar
Card, David, and Alan Krueger. 1994. “Minimum Wages and Employment: A Case Study of the Fast-Food Industry in New Jersey and Pennsylvania.” The American Economic Review 48 (4): 772–93. https://doi.org/10.1257/aer.90.5.1397.Search in Google Scholar
Card, David, and Alan Krueger. 1995. Myth and Measurement. The New Economics of the Minimum Wage. Princeton: University Press.Search in Google Scholar
Card, David, Ana Rute Cardoso, Joerg Heining, and Patrick Kline. 2018. “Firms and Labor Market Inequality: Evidence and Some Theory.” Journal of Labor Economics 36 (S1): S13–S70. https://doi.org/10.1086/694153.Search in Google Scholar
CBS (Han van den Berg). 1999. “Werknemers die het minimumloon verdienen 1969-1997.” Sociaal-economische Maandstatistiek, Vol. 1999/2, 18–36. The Hague: CBS.Search in Google Scholar
CBS. 2019. Vijftig jaar minimumloon. The Hague: Central Bureau of Statistics.Search in Google Scholar
CBS. 2021. Uurlonen Naar Percentiel 2006-2019. Uurlonen, 2006-2019 (cbs.nl). The Hague: Central Bureau of Statistics.Search in Google Scholar
CBS. 2023. Werknemers Naar Soort Cao en SBI Naar Achtergrondkenmerken, 2010–22. The Hague: Central Bureau of Statistics.Search in Google Scholar
Cengiz, Doruk, Arindrajit Dube, Attila Lindner, and Ben Zipperer. 2019. “The Effect of Minimum Wages on Low-Wage Jobs.” Quarterly Journal of Economics 134 (3): 1405–54. https://doi.org/10.1093/qje/qjz014.Search in Google Scholar
CPB. 2016. Kansrijk Arbeidsmarktbeleid Deel 2. Boek 22. The Hague: CPB.Search in Google Scholar
CPB. 2020a. Kansrijk Arbeidsmarktbeleid - Update Minimumloonbeleid. The Hague: CPB.Search in Google Scholar
CPB. 2020b. Effecten Verhogen Minimumloon, Notitie. The Hague: CPB.Search in Google Scholar
CPB. 2023. Technologie, de arbeidsmarkt en de rol van beleid. The Hague: CPB.Search in Google Scholar
Derenoncourt, Ellora, Clemens Noelke, David Weil, and Bledi Taska. 2022. Spillover Effects from Voluntary Employer Minimum Wages. NBER Working Paper 29425. w29425.pdf (nber.org). Cambridge, MA: National Bureau of Economic Research.10.3386/w29425Search in Google Scholar
Dickens, Richard. 2023. How are Minimum Wages Set? Bonn: IZA World of Labor.Search in Google Scholar
DiNardo, John, Nicole Fortin, and Thoams Lemieux. 1996. “Labor Market Institutions and the Distribution of Wages, 1973–1992: a Semiparametric Approach.” Econometrica 64 (5): 1001–44. https://doi.org/10.2307/2171954.Search in Google Scholar
Dolton, Peter, Chiara Rosazza Bondibene, and Jonathan Wadsworth. 2012. “Employment, Inequality and the UK National Minimum Wage over the Medium-Term.” Oxford Bulletin of Economics & Statistics 74 (1): 78–106. https://doi.org/10.1111/j.1468-0084.2011.00653.x.Search in Google Scholar
Doucouliagos, Hristos, and T. D. Stanley. 2009. “Publication Selection Bias in Minimum-Wage Research? A Meta-Regression Analysis.” British Journal of Industrial Relations 47 (2): 406–28. https://doi.org/10.1111/j.1467-8543.2009.00723.x.Search in Google Scholar
Dube, Arindrajit. 2011. “Review of Minimum Wages by David Neumark and William Wascher.” Journal of Economic Literature 49 (3): 762–6.Search in Google Scholar
Dube, Arindrajit. 2019. Impacts of Minimum Wages: Review of the International Evidence. London: HM Treasury, London. Impacts of minimum wages: review of the international evidence (publishing.service.gov.uk).Search in Google Scholar
Elliott, Robert. 1991. Labor Economics, A Comparative Text. New York: McGraw-Hill.Search in Google Scholar
Georgiadis, Andreas, Ioannis Kaplanis, and Vassilis Monastiriotis. 2020. “Minimum Wages and Firm Employment: Evidence from a Minimum Wage Reduction in Greece.” Economics Letters 193: 109255. https://doi.org/10.1016/j.econlet.2020.109255.Search in Google Scholar
Kabátek, Jan. 2021. “Happy Birthday, You’re Fired! Effects of an Age-dependent Minimum Wage on Youth Employment Flows in the Netherlands.” ILR Review 74 (4): 1008–35. https://doi.org/10.1177/0019793919897914.Search in Google Scholar
Kramarz, Francis, and Thomas Philippon. 2001. “The Impact of Differential Payroll Tax Subsidies on Minimum Wage Employment.” Journal of Public Economics 82 (1): 115–46. https://doi.org/10.1016/S0047-2727(00)00137-7.Search in Google Scholar
Lester, Richard. 1946. “Shortcomings of Marginal Analysis for Wage-Employment Problems.” American Economic Review 36 (1): 63–82.Search in Google Scholar
Lichter, Andreas, Andreas Peichl, and Sebastian Siegloch. 2014. The Own-Wage Elasticity of Labor Demand: A Meta-Regression Analysis. Working paper 7985. Bonn: IZA.10.2139/ssrn.2407944Search in Google Scholar
London Economics. 2016. An Examination of the Impact of the NMW on Earnings, the Bite and Wage Differentials. A report to the Low Pay Commission. London_Economics_Report_2016.pdf (publishing.service.gov.uk). London: LE London Economics.Search in Google Scholar
Machin, Stephen, Alan Manning, and Lupin Rahman. 2003. “Where the Minimum Wage Bites Hard: The Introduction of the UK National Minimum Wage to a Low Wage Sector.” Journal of the European Economic Association 1 (1): 154–80. https://doi.org/10.1162/154247603322256792.Search in Google Scholar
Manning, Alan. 2021a. “Monopsony in Labor Markets: A Review.” ILR Review 74 (1): 3–26. https://doi.org/10.1177/0019793920922499.Search in Google Scholar
Manning, Alan. 2021b. “The Elusive Employment Effect of the Minimum Wage.” The Journal of Economic Perspectives 35 (1): 3–26. https://doi.org/10.1257/jep.35.1.3.Search in Google Scholar
NELP (National Employment Law Project). 2012. Big Business, Corporate Profits, and the Minimum Wage. New York: Data Brief. National Employment Law Project (nelp.org).Search in Google Scholar
Neumark, David. 2017. The Employment Effects of Minimum Wages: Some Questions We Need to Answer. NBER Working Paper 23564. w23584.pdf (nber.org). Cambridge, MA: National Bureau of Economic Research.10.3386/w23584Search in Google Scholar
Neumark, David. 2018. Employment Effects of Minimum Wages. Bonn: IZA World of Labor. employment-effects-of-minimum-wages.pdf (iza.org).Search in Google Scholar
Neumark, David. 2019. “The Econometrics and Economics of the Employment Effects of Minimum Wages: Getting from Known Unknowns to Known Knowns.” German Economic Review 20 (3): 293–329. https://doi.org/10.1111/geer.12184.Search in Google Scholar
Neumark, David, and Peter Shirley. 2022. “Myth or Measurement: What Does the New Minimum Wage Research Say about Minimum Wages and Job Loss in the United States?” Industrial Relations 61: 384–417. https://doi.org/10.1111/irel.12306.Search in Google Scholar
Neumark, David, and William Wascher. 2006. Minimum Wage and Employment: A Review of Evidence from the New Minimum Wage Research. Working Paper 12663. Cambridge, MA: National Bureau of Economic Research.10.3386/w12663Search in Google Scholar
Parliamentary Note. 1990–1991. Kamerstuk 22012, nr 3: Memorie Van Toelichting, Wetsvoorstel WKA. The Hague: House of Representative.Search in Google Scholar
Salverda, Wiemer. 1992. Youth Unemployment. Dynamics of the Dutch Labour Market 1955-1988. Groningen: Wolters-Noordhoff.Search in Google Scholar
Salverda, Wiemer. 1998. “Vergroting van de onderkant van de arbeidsmarkt? Een overzicht en eerste beoordeling van beleidsmaatregelen [Enlarging the Lower End of the Labour Market? A Survey and First Evaluation of Policy Measures].” Tijdschrift voor Politieke Ekonomie 21 (1): 24–57.Search in Google Scholar
Salverda, Wiemer. 2008a. “Labor Market Institutions, Low-Wage Work, and Job Quality.” In Low-Wage Work in the Netherlands, edited by Wiemer Salverda, Maarten van Klaveren, and Marc van der Meer, 63–131. New York: Russell Sage. Low-Wage Work in the Netherlands | RSF (russellsage.org).Search in Google Scholar
Salverda, Wiemer. 2008b. “The Bite and Effects of Wage Bargaining in the Netherlands 1995–2005.” In Wages and Wage Bargaining in Europe; Developments Since the Mid-1990s, Maarten Keune and Béla Galgóczi, 225–54. Brussels: ETUI. For a reprint see https://aias.s3-eu-central-1.amazonaws.com/website/uploads/14582254539032014-01-Salverda.pdf.Search in Google Scholar
Salverda, Wiemer. 2010. “The Dutch Minimum Wage: Minimum Wage Fall Shifts Focus to Part-Time Jobs.” In The Minimum Wage Revisited in the Enlarged EU: Issues and Challenges, edited by Daniel Vaughan-Whitehead, 299–339. Cheltenham: Edward Elgar and International Labour Organisation.10.4337/9781781000571.00014Search in Google Scholar
Salverda, Wiemer. 2018a. “The Netherlands: Is the Polder Model behind the Curve with Regard to Growing Household Income Inequality?” In Reducing Inequalities in Europe. How Industrial Relations and Labour Policies Can Close the Gap, edited by Daniel Vaughan‐Whitehead, 368–423. Cheltenham: Edward Elgar and International Labour Organisation.10.4337/9781788116299.00014Search in Google Scholar
Salverda, Wiemer. 2018b. “Low Earnings and Their Drivers in Relation to In-Work Poverty.” In Handbook of Research on In-Work Poverty, edited by Henning Lohmann, and Ive Marx, 26–49. Cheltenham: Edward Elgar.10.4337/9781784715632.00008Search in Google Scholar
Salverda, Wiemer. 2023. “Welvaartswinst van de afgelopen halve eeuw is volledig voorbijgegaan aan het sociale minimum [Growing prosperity of half a century is missed by minimum incomes].” Economisch Statistische Berichten 108 (4825): 414–6.Search in Google Scholar
Salverda, Wiemer. 2024. “Terwijl CAO-dekking daalt, nemen loonongelijkheid en bestaansonzekerheid toe. [While collective bargaining coverage decreases inequality and social insecurity increase].” Economisch Statistische Berichten 109 (4833): 222–5.Search in Google Scholar
Salverda, Wiemer, and Daniele Checchi. 2015. “Labour-Market Institutions and the Dispersion of Wage Earnings.” In Handbook of Income Distribution, Vol. 2B, edited by A. B. Atkinson, and F. Bourguignon, 1535–727. Amsterdam: Elsevier/North Holland. (also Labour-Market Institutions and the Dispersion of Wage Earnings (iza.org)). https://doi.org/10.1016/b978-0-444-59429-7.00019-4.Search in Google Scholar
Salverda, Wiemer, and Veerle Rook. 2023. The Vicious Entanglement of Labour-Market and Income Inequalities in Europe. 656bf05c-5df7-481b-8aaa-259b1038e72c.pdf (uantwerpen.be). Antwerp: Centrum voor Sociaal Beleid Herman Deleeck (CSB), University of Antwerp.Search in Google Scholar
Salverda, Wiemer, and Stefan Thewissen. 2018. “How Has the Middle Fared in the Netherlands? A Tale of Stagnation and Population Shifts.” In Inequality and Inclusive Growth in Rich Countries: Shared Challenges and Contrasting Fortunes, edited by Brian Nolan, 221–49. Oxford: Oxford University Press.10.1093/oso/9780198807032.003.0009Search in Google Scholar
Schmitt, John. 2015. “Explaining the Small Employment Effects of the Minimum Wage in the United States.” Industrial Relations 54 (4): 547–81. https://doi.org/10.1111/irel.12106.Search in Google Scholar
SER (Social and Economic Council). 1990. Advice on Special Increase of the Minimum Wage. The Hague: Social and Economic Council.Search in Google Scholar
Sorkin, Isaac. 2015. “Are There Long-Run Effects of the Minimum Wage?” Review of Economic Dynamics 18: 306–33. https://doi.org/10.1016/j.red.2014.05.003.Search in Google Scholar
SZW (Ministry of Social Affairs and Employment) (various years). CAO-Afspraken. The Hague Social and Economic Council.Search in Google Scholar
Werff, Siemen van der, Jelle Zwetsloot, and Bas ter Weel. 2018. Verkenning Effecten Aanpassing Minimum(jeugd)loon. Amsterdam: SEO. 2018-84_Effecten_verhoging_minimumjeugdloon.pdf (seo.nl).Search in Google Scholar
Wolfson, Paul, and Dale Belman. 2019. “15 Years of Research on US Employment and the Minimum Wage.” Labour 33 (4): 488–506. https://doi.org/10.1111/labr.12162.Search in Google Scholar
Wursten, Jesse, and Michael Reich. 2023. Small Businesses and the Minimum Wage. Working Paper 102-23. Small-Businesses-and-the-Minimum-Wage-3-14-23.pdf (berkeley.edu). Berkeley: IRLE Berkeley.Search in Google Scholar
Zwetsloot, Jelle, Tobias Vervliet, Siemen van der Werff, and Bas ter Weel. 2020. Verkenning Effecten Tweede Verhoging Van Wettelijk Minimum(jeugd)loon Per 1 Juli 2019. Amsterdam: SEO Economisch Onderzoek. 2020-80-Verkenning-effecten-tweede-verhoging-van-wettelijk-minimumloon-per-1-juli-2019.pdf (seo.nl).Search in Google Scholar
© 2024 the author(s), published by De Gruyter, Berlin/Boston
This work is licensed under the Creative Commons Attribution 4.0 International License.
Articles in the same Issue
- Frontmatter
- Editorial
- Editorial: Minimum Wages – Experiences of European Countries
- Special Issue Articles
- What Explains Differences in Minimum Wage Growth Between EU Member States?
- The Netherlands’ Minimum Wage 1969–2022: Can We Learn from Decline?
- The Minimum Wage in Greece: A Review of Institutional Features, Developments and Effects Between 1975 and 2023
- The Minimum Wage in Germany: Institutional Setting and a Systematic Review of Key Findings
- Effects of the German Minimum Wage on Wages and Household Income
- Effects of the German Minimum Wage on Earnings and Working Time Using Establishment Data
- Data Observer
- CILS4NEPS – Unlocking Research Potential Through More Participants, More Schools and International Comparison: Harmonized Data for Research on Education, School-to-work Transition and Integration Processes for Adolescents in Germany, the Netherlands, Sweden and England
- FamData: Database for Family Business Companies in Germany Covering Company Key Figures and Survey Data