The German Local Population Database (GPOP), 1871 to 2019
-
Felix Roesel


Abstract
I present the first database of historical local population figures for all Germany. The German Local Population Database (GPOP) includes total population in 1871, 1910, 1939, 1946, 1961, 1987, 1996, 2011, and 2019 for the universe of all German municipalities, counties, and states at consistent contemporary boundaries (31 December 2019). The database was hand-collected and assembled from more than 50 sources. The data reflect 150 years of regional development and disparities in Germany. For example, East and West Germany are heavily diverging in population since 1945; and the divide was not reversed but even doubled after reunification.
1 Introduction
Regional inequalities are among the most salient issues in public and academic debates, but many important questions are still unsettled. When do rich and poor regions converge and when do they drift apart? Why do some regions suffer from structural change while others flourish at the same time? And what are the most effective place-based policies to promote local economic development and reduce disparities? Answering such questions requires proper local-level data that span decades, or better, centuries as structural change sometimes takes ages. Local population is a perfect candidate. Booming regions attract mobile young workers in fertile cohorts; immigration and higher birth rates let local population grow. By contrast, people emigrate when regions are on an economic downward trend, often leaving the elderly behind. In such places, emigration and deaths exceed immigration and births; population decreases. Thus, at least in the medium and long term, population dynamics well reflect economic performance.[1]
Population is available in long time series as it was one of the first subjects of modern national statistics. Collections of local population numbers from historical censuses are standard in many countries. For example, statistical authorities published compilations of local population data for Austria (Wohnbevölkerung nach Gemeinden mit der Bevölkerungsentwicklung seit 1869), Czech Republic (Historický lexikon obcí České republiky – 1869–2011), or Switzerland (Bevölkerungsentwicklung der Gemeinden 1850–2000). For Germany, however, there is no such dataset yet for several reasons. First, statistical authorities were and are highly fragmented across German states. Census publications differ in intervals and details, until the present day. In the state of Rheinland-Pfalz, statistical authorities provide local population data covering two centuries (starting in 1815) while in Mecklenburg-Vorpommern no local population data is available for any year before 1982. Second, the number and boundaries of German municipalities, counties, and states varies very much over time. There have been tens of thousands of local boundary changes at all levels of government over the last centuries. To avoid time-consuming jigsaw puzzles, researchers developed work-arounds, focused on regions for which population data was available, or simply ignored boundary changes.[2]
The German Local Population Database (GPOP) fills this data gap. I collected historical local population data for the universe of Germany’s municipalities, digitized a large number of hard-cover copies, and transformed all data to consistent local boundaries as of 31 December 2019. Version 1.0 of the database contains several census years covering 150 years of German history: 1871, 1910, 1939, 1946, 1961, 1987, 1996, 2011, and 2019.[3] In this paper, I describe the preparation, the contents, the documentation, and the access to the dataset. I also show that the data have great potential to address yet unanswered research questions in many fields of regional science, such as economic geography, regional and urban economics, public economics, and economic history.
2 Preparation
2.1 Collection
The GPOP database was compiled from 52 sources. The Appendix contains a full list (see A1). Data were collected state by state. I complemented administrative information with original census material and municipality directories to piece together consistent population data. I contacted all 16 statistical offices of the German states to inquire historical population data at the local level. Five states provided me with (almost) full series of historical population data at the local level, beginning in the 19th century (Bayern, Baden-Württemberg, Brandenburg, Niedersachsen, Rheinland-Pfalz). In other states, official time series start in the 1950s (Hessen), 1960s (Sachsen-Anhalt), or 1970s (Nordrhein-Westfalen). Some collections of historical population were available as hard-cover copies, but not yet digitized; this includes Hessen, Nordrhein-Westfalen, Saarland, Sachsen, and Schleswig-Holstein. The three city states of Bremen, Hamburg, and Berlin provided some historical population data which however did not fully coincide with present-day local boundaries; I added later incorporated towns and villages (for example, Altona, Wandsbek and further municipalities were attached to Hamburg in 1937). For large parts of East Germany, no official historical population data before the 1980s were available from statistical authorities. In those and all other remaining cases of missing administrative data, I used original hard-cover copies of census publications and municipality directories.
2.2 Procedure
The data mining procedure of the GPOP database started in July 2019 and was finished in June 2022. I started with collecting all relevant data sources from statistical offices, libraries, and digitized publications as described above. In a second step, a team of student assistants and myself digitized hard-cover copies and transformed all original data to Excel sheets. Third, all historical villages and municipalities were transformed to contemporary local boundaries as of 31 December 2019 (see Table 1). I used different sources like village encyclopaedia, GIS files, and historical maps for the transition. Specific obstacles were renamings of cities, abandoned villages, or newly created settlements. Finally, data of all states were aggregated into a single database files.
Administrative units of Germany (31 December 2019).
| State | States | Counties | Municipalities | |||
|---|---|---|---|---|---|---|
| Municipalities | Unincorporated areas | Total | ||||
| (1) | (2) | (3) | (4) | (5) | ||
| West Germany | ||||||
| 1 | Schleswig-Holstein | 1 | 15 | 1106 | 2 | 1108 |
| 2 | Hamburg | 1 | 1 | 1 | 0 | 1 |
| 3 | Niedersachsen | 1 | 45 | 943 | 25 | 968 |
| 4 | Bremen | 1 | 2 | 2 | 0 | 2 |
| 5 | Nordrhein-Westfalen | 1 | 53 | 396 | 0 | 396 |
| 6 | Hessen | 1 | 26 | 423 | 4 | 427 |
| 7 | Rheinland-Pfalz | 1 | 36 | 2302 | 0 | 2302 |
| 8 | Baden-Württemberg | 1 | 44 | 1101 | 2 | 1103 |
| 9 | Bayern | 1 | 96 | 2056 | 177 | 2233 |
| 10 | Saarland | 1 | 6 | 52 | 0 | 52 |
| Berlin | ||||||
| 11 | Berlin | 1 | 1 | 1 | 0 | 1 |
| East Germany | ||||||
| 12 | Brandenburg | 1 | 18 | 417 | 0 | 417 |
| 13 | Mecklenburg-Vorpommern | 1 | 8 | 726 | 0 | 726 |
| 14 | Sachsen | 1 | 13 | 419 | 0 | 419 |
| 15 | Sachsen-Anhalt | 1 | 14 | 218 | 0 | 218 |
| 16 | Thüringen | 1 | 23 | 634 | 0 | 634 |
| Germany | 16 | 401 | 10,797 | 210 | 11,007 | |
-
The table reports the number of administrative units in Germany as of 31 December 2019. German names are used. Numbers correspond with the official administrative municipality directory (Statistisches Bundesamt 2020); three unpopulated areas were excluded (Saarland, Rheinland-Pfalz: Gemeinschaftliches deutsch-luxemburgisches Hoheitsgebiet, Mecklenburg-Vorpommern: Küstengewässer einschl. Anteil am Festlandsockel). Unincorporated areas (gemeindefreie Gebiete) are usually unpopulated woods (with two exceptions in the state of Niedersachsen).
The majority of German municipalities were involved in one, two or more mergers with neighboring municipalities over the period 1871 to 2019. I fully account for all mergers by allocating every data point to local administration boundaries as of 31 December 2019. This gives exact matches. Splits of municipalities, by contrast, are rather uncommon in Germany. To be consistent with the procedure of exact matches (also used by many statistical offices), I never split historical population data but allocate the full unit to the main absorbing municipality. Only in a handful of exceptional cases, where some parts of cities are not located in Germany anymore (example, the cities of Forst (Lausitz), Görlitz and Frankfurt (Oder) were split among Germany and Poland after World War Two), I estimate population on German territory today based on historical reports and data.
Finally, historical population data were merged with information on area, latitude, longitude, the administrative status, and urban classification as of 31 December 2019 (Statistisches Bundesamt 2020). I also created state and county aggregates, summing up all municipality-level data. The data were given a final inspection in June 2022, this includes checking zeros and missings and plausibility tests. Version 1.0 of the GPOP database was published in July 2022.
3 Contents
The GPOP database includes historical population figures for all administrative units of Germany. The data are stored in separate files for municipalities (Gemeinden, n = 11,007), counties (Landkreise, n = 401), and states (Länder, n = 16). All data are consistent with local boundaries as of 31 December 2019 (see Table 1).
Table 2 reports the variables included in the GPOP database. Background data such as area, coordinates, or urban classification are from Statistisches Bundesamt (2020). Historical local population is self-compiled and available for all states for the years 1871, 1939, 1996, 2011, and 2019. Available years for 1900/1905/1910 and during Germany’s separation (1946/1950, 1961/1964, 1985/1987) vary due to unsynchronized publications and different census dates in East and West. Column (2) in Table 2 describes the data availability for all states; Table 1 translates the state keys. Population growth rates should be carefully calculated, taking the different census years into account.
Variables (GPOP Version 1.0).
| Variable | Content | Available | Available |
|---|---|---|---|
| Statesa | Leveld | ||
| (1) | (2) | (3) | |
| Background | |||
| name | Name | 1–16 | M, C, S |
| id | Official Key (AGS) | 1–16 | M, C, S |
| county_id | County Key | 1–16 | M, C |
| state_id | State Key | 1–16 | M, C, S |
| area | Area (square kilometers) | 1–16 | M, C, S |
| lat | Latitude | 1–16 | M |
| lon | Longitude | 1–16 | M |
| degurba | Degree of urbanisation (DEGURBA 2011) | 1–16 | M |
| urban | City with county status (kreisfreie Stadt) | 1–16 | M, C |
| unincorporated | Unincorporated area (gemeindefreies Gebiet) | 1–16 | M |
| Population | |||
| pop_1871 | Population (01 Dec 1871) | 1–16 | M, C, S |
| pop_1900 | Population (01 Dec 1900) | 9 | M, C, S |
| pop_1905 | Population (01 Dec 1905) | 1, 3, 5, 7, 10 | M, C, S |
| pop_1910 | Population (01 Dec 1910) | 2, 4, 6, 8, 9, 11–16 | M, C, S |
| pop_1939 | Population (17 May 1939) | 1–16b | M, C, S |
| pop_1946 | Population (29 Oct 1946) | 1–6, 10–16 | M, C, S |
| pop_1950 | Population (31 Aug 1950) | 7, 8, 9 | M, C, S |
| pop_1961 | Population (06 Jun 1961) | 1–10c | M, C, S |
| pop_1964 | Population (31 Dec 1964) | 11–16 | M, C, S |
| pop_1985 | Population (31 Dec 1985) | 11–16 | M, C, S |
| pop_1987 | Population (25 May 1987) | 1–10c | M, C, S |
| pop_1996 | Population (31 Dec 1996) | 1–16 | M, C, S |
| pop_2011 | Population (09 May 2011) | 1–16 | M, C, S |
| pop_2019 | Population (31 Dec 2019) | 1–16 | M, C, S |
-
The table shows the variables included in the GPOP database (Version 1.0). All data are wide/unstacked. aYears may vary due to data availability and different census years in East and West Germany. For a translating list of states and state keys, see Table 1. bMunicipalities were merged on a large scale during the Nazi era in parts of the present-day county of Vorpommern-Greifswald (state of Mecklenburg-Vorpommern). Mergers were reversed after World War Two. cThe municipality of Amt Neuhaus (state of Niedersachsen) was part of East Germany between 1945 and 1993. Data are for 1964 and 1985. dSome background information are only available in the data files for municipalities (M), not for counties (C), or states (S).
The identifier variable is id. It refers to the 8-digit official municipality key (AGS, Amtlicher Gemeindeschlüssel): states represent the leading two digits, counties the following three digits, and municipalities the trailing three digits.[4] The identifier allows to link the data to geodata or other information. A valuable and often requested source are corresponding geographic data (shapefiles) of municipality, county, and state boundaries as of 31 December 2019, provided by the Federal Agency for Cartography and Geodesy.[5] The GPOP database can be perfectly connected to the administrative shapefiles via the identifier variable id.
I would like to mention some special cases worth to notice. First, municipalities were merged on a large scale during the Nazi era in parts of the present-day county of Vorpommern-Greifswald (state of Mecklenburg-Vorpommern). Data in the 1939 census were collected at this aggregated level. Many mergers were reversed after World War Two, but no disaggregated population data of 1939 is available. This results in several missing observations and population spikes in 1939 in the county of Vorpommern-Greifswald. There are more cases of reversed mergers, but this is the most prominent and region-wide case. I recommend to drop municipalities from this county from analysis, or to use data at the county or state level; aggregates almost entirely absorb missing data issues. Second, the municipality of Amt Neuhaus (nowadays state of Niedersachsen) was part of East Germany between 1945 and 1993. Data for this municipality are for 1964 and 1985, but were filed as 1961 and 1987 to be consistent with the remainder state of Niedersachsen.
4 Access
The GPOP database is publicly available without any access restrictions. Version 1.0 of the database can be accessed via the Institutional Repository (Publikationsserver) of Technische Universität Braunschweig. The Digital Object Identifier (DOI) is 10.24355/dbbs.084-202207181844-0.[6]
The dataset can be downloaded as a Zip folder (gpop_v1.zip) which contains a Readme file (readme.txt), this article (roesel_2022.pdf), a citation suggestion (how_to_cite.txt), and the data. The database is stored in a subfolder data and consist of separate files for the municipality level (muni), the county level (county), and the state level (state). The data are provided in three different data formats: delimited text files (csv), XML spreadsheets (xlsx), and Stata files (dta).[7] Imports from csv files should be encoded with UTF-8.
Any use of the database is free but requires citing this article. Questions, comments, and suggestions about the GPOP dataset should be directed to the author of this article. The mail address to be contacted is: f.roesel@tu-braunschweig.de.
5 Research Questions
The new GPOP database allows to study an array of new research questions related to local economic development in general and related to Germany in particular. Among others, three strands of the literature are prime candidates.
First, there is a growing debate about the dimensions and dynamics of regional disparities in Germany (for example, Ragnitz 2019). The new dataset allows to study urbanization trends (Rösel and Weishaupt 2020), the East-West divide (Rösel 2022), and the rise and fall of regions as a result of structural change. Figure 1a shows that total population living within the borders of present-day Germany grew steadily from 30 million in 1871 to more than 80 million today. Total population however hides a big and ever-growing divide between East and West Germany. Before separation, both parts of the country had very similar levels and growth paths in population density, Figure 1b. Since 1945, however, East and West are heavily drifting apart. Reunification did not reverse but doubled the gap in population density. This deserves much more research attention.
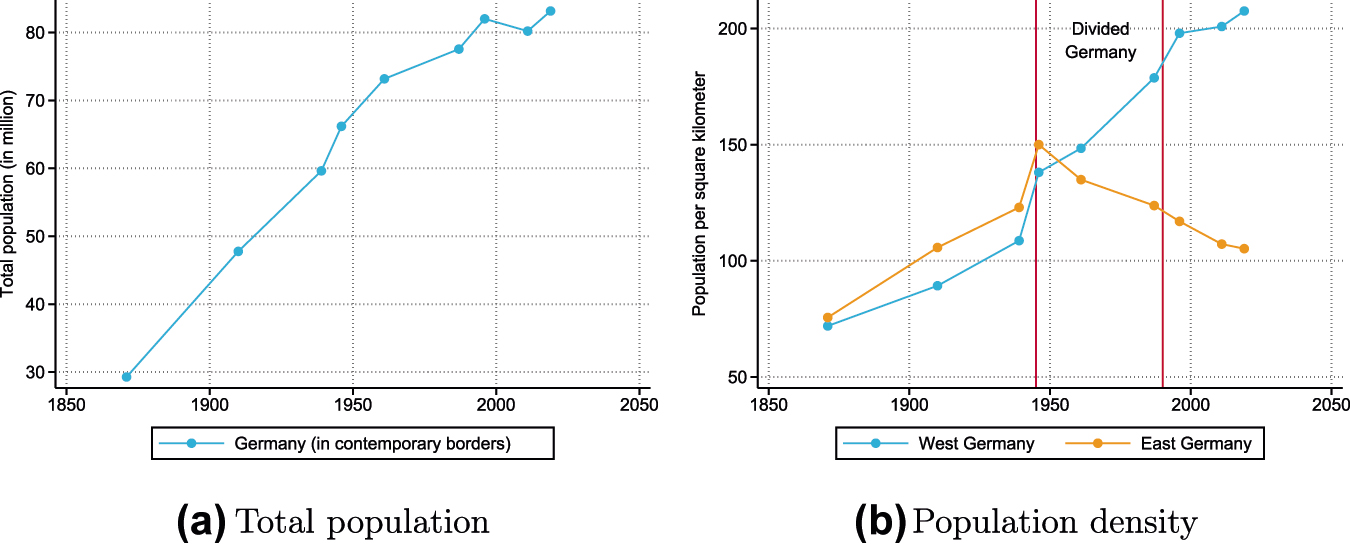
Population trends in Germany. The figures show population trends in Germany between 1871 and 2019. (a) Shows total population in Germany in contemporary boundaries as of 31 December 2019. (b) Compares average population density (population per square kilometer) in West German and East German municipalities. Vertical lines frame the time of Germany’s separation. Data: GPOP Version 1.0.
When considering very local dynamics, Figure 2a illustrates that Germany’s main period of industrialization came along with massive agglomeration growth in the Ruhr area, Berlin, or Frankfurt am Main between 1871 and 1939. Rural areas in the Northern parts of Bayern and Baden-Württemberg and in North Germany declined, despite a large increase of Germany’s total population of more than 60%. After World War Two, trends changed, see Figure 2b. In the West, suburban areas surrounding the cities grow most. Population increased all over West Germany, with few exceptions in Rheinland-Pfalz in the South West, along the Western coast of Schleswig-Holstein, and regions in proximity to the Iron Curtain. By contrast, at the time around reunification, many East German regions recorded population numbers close to or below 1939 levels. After 1990, the divide even deepened. East Germany lost another net population of almost 3 million. Only the suburbs of Berlin and other large cities were growing, see Figure 2c. Remote regions and former industrial strongholds in the West are declining as well. Future research may address the dynamics of local economic growth within Germany in a more systematic and comparative way.

Local population growth in Germany. The maps show annualized population growth rates in German municipalities between (a) 1871 and 1939, (b) 1939 and 1987, and (c) 1987 and 2019. Black boundaries represent counties, the bold black line the 1945–1990 Inner German border. White shaded areas: No data (either unpopulated areas or no data available). Data: GPOP Version 1.0.
Second, place-based policies such as subsidies (Ehrlich and Seidel 2018), government jobs (Becker et al. 2021), or school closures (Freier et al. 2021) have been shown to influence local development in Germany. Future research may use the GPOP data to focus on the long-run economic effects of other types of institutions and public infrastructure, for example, the local capital city status (Bluhm et al. 2021; Rösel 2021), railway stations, airports, roads, universities, or leisure amenities.
Third, the GPOP database allows to renew our understanding of the separation of Germany as a natural experiment. Earlier studies considered the Inner German border quasi-experimental (for example, Buettner and Rincke 2007; Redding and Sturm 2008), but new research has cast some doubt on the exogeneity of Germany’s zoning after 1945 (Becker et al. 2020). Figure 3a shows that neighboring regions of what later became East and West Germany grew in a very similar fashion until 1939. No statistically significant discontinuity can be observed in local population growth. During separation, population in West German municipalities close to the border grew 0.735 percent faster per year than neighboring municipalities in the East,[8] see Figure 3b. There was no border gradient in regional growth in Socialist East Germany, but in the West. Remarkably, the gap in population growth did not reverse after 1990, but continued. Even at the very local level of directly neighboring communities, East and West drift further apart in terms of population. West German municipalities at the abolished border still grew faster after 1990 (0.401 percent per year).[9] The continuity in the divide could be driven by demographic echo effects. The total effect of the border accumulates to a 50 percent growth gap in population of neighboring East and West German communities between 1939 and 2019. The puzzling lack of convergence and even accelerated divergence in East-West German border regions should be a focus in future research projects.
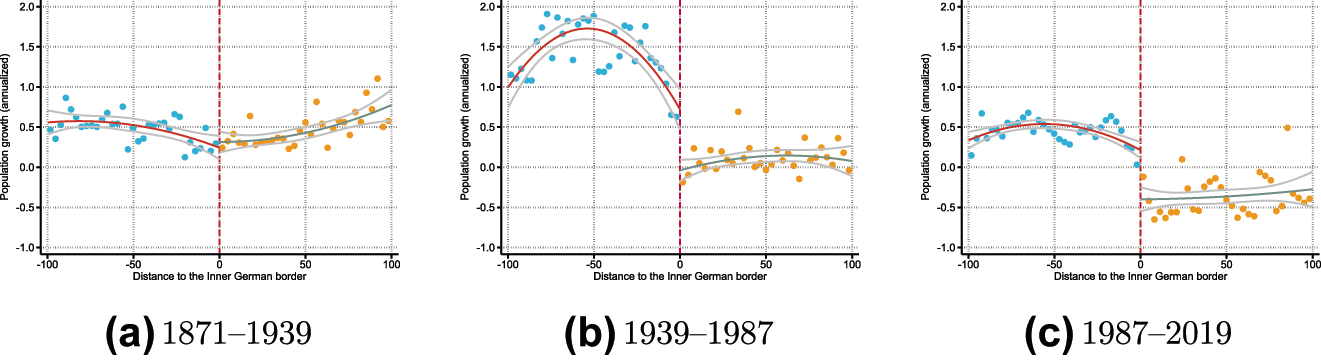
Population growth at the Inner German border. The figure plots annualized population growth rates in German municipalities between (a) 1871 and 1939, (b) 1939 and 1987, and (c) 1987 and 2019 against their distance to the 1945–1990 Inner German border (maximum distance: 100 km). Negative values refer to West Germany, positive values to East Germany. The corresponding local-linear regression discontinuity estimates (Calonico et al. 2017) are (a) 0.0468 (p = 0.621), (b) −0.735 (p = 0.000), and (c) −0.401 (p = 0.000). Data: GPOP Version 1.0.
6 Conclusion
Historical population figures are among the most powerful and rich parameters describing long-run development. I compiled and introduced new time series of population numbers for the universe of Germany’s 11,007 municipalities, 401 counties, and 16 states as of 31 December 2019. The first version of the German Local Population Database (GPOP) covers several census years between 1871 and 2019. The data are publicly available via an online repository.
The GPOP database accounts for thousands of changes of local boundaries within Germany. The panel structure of the data allows to study a broad range of yet unaddressed research questions related to the dimension, drivers, and consequences of regional disparities. Interesting avenues may include, for example, spatial inequalities such as urbanization trends or the urban-rural divide, the long-run effects of public infrastructure and place-based policies, or all the local consequences related to Germany’s separation and reunification.
There are still some limitations and caveats with this new dataset. First, future updates of the database will provide more synchronized time periods. For example, I aim at covering all Germany for the years 1910 and 1946 and including the 2021/2022 census results in an update. Second, head counts should be complemented with more disaggregated information, for example on gender and age, to study local demographic dynamics. Many publications from the 19th century lack such information but it might be available for other years. Third, regional disparities do also include more facets of living standards such as income, health, housing, or amenities. Total population reflects the long-run mix of all those aspects and could be complemented with more local-level indicators in future work.
Appendix A1 Sources
The GPOP database (Version 1.0) was compiled from the following 52 sources:
Amt für Statistik Berlin-Brandenburg (2019): Statistisches Jahrbuch. 2019. Berlin, Berlin: Berliner Wissenschafts-Verlag.
Ausschuss der deutschen Statistiker fÜr die Volks- und BerufszÄhlung 1946 (1950): Deutsches Gemeindeverzeichnis, Berlin: Duncker & Humblot.
Bayerisches Landesamt für Statistik (2019): Volkszählung und Bevölkerungsfortschreibung: Gemeinden, Bevölkerung (Volkszählungen und aktuell), Stichtag, Bayerisches Landesamt für Statistik: Munich.
Blaschke, Karlheinz (Ed.) (2006): Das Historische Ortsverzeichnis von Sachsen, Leipzig: Leipziger Universitätsverlag; Online version: Link: https://hov.isgv.de, Access: 11.04.2020.
Grossherzogliches statistisches Bureau zu Schwerin (1873): Beiträge zur Statistik Mecklenburgs, Siebenter Band, Erstes und zweites Heft, Schwerin: Hofbuchdruckerei von Dr. F. Bärensprung.
Grossherzogthum Mecklenburg-Strelitz (1874): Ortschafts-Verzeichnißdes Großherzogthums Mecklenburg-Strelitz auf Grund der Volkszählung vom 1. December 1871, Neu-Strelitz: Großherzogthum Mecklenburg-Strelitz.
Grossherzogtum Mecklenburg-Strelitz (1871): Ortschafts-Verzeichnißdes Großherzogtums Mecklenburg-Strelitz auf Grund der Volkszählung vom 1. Dezember 1871, Neustrelitz: H. Hellwig.
Herzoglich Anhaltisches Statistisches Bureau (1872): Die Ergebnisse der Volkszählung im Herzogthum Anhalt vom 1. December 1871, Mittheilungen des Herzoglich Anhaltischen Statistischen Bureaus, Nr. 14, 91–106, Dessau: Hofbuchdruckerei von H. Henbruch.
Hessisches Statistisches Landesamt (1968): Historisches Gemeindeverzeichnis für Hessen. Heft 1: Bevölkerung der Gemeinden 1834 bis 1967, Hessisches Statistisches Landesamt: Wiesbaden.
Hessisches Statistisches Landesamt (2019): Volkszählungsergebnisse (Gebietsstand 1981), provided upon request, 11.06.2019, Hessisches Statistisches Landesamt: Wiesbaden.
IT.NRW (2019): Bevölkerung am Ort der Hauptwohnung nach Geschlecht – Gemeinden – Stichtag: 25.05.1987, Düsseldorf: IT.NRW.
Karbach, Jürgen (1987): Bevölkerungszahlen des Saarlandes 1800–1910, Zeitschrift für die Geschichte der Saargegend, Vol. 34/35, 186–275.
Königliches Statistisches Bureau (1873): Die Gemeinden und Gutsbezirke des Preußischen Staates und ihre Bevölkerung. Nach den Urmaterialien der allgemeinen Volkszählung vom 1. December 1871. Bearbeitet und zusammengestellt vom Königlichen Statistischen Bureau. VIII. Provinz Hannover, Berlin: Verlag des Königlichen Statistischen Bureaus (Dr. Engel).
Königliches Statistisches Bureau (1873): Die Gemeinden und Gutsbezirke des Preußischen Staates und ihre Bevölkerung. Nach den Urmaterialien der allgemeinen Volkszählung vom 1. December 1871. Bearbeitet und zusammengestellt vom Königlichen Statistischen Bureau. II. Provinz Brandenburg, Berlin: Verlag des Königlichen Statistischen Bureaus (Dr. Engel).
Königliches Statistisches Bureau (1873): Die Gemeinden und Gutsbezirke des Preußischen Staates und ihre Bevölkerung. Nach den Urmaterialien der allgemeinen Volkszählung vom 1. December 1871. Bearbeitet und zusammengestellt vom Königlichen Statistischen Bureau. VI. Provinz Sachsen, Berlin: Verlag des Königlichen Statistischen Bureaus (Dr. Engel).
Königliches Statistisches Bureau (1873): Die Gemeinden und Gutsbezirke des Preußischen Staates und ihre Bevölkerung. Nach den Urmaterialien der allgemeinen Volkszählung vom 1. December 1871. Bearbeitet und zusammengestellt vom Königlichen Statistischen Bureau. X. Provinz Hessen-Nassau, Berlin: Verlag des Königlichen Statistischen Bureaus (Dr. Engel).
Königliches Statistisches Bureau (1874): Die Gemeinden und Gutsbezirke des Preußischen Staates und ihre Bevölkerung. Nach den Urmaterialien der allgemeinen Volkszählung vom 1. December 1871. Bearbeitet und zusammengestellt vom Königlichen Statistischen Bureau. VI. Provinz Sachsen, Berlin: Verlag des Königlichen Statistischen Bureaus (Dr. Engel).
Königliches Statistisches Bureau (1874): Die Gemeinden und Gutsbezirke des Preußischen Staates und ihre Bevölkerung. Nach den Urmaterialien der allgemeinen Volkszählung vom 1. December 1871. Bearbeitet und zusammengestellt vom Königlichen Statistischen Bureau. VII. Provinz Schleswig-Holstein, Berlin: Verlag des Königlichen Statistischen Bureaus (Dr. Engel).
Königliches Statistisches Bureau (1874): Die Gemeinden und Gutsbezirke des Preußischen Staates und ihre Bevölkerung. Nach den Urmaterialien der allgemeinen Volkszählung vom 1. December 1871. Bearbeitet und zusammengestellt vom Königlichen Statistischen Bureau. IV. Provinz Schlesien, Berlin: Verlag des Königlichen Statistischen Bureaus (Dr. Engel).
Königliches Statistisches Bureau (1874): Die Gemeinden und Gutsbezirke des Preußischen Staates und ihre Bevölkerung. Nach den Urmaterialien der allgemeinen Volkszählung vom 1. December 1871. Bearbeitet und zusammengestellt vom Königlichen Statistischen Bureau. III. Provinz Pommern, Berlin: Verlag des Königlichen Statistischen Bureaus (Dr. Engel).
Landesamt für Statistik Niedersachsen (2019): Bevölkerung von 1821 bis 1961 (nach G. Uelschen), ab 1970 Fortschreibung, ab 2011 Zensus 2011, Z100300G, Hannover: Landesamt für Statistik Niedersachsen.
Landesamt für Statistik Niedersachsen (2020): Bevölkerung nach Geschlecht; Fläche, Bevölkerungsdichte (Gemeinde; Zeitreihe), Z100001G, Hannover: Landesamt für Statistik Niedersachsen.
Landesbetrieb für Datenverarbeitung und Statistik (2006): Historisches Gemeindeverzeichnis des Landes Brandenburg 1875 bis 2005, Erschienen im Dezember 2006, Potsdam.
Schubert, Ulrich (2018): gemeindeverzeichnis.de, Gemeindeverzeichnis Deutschland 1900, Link: https://gemeindeverzeichnis.de, Access: 11.04.2020.
Staatliche Zentralverwaltung für Statistik – Zentrales Zählbüro (1966): Verzeichnis der Gemeinden und Ortsteile der Deutschen Demokratischen Republik, Berlin: Staatsverlag der Deutschen Demokratischen Republik.
Statistische Ämter des Bundes und der Länder (2014): Zensus 2011. Bevölkerung. Ergebnisse des Zensus am 9. Mai 2011, Erschienen am 28. Mai 2014, Wiesbaden: Statistische Ämter des Bundes und der Länder.
Statistische Landesamt Sachsen-Anhalt (2009): Bevölkerung und Erwerbstätigkeit. Bevölkerung der Gemeinden nach Kreisen. 1964–2007, Statistische Berichte A I-/07, Halle (Saale): Statistisches Landesamt Sachsen-Anhalt.
Statistisches Amt des Saarlandes (1948): Amtliches Gemeinde- und Ortsverzeichnis des Saarlandes mit Übersichtskarte nach dem Gebietsstand vom 1.7.1948, Saarbrücken: Statistisches Amt des Saarlandes.
Statistisches Amt des Saarlandes (1972): Amtliches Gemeindeverzeichnis, 11. Ed., Saarbrücken: Statistisches Amt des Saarlandes.
Statistisches Amt Mecklenburg-Vorpommern (2019): Bevölkerung der Gemeinden Mecklenburg-Vorpommerns für die Jahre 1982 bis 1989 zum Gebietsstand der Landkreisneuordnung 1994 (nach Geschlecht und 5er Altersgruppen), provided upon request, 06.12.2019, Schwerin: Statistisches Amt Mecklenburg-Vorpommern.
Statistisches Bundesamt (1997): Gemeindeverzeichnis. Gebietsstand: 31.12.1996 (Jahr). Auszug aus Gemeindedaten (ergänzt mit Gemeindeverband), Wiesbaden: Statistisches Bundesamt.
Statistisches Bundesamt (2020): Gemeindeverzeichnis. Alle politisch selbständigen Gemeinden (mit Gemeindeverband) in Deutschland nach Fläche, Bevölkerung, Bevölkerungsdichte und der Postleitzahl des Verwaltungssitzes der Gemeinde. Ergänzt um die geografischen Mittelpunktkoordinaten, Reisegebiete und Grad der Verstädterung. Gebietsstand: 31.12.2019 (Jahr), Wiesbaden: Statistisches Bundesamt.
Statistisches Bureau der Deputation für direkte Steuern (1872): Statistik des Hamburgischen Staates, Heft IV, Hamburg: Verlag von Otto Meissner.
Statistisches Bureau im Herzoglichen Staatsministerium, Abtheilung des Innern (1875): Ortsverzeichnißdes Herzogthums S. Meiningen auf Grund der Volkszählung vom 1. December 1871, Meiningen: In Kommission der Herzoglichen Hofbuchhandlung von Brückner & Renner.
Statistisches Bureau vereinigter Thüringischer Staaten in Jena (1875): Ortsverzeichnißder am statistischen Bureau zu Jena betheiligten Thüringischen Staaten, Jena: Verlag von E. Frommann.
Statistisches Landesamt Baden-Württemberg (2019): Bevölkerung insgesamt 1871 bis 2011 (VZ/ZS), provided upon request, 12.07.2019, Stuttgart: Statistisches Landesamt Baden-Württemberg.
Statistisches Landesamt Bremen (2019): Bevölkerung nach Geschlecht, 12411-01-01, Bremen: Statistisches Landesamt Bremen.
Statistisches Landesamt des Freistaates Sachsen (2020): Bevölkerung am 31.12. (Basis Registerdaten), Geschlecht/Altersgruppen – Gemeinden (GS 01.01.16) – Stichtage. Fortschreibung des Bevölkerungsst. (Basis 1990), Kamenz: Statistisches Landesamt des Freistaates Sachsen.
Statistisches Landesamt Hamburg (1953): Statistisches Jahrbuch 1952. Freie und Hansestadt Hamburg, Hamburg: Statistisches Landesamt Hamburg.
Statistisches Landesamt Hamburg (1976): Statistisches Jahrbuch 1974/1975. Freie und Hansestadt Hamburg, Hamburg: Statistisches Landesamt Hamburg.
Statistisches Landesamt Hamburg (1989): Statistisches Jahrbuch 1989. Freie und Hansestadt Hamburg, Hamburg: Statistisches Landesamt Hamburg.
Statistisches Landesamt Nordrhein-Westfalen (1964): Gemeindestatistik des Landes Nordrhein-Westfalen. Bevölkerungsentwicklung 1871–1961, Beiträge zur Statistik des Landes Nordrhein-Westfalen, Sonderreihe Volkszählung 1961, Heft 3c, Düsseldorf: Statistisches Landesamt Nordrhein-Westfalen.
Statistisches Landesamt Rheinland-Pfalz (2019): Bevölkerung am Ort der Hauptwohnung (1815 bis 2011) (Zeitreihe), Bevölkerung am Ort der Hauptwohnung (1815 bis 2011) (Zeitreihe), provided upon request, 16.08.2019, Bad Ems: Statistisches Landesamt Rheinland-Pfalz.
Statistisches Landesamt Rheinland-Pfalz (2019): Bevölkerung nach Geschlecht, Nat. u. Altersjahren bis 90 und älter (Basis VZ 1987) (1987–2010) (Zeitreihe), provided upon request, 16.08.2019, Bad Ems: Statistisches Landesamt Rheinland-Pfalz.
Statistisches Landesamt Saarland (1990): Amtliches Gemeindeverzeichnis, 13. Ed., Saarbrücken: Statistisches Landesamt Saarland.
Statistisches Landesamt Schleswig-Holstein (1972): Die Bevölkerung der Gemeinden in Schleswig-Holstein 1867-1970 (Historisches Gemeindeverzeichnis), Kiel: Statistisches Landesamt Schleswig-Holstein.
Statistisches Landesamt Schleswig-Holstein (1989): Bevölkerung und Bevölkerungsdichte in den Gemeinden Schleswig-Holsteins. Ergebnisse der Volks- und Berufszählungen am 13.9.1950, 6.6.1961, 27.5.1970 und 25.5.1987, Gemeinden nach dem Gebietsstand vom 25.5.1987, Kiel: Statistisches Landesamt Schleswig-Holstein.
Statistisches Reichsamt (1941): Amtliches Gemeindeverzeichnis für das Deutsche Reich aufgrund der Volkszählung 1939, 2. Ed., Berlin: Verlag für Sozialpolitik, Wirtschaft und Statistik, Paul Schmidt.
Statistisches Zentralamt der Deutschen Wirtschaftskommission für die sowjetische Besatzungszone (1948): Volks- und Berufszählung vom 29. Oktober 1946 in der sowjetischen Besatzungszone Deutschlands, Band I: Amtliches Gemeindeverzeichnis, Berlin: Deutscher Zentralverlag.
Thüringer Landesamt für Statistik (2019): Bevölkerung Thüringens 1981, 1985 und 1989 (31.12.) nach Kreisen, Gemeinden und Geschlecht, provided upon request, 16.10.2019, Erfurt: Thüringer Landesamt für Statistik.
Thüringer Landesamt für Statistik (2019): Bevölkerung Thüringens am 31.12.1964 nach Kreisen, Gemeinden und Geschlecht, Ergebnisse der Volkszählung vom 31.12.1964, provided upon request, 16.10.2019, Erfurt: Thüringer Landesamt für Statistik.
Uelschen, Gustav (1942): Die Bevölkerung im Wirtschaftsgebiet Niedersachsen 1821–1939, Einwohnerzahl, Volksdichte und Bevölkerungsentwicklung der Gemeinden 1821, 1848, 1871, 1885, 1905, 1925, 1939 (Zahlenband), Oldenburg i.O.: Verlag Gerhard Stalling.
References
Becker, S.O., Heblich, S., and Sturm, D.M. (2021). The impact of public employment: evidence from Bonn. J. Urban Econ. 122: 103291, https://doi.org/10.1016/j.jue.2020.103291.Search in Google Scholar
Becker, S.O., Mergele, L., and Woessmann, L. (2020). The separation and reunification of Germany: rethinking a natural experiment interpretation of the enduring effects of communism. J. Econ. Perspect. 34: 143–171, https://doi.org/10.1257/jep.34.2.143.Search in Google Scholar
Bluhm, R., Lessmann, C., and Schaudt, P. (2021). The political Geography of cities. In: CESifo Working Paper Series 9376. CESifo, Munich.10.2139/ssrn.3953012Search in Google Scholar
Buettner, T. and Rincke, J. (2007). Labor market effects of economic integration: the impact of Re-unification in German border regions. Ger. Econ. Rev. 8: 536–560, https://doi.org/10.1111/j.1468-0475.2007.00417.x.Search in Google Scholar
Calonico, S., Cattaneo, M.D., Farrell, M.H., and Titiunik, R. (2017). rdrobust: software for regression-discontinuity designs. Stata J. 17: 372–404, https://doi.org/10.1177/1536867x1701700208.Search in Google Scholar
Ehrlich, M.V. and Seidel, T. (2018). The persistent effects of place-based policy: evidence from the West-German Zonenrandgebiet. Am. Econ. J. Econ. Pol. 10: 344–374, https://doi.org/10.1257/pol.20160395.Search in Google Scholar
Franke, R. (2017). The Cost of remoteness revisited. Kiel Working Paper 2070. Kiel Institute for the World Economy (IfW), Kiel.Search in Google Scholar
Freier, R., Simmler, M., and Wittrock, C. (2021). Public good provision and local employment – evidence from Grammar School Closures in East Germany. Reg. Sci. Urban Econ. 88: 103672, https://doi.org/10.1016/j.regsciurbeco.2021.103672.Search in Google Scholar
Ragnitz, J. (2019). Dimensionen des regionalen Gefälles: Gibt es ein gemeinsames Muster? Wirtschaftsdienst 99: 19–23, https://doi.org/10.1007/s10273-019-2427-7.Search in Google Scholar
Redding, S.J. and Sturm, D.M. (2008). The costs of remoteness: evidence from German division and reunification. Am. Econ. Rev. 98: 1766–1797, https://doi.org/10.1257/aer.98.5.1766.Search in Google Scholar
Rösel, F. (2021). Leuchttürme mit langem Schatten: Frühere DDR-Bezirksstädte haben heute noch immer fast 50 000 Einwohner mehr. ifo Dresd. Berichtet 28: 10–13.Search in Google Scholar
Rösel, F. (2022). Wie entwickelt sich Deutschland regional? Erste gebietsstandsbereinigte Einwohnerzahlen für alle Bundesländer seit 1871. ifo Dresd. Berichtet 29: 6–9.Search in Google Scholar
Rösel, F. and Weishaupt, T. (2020). Städte quellen über, das Land dünnt sich aus: Anteil der Landbevölkerung auf niedrigstem Stand seit 1871. ifo Dresd. Berichtet 27: 4–6.Search in Google Scholar
Statistisches Bundesamt. (2020). Gemeindeverzeichnis: Alle politisch selbständigen Gemeinden (mit Gemeindeverband) in Deutschland nach Fläche, Bevölkerung, Bevölkerungsdichte und der Postleitzahl des Verwaltungssitzes der Gemeinde. Ergänzt um die geografischen Mittelpunktkoordinaten, Reisegebiete und Grad der Verstädterung. Gebietsstand: 31.12.2019 (Jahr). Statistisches Bundesamt, Wiesbaden.Search in Google Scholar
© 2022 the author(s), published by De Gruyter, Berlin/Boston
This work is licensed under the Creative Commons Attribution 4.0 International License.
Articles in the same Issue
- Frontmatter
- Editorial
- Empirical Studies with Micro-Data from Official Statistics in Germany
- Special Issue Articles
- German Firms in International Trade: Evidence from Recent Microdata
- Localising the Upper Tail: How Top Income Corrections Affect Measures of Regional Inequality
- Energy Use Patterns in German Manufacturing from 2003 to 2017
- What Does the German Minimum Wage Do? The Impact of the Introduction of the Statutory Minimum Wage on the Composition of Low- and Minimum-Wage Labour
- Data Observer
- Micro Data on Robots from the IAB Establishment Panel
- The German Local Population Database (GPOP), 1871 to 2019
- Corona Monitoring Nationwide (RKI-SOEP-2): Seroepidemiological Study on the Spread of SARS-CoV-2 Across Germany
- The ZEW Financial Market Survey Panel