Private Supply Management and Market Power in the U.S. Dairy Industry
-
Yuliya V. Bolotova


Abstract
This research analyzes the U.S. cheese industry dynamics (changes in wholesale cheese prices, milk price, margins, and the nature of wholesale cheese pricing) in light of a herd retirement program implemented by the Cooperatives Working Together (CWT) in the period of 2003–2010, which led to an antitrust lawsuit filed by cheese buyers against a group of dairy cooperatives and a large settlement. Presuming that they had a Capper-Volstead Act immunity, the CWT cooperatives acted in a cartel-like manner to decrease milk supply to increase and stabilize milk prices received by dairy farmers. While the program may have modestly increased seller market power of dairy farmers, seller market power of dairy cooperatives involved in cheese manufacturing decreased. This is because the cost of milk used in cheese manufacturing increased at a higher rate than wholesale cheese prices, which caused wholesale cheese margins to decrease.
1 Introduction
In 2003, the National Milk Producers Federation (NMPF) and Cooperatives Working Together (CWT), a group of dairy cooperatives and individual dairy farmers, developed and began implementing a private supply management program (Cooperatives Working Together 2023). The objective of CWT program is to balance milk supply and milk demand and to stabilize and strengthen milk prices received by dairy farmers. The CWT program developed in 2003 included a herd retirement program (2003–2010) and an export assistance program (2003-present).
The CWT program was the U.S. dairy industry’s initiative to mitigate economic forces adversely affecting dairy farm profitability at the beginning of the 2000s. These economic forces included milk oversupply, which was partially due to a substantial decrease in the Federal government milk price support and a decrease in the Federal government intervention in purchasing manufactured dairy products; increasing volatility of milk prices received by dairy farmers; increasing level and volatility of agricultural input prices (in particular, feed and energy prices); and increasing exposure to fluctuations taking place in international dairy markets (Bolotova 2023; Siebert and Lyford 2009).
In 2015, a group of buyers of raw milk, cheese, and butter, who purchased these products directly from CWT dairy cooperatives filed a class action antitrust lawsuit against NMPF, CWT, and a group of dairy cooperatives: Dairy Farmers of America, Land O’Lakes, Dairylee Cooperative, and Agri-Mark. In their complaint filed in the court, the buyers alleged that by implementing the herd retirement program these cooperatives engaged in an unlawful conspiracy to limit the production of raw milk, with the purpose of eliminating competition by decreasing the number of dairy farmers, and to achieve short-run and long-run increases in prices of raw farm milk, cheese, and butter (First Impressions Salon, Inc., et al. v. National Milk Producers Federation, et al. 2015). The buyers argued that the herd retirement program was not within the scope of Capper-Volstead Act (1922) immunity and that it violated Section 1 of the Sherman Antitrust Act (1890). The dairy cooperatives settled this lawsuit with buyers of cheese and butter in 2019 for $220 million (Butter and Cheese Class Action 2021; Fu 2019). The buyers of cheese received 63 % of this settlement. The claims of raw milk buyers were not advanced during this antitrust litigation; they did not recover any damages.
This research analyzes the U.S. cheese industry dynamics (changes in wholesale cheese prices, milk price, margins, and the nature of wholesale cheese pricing) in the three periods of interest: prior, during, and after the herd retirement program. The research also highlights relevant competition (antitrust) issues. The empirical evidence suggests that wholesale cheese pricing by cheese manufacturers (dairy cooperatives and proprietary firms) in most of the analyzed cheese price series is consistent with oligopoly pricing prior and during the herd retirement program. The wholesale cheese pricing by cheese manufacturers in most of the analyzed cheese price series is consistent with monopoly pricing in the period following the herd retirement program. While wholesale cheese prices and milk price increase over time, wholesale cheese margins decrease reflecting decreasing profitability of cheese manufactures over time.
The paper is organized as follows. Section 2 discusses the herd retirement program’s implementation procedure and the market and price effects of this program using the perspective of plaintiffs in the antitrust lawsuit. Section 3 presents descriptive statistical analysis of wholesale cheese prices charged by cheese manufacturers, milk price, and wholesale cheese margins during the three periods of interest: before, during, and after the herd retirement program. Section 4 introduces a theoretical framework explaining the relationship between the wholesale cheese price and milk price by focusing on cost pass-through. Section 5 presents an econometric analysis of wholesale cheese pricing by cheese manufacturers during the three periods of interest. Section 6 summarizes the results and is followed by Section 7 discussing relevant competition (antitrust) issues.
2 Cooperatives Working Together (CWT) Herd Retirement Program: Implementation and Allegations of Illegal Collusion (Price-Fixing Cartel)
Dairy cooperatives have been historically involved in raw milk marketing, pricing, and dairy product manufacturing on behalf of dairy farmer-members in the U.S. (Ling 2011, 2012, 2014). Some dairy cooperatives perform only bargaining functions by negotiating raw milk prices and other terms of trade on behalf of dairy farmer-members with milk processors. Some dairy cooperatives own milk processing plants and process raw milk of dairy farmer-members in a variety of manufactured dairy products (fluid milk, cheese, butter, etc.) that they market on behalf of dairy farmer-members. Collective agricultural marketing activities of dairy farmers implemented through dairy cooperatives are possible due to the Capper-Volstead Act, a limited antitrust immunity to the Sherman Antitrust Act.
2.1 CWT Herd Retirement Program
CWT is a voluntary, marketing-focused program managed by the National Milk Producers Federation (NMPF), a trade association of dairy cooperatives (Brown et al. 2010; Cooperatives Working Together 2023). CWT includes dairy cooperatives and individual dairy farmers. The CWT program operates in accordance with the Capper-Volstead Act. There has not been any government participation or assistance involved in this program.
The CWT program originally developed in 2003 included a herd retirement program (2003–2010) and an export assistance program (2003-present) (Brown et al. 2010; Siebert and Lyford 2009). The participation of dairy farmers is on a voluntary basis. Dairy farmers participating in the CWT program have marketed on average 67 %–74 % of national milk supply (Brown et al. 2010). The CWT program has been funded by assessments of participating dairy farmers. The assessment introduced in July 2003 was $0.05 per hundredweight (cwt) of milk produced. The assessment was increased to $0.10 per cwt of milk produced in July 2006. Initially, approximately 90 % of all funds were allocated to the herd retirement program (Brown et al. 2010).
The objective of the herd retirement program was to control milk supply by removing from production the entire milking herds of selected dairy farmers. The herd retirement program was implemented in the period of 2003–2010. During this period, CWT held ten herd retirement rounds (First Impressions Salon, Inc., et al. v. National Milk Producers Federation, et al. 2015). To decide on whether to conduct a herd retirement round, CWT used guidelines, which included an analysis of economic indicators such as all-milk price, milk production costs, milk-feed price ratio, and milk cow inventories. During each herd retirement round, the participating dairy farmers had to submit their bids on how much money they were willing to accept to slaughter their entire milking herds. The CWT selected bids, and dairy farmers with the accepted bids had to slaughter their milking herds during 15 days after the audit process of their production was completed.
The audit focused on comparing the current year’s milk production to the previous year’s milk production to confirm that there were no significant changes in milk production attributed to the herd supposed to retire (Brown et al. 2010). After the audit was completed, cows were CWT tagged, and the dairy farmers had to send these cows to slaughter within 15 days. Once the tags were returned to CWT, the dairy farmers received their checks. Originally, dairy farmers who retired their milking herds were allowed to re-enter dairy farming. The requirement of not to re-enter dairy farming within 12 months to receive a full payment was introduced in 2009 (Brown et al. 2010). In particular, the dairy farmers received 90 % of their bids when these bids were accepted. The dairy farmers received the remaining 10 % of their bids and interest after 12 months, when it was verified that these farmers and their dairy operations did not re-enter dairy farming.
The anticipated direct market effects of the herd retirement program consistent with the program objective are a decrease in milk quantity produced by dairy farmers and an increase in milk prices received by dairy farmers caused by a decrease in milk cow inventory. The effective implementation of the herd retirement program would increase seller market power in the U.S. dairy industry at the dairy farm level of the dairy product supply chain.
The actual economic effects of the herd retirement program are discussed in the complaint filed in the court by buyers of raw milk, cheese, and butter, who purchased these products directly from CWT dairy cooperatives (First Impressions Salon, Inc., et al. v. National Milk Producers Federation, et al. 2015). These economic effects were calculated by Professor Scott Brown at the University of Missouri, who performed this analysis for CWT, prior to the moment the antitrust lawsuit was filed. The complaint includes copies of selected slides from Power-Point Presentations prepared by Professor Scott Brown.
The actual economic effects of the ten herd retirement rounds (2003–2010) were as follows (Appendix Table A1; First Impressions Salon, Inc., et al. v. National Milk Producers Federation, et al. 2015).[1] 2802 dairy farms retired their milking herds. 506,921 cows were removed from production, which represented 0.69 % of milk cow inventory during the period of 2003–2010. Milk supply was reduced by 9.672 billion pounds of milk, which represented 0.66 % of total milk production during the period of 2003–2010. In addition, the effect of the herd retirement program on the U.S. milk price received by dairy farmers was $0.05 per cwt in 2003, $0.16 per cwt in 2004, $0.44 per cwt in 2005, $0.55 per cwt in 2006, $0.62 per cwt in 2007, and $0.57 per cwt in 2008. The milk price increases for 2009 and 2010 are not reported in the complaint. Expressed as a percentage of the U.S. milk price, the milk price increases due to the herd retirement program were 0.4 % in 2003, 1.0 % in 2004, 2.9 % in 2005, 4.2 % in 2006, 3.2 % in 2007, and 3.1 % in 2008. The cumulative increase in the revenue from milk sales by dairy farmers due to the herd retirement program was $4.4 billion during the period of 2003–2008 and $9.55 billion during the period of 2003–2010.
Since 2010, the entire focus of CWT program shifted to export assistance. The objective of the export assistance program is to help dairy farmers expand foreign markets for manufactured dairy products by allocating subsidies to participating dairy cooperatives on export of selected manufactured dairy products. In the period from 2003 to 2009, butter and cheese were the products subject to CWT export assistance. Beginning in 2010, the product list was expanded to include whole milk powder.
2.2 Herd Retirement Program as a Price-Fixing Cartel: Buyers’ Perspective
The buyers of raw milk, cheese, and butter, who purchased these products directly from CWT dairy cooperatives (plaintiffs in the lawsuit), claimed that by implementing the herd retirement program these dairy cooperatives engaged in an illegal conspiracy that aimed to eliminate competition among dairy farmers and forced some dairy farmers to exit the industry. These buyers argued that the herd retirement program limited the supply of raw milk, cheese, and butter and caused wholesale prices of these products to increase to supra-competitive levels. The plaintiffs perceived the herd retirement program as a classic price-fixing cartel agreement among competitors (dairy farmers) aiming to decrease the output (milk and manufactured dairy products) quantity with the purpose of increasing the output (milk and manufactured dairy products) price that violates Section 1 of the Sherman Antitrust Act.[2]
Classic cartels are typically organized in oligopolistic markets characterized by a high level of market concentration (small number of sellers), homogeneous product, high barriers to entry, and inelastic demand (Bolotova 2009; Carlton and Perloff 2004; Stigler 1964). When oligopolists form a cartel, they aim to act as a single monopolist to increase their joint profit. To be successful, cartel members have to develop an effective agreement affecting their product prices and/or quantities in a way that increases their joint profit and effectively enforce this agreement. In particular, cartel members should be able to prevent cheating of individual cartel members on the agreement. The latter would occur when a cartel member would aim to increase their individual profit.
Agricultural industries are often characterized as perfectly competitive industries because there are many firms (farms) operating in these industries and barriers to entry are relatively low. Individually, agricultural producers are price-takers. Some organizations of agricultural producers and their collective agricultural marketing programs and activities possible due to the Capper-Volstead Act may be characterized as agricultural cartels. Due to the Capper-Volstead Act, agricultural producers may gain seller market power by acting collectively in a cartel-type manner.
The CWT dairy farmer-members, who paid assessments to fund the herd retirement program, marketed on average 67 %–74 % of national milk supply (Brown et al. 2010). Therefore, the combined market share of CWT dairy farmer-members was larger, compared to the combined market share of dairy cooperatives and individual dairy farmers who were not CWT members. Raw milk is a homogenous product characterized by inelastic demand. The domestic demand for raw milk is inelastic (Saitone and Sexton 2009), meaning that a one percent decrease (increase) in milk supply would cause a greater than one percent increase (decrease) in milk price. The inelastic demand is a market condition in which an effective output price effect of the supply control is theoretically possible (a percentage output price increase is greater than a percentage output quantity decrease).[3]
The plaintiffs argued that the herd retirement program was an illegal conspiracy that was outside the scope of the Capper-Volstead Act immunity and consequently violated Section 1 of the Sherman Antitrust Act. Figure 1 demonstrates market and price effects of the herd retirement program using the perspective of raw milk and cheese buyers who filed the antitrust lawsuit. Figure 1 depicts inverse demand curves for raw milk and cheese at the wholesale level (labeled as “MP” and “CP”, respectively) reflecting price-dependent demand functions, and a Marginal Cost curve (labeled as “MC milk”) reflecting a constant Marginal Cost function. While the Marginal Cost curve is depicted in Figure 1, this cost is practically irrelevant in advancing legal claims of the output price increase due to the collective output quantity decrease by plaintiffs during antitrust litigations involving price-fixing.
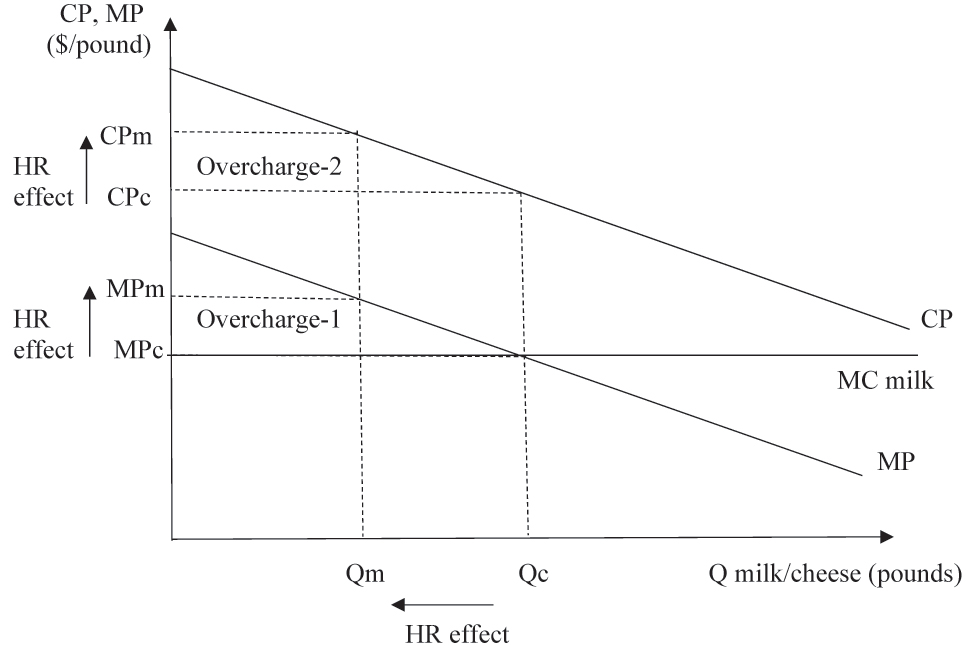
The market and price effects of CWT Herd Retirement (HR) Program: The raw milk and cheese buyers’ perspective.
Figure 1 also depicts price-quantity combinations for raw milk and cheese for two market scenarios: a competitive industry scenario representing the market situation prior to the herd retirement program and a scenario where the dairy industry exercises seller market power by implementing the herd retirement program. Raw milk is the main component in cheese manufacturing: ten pounds of milk are typically required to produce one pound of cheese. The same Q is used to define milk quantity and cheese quantity in Figure 1.
A decrease in milk cow inventory due to the herd retirement program causes the milk quantity and cheese quantity produced to decrease from Qc to Qm. As a result, the milk price charged by dairy farmers increases from MPc to MPm, and the wholesale cheese price charged by cheese manufacturers (dairy cooperatives in the antitrust lawsuit) increases from CPc to CPm. In the market power scenario, raw milk buyers and cheese buyers pay higher milk and cheese prices and are overcharged. The overcharge attributed to buyers of raw milk is (MPm-MPc) in $ per pound of milk. The total $ overcharge attributed to buyers of raw milk is (MPm-MPc)*Qm, which is the Overcharge-1 rectangle in Figure 1. The overcharge attributed to buyers of cheese is (CPm-CPc) in $ per pound of cheese. The total $ overcharge attributed to buyers of cheese is (CPm-CPc)*Qm, which is the Overcharge-2 rectangle in Figure 1.
The total overcharge is the basis for damages that buyers of raw milk and cheese aimed to recover during the antitrust litigation. They were entitled to recover treble damages (three times the overcharge) under the Clayton Act (1914), a federal law. While cheese buyers were successful in recovering damages, the claims of raw milk buyers were not advanced during the antitrust litigation. The raw milk buyers were not awarded any damages. The milk price increases and milk revenue increases that were due to the herd retirement program discussed earlier in this section may be thought of as proxies for the overcharge in $ per unit of milk sold and total $ overcharge, respectively, attributed to buyers of raw milk.
3 U.S. Cheese Industry: Descriptive Statistical Analysis of Wholesale Cheese Prices, Milk Price, and Cheese Margins
This section presents an analysis of the monthly averages for wholesale cheese prices, Class III milk price, and wholesale cheese margins (farm-to-wholesale margins) for the three periods of interest: prior, during, and after the herd retirement program, which are referred to as the pre-HR period, HR period, and post-HR period, respectively (Table 1). The monthly wholesale cheese prices are from the USDA Agricultural Marketing Service Dairy Market News Portal (U.S. Department of Agriculture, Agricultural Marketing Service 2021a). These are the selling prices charged by cheese manufactures for American style natural cheeses - Cheddar, Process American, and Monterey Jack – in the Midwest, Northeast, and Western U.S. The focus of empirical analysis is on American style natural cheeses because dairy cooperatives are mostly active in the production and marketing of this cheese style. For example, in 2007 the market share of dairy cooperatives in the production of American cheese was 44 % (U.S. Department of Agriculture, Rural Development 2019).
Milk price, wholesale cheese prices, and wholesale cheese margins in the Midwest, Northeast, and Western U.S. (2010–2014).
| Class III milk price ($ per 10 pounds) | Midwest | Northeast | West | |||||||
|---|---|---|---|---|---|---|---|---|---|---|
| Cheddar 40# Block | Process American 5# Loaf | Monterey Jack 10# | Cheddar 40# Block | Process American 5# Sliced | Cheddar 40# Block | Cheddar 10# Cuts | Process American 5# Loaf | Monterey Jack 10# | ||
|
|
||||||||||
| Wholesale cheese price in $ per pound | ||||||||||
| Pre-herd retirement program period (pre-HR period: 2000–2003) | ||||||||||
| Average | 1.12 | 1.85 | 1.54 | 1.97 | 1.51 | 1.59 | 1.48 | 1.68 | 1.51 | 1.66 |
| Herd retirement program period (HR period: 2004–2010) | ||||||||||
| Average | 1.47 | 2.16 | 1.93 | 2.22 | 1.87 | 1.83 | 1.84 | 1.95 | 1.78 | 1.93 |
| % change in HR period, relative to pre-HR period | ||||||||||
| Average | 31 | 17 | 25 | 12 | 23 | 15 | 24 | 16 | 18 | 16 |
| Post-herd retirement program period (post-HR period: 2011–2014) | ||||||||||
| Average | 1.90 | 2.49 | 2.26 | 2.54 | 2.36 | 2.17 | 2.14 | 2.26 | 2.06 | 2.24 |
| % change in post-HR period, relative to HR period | ||||||||||
| Average | 30 | 16 | 17 | 14 | 26 | 18 | 17 | 16 | 16 | 16 |
|
|
||||||||||
| Wholesale cheese margin as a % of wholesale cheese price | ||||||||||
|
|
||||||||||
| Pre-herd retirement program period (pre-HR period: 2000–2003) | ||||||||||
| Average | 40.0 | 27.9 | 43.7 | 26.6 | 30.2 | 24.7 | 34.1 | 26.6 | 33.3 | |
| Herd retirement program period (HR period: 2004–2010) | ||||||||||
| Average | 32.4 | 24.3 | 34.4 | 21.9 | 20.5 | 20.7 | 25.4 | 18.2 | 24.6 | |
| % change in HR period, relative to pre-HR period | ||||||||||
| Average | −19 | −13 | −21 | −18 | −32 | −16 | −26 | −32 | −26 | |
| Post-herd retirement program period (post-HR period: 2011–2014) | ||||||||||
| Average | 23.4 | 16.0 | 25.0 | 19.6 | 12.1 | 11.4 | 15.9 | 7.9 | 15.1 | |
| % change in post-HR period relative to HR period | ||||||||||
| Average | −28 | −34 | −27 | −10 | −41 | −45 | −37 | −56 | −39 | |
The monthly Class III milk prices are from the USDA Agricultural Marketing Service Dairy Public Database (U.S. Department of Agriculture, Agricultural Marketing Service 2021b). The Class III milk price is the price that cheese manufacturers pay for milk used in cheese manufacturing within the system of Federal Milk Marketing Orders (FMMOs). The wholesale cheese margins (farm-to-wholesale margins) are calculated as the differences between wholesale cheese prices ($ per pound) and Class III milk price ($ per 10 pounds), which represents the cost of milk used to produce one pound of cheese. The wholesale cheese margins are expressed as a percentage of the wholesale cheese prices. Wholesale cheese margins include cheese manufacturing costs and profit of cheese manufacturers. The monthly wholesale prices, Class III milk price, and wholesale margins for Cheddar 40# block sold in the Midwest and Western U.S. are depicted in Figures 2 and 3, respectively. Class III milk price is referred to as the milk price further in this section.
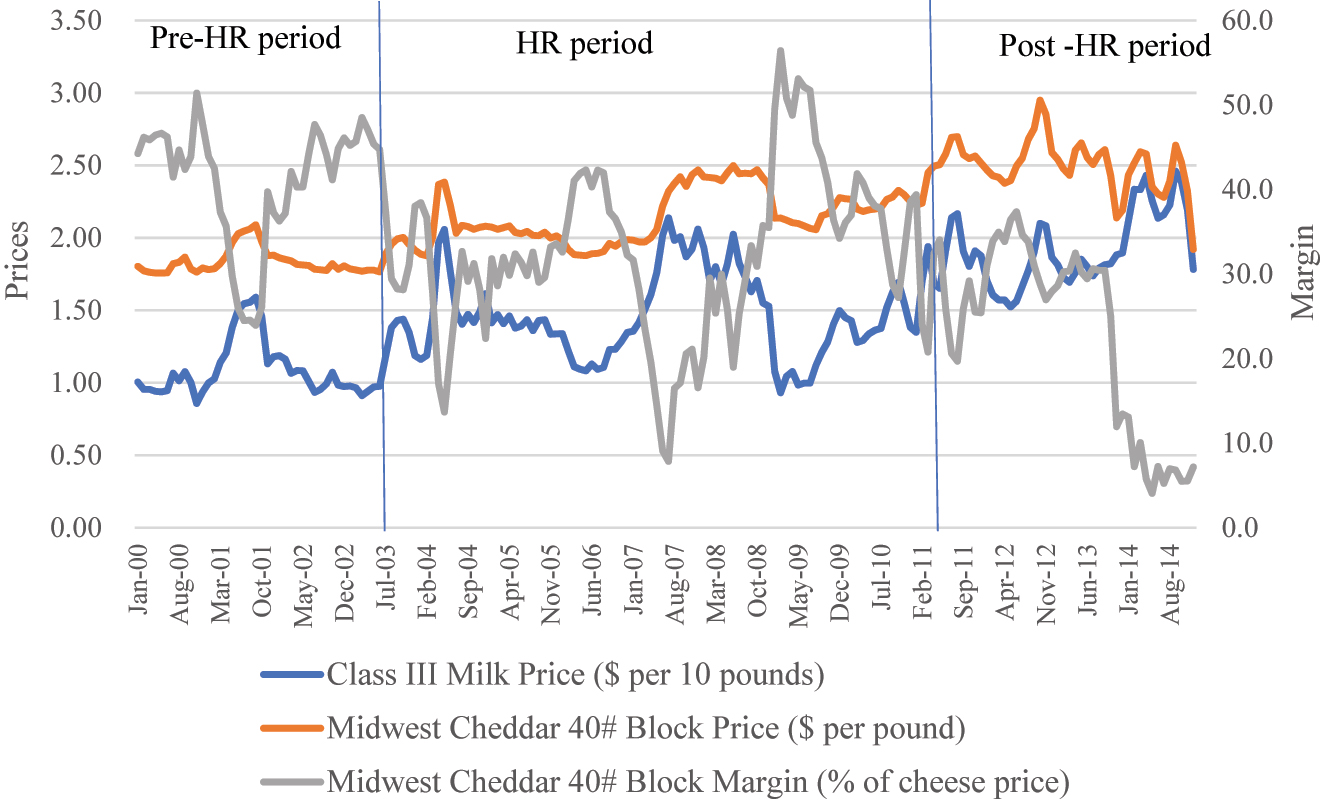
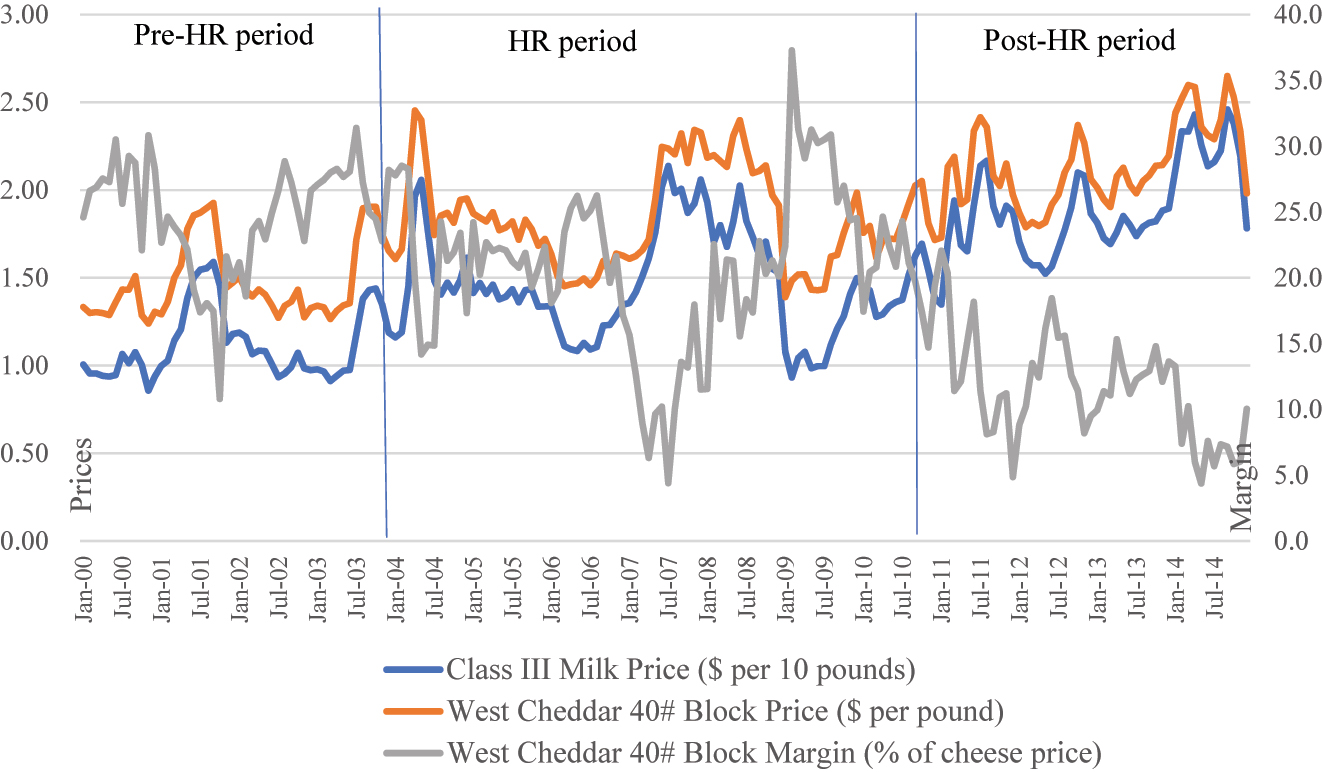
Wholesale cheese prices and margins vary across the regions. In addition, wholesale cheese prices and margins differ due to the cheese variety (Cheddar, Process American, and Monterey Jack) and the type and weight of packaging (40 pound (#) block, 5# loaf, 5# sliced, 10# cuts, etc.). In the pre-HR period, monthly average wholesale cheese prices in the analyzed regions are in the range of $1.48 per pound (Cheddar 40# block in the West) to $1.97 per pound (Monterey Jack 10# in the Midwest). The monthly average milk price is $1.12 per 10 pounds of milk. The monthly average wholesale cheese margins are in the range of 24.7 % (Cheddar 40# block in the West) to 43.7 % (Monterey Jack 10# in the Midwest).
In the HR-period, as compared with the pre-HR period, monthly average wholesale cheese prices and milk price increase. The milk price increase rate is higher than the cheese price increase rates. The monthly average milk price increases by 31 %.[4] The monthly average cheese price increases are in the range of 12 % (Monterey Jack 10# in the Midwest) to 25 % (Process American 5# loaf in the Midwest). In the HR period, monthly average wholesale cheese prices are in the range of $1.78 per pound (Process American 5# loaf in the West) to $2.22 per pound (Monterey Jack 10# in the Midwest). The monthly average milk price is $1.47 per 10 pounds of milk.
In the HR period, as compared with the pre-HR period, monthly average wholesale cheese margins decrease. The wholesale cheese margin decreases are in the range of −32 % (Process American 5# sliced in the Northeast and Process American 5# loaf in the West) to −13 % (Process American 5# loaf in the Midwest). In the HR-period, monthly average wholesale cheese margins are in the range of 18.2 % (Process American 5# loaf in the West) to 34.4 % (Monterey Jack 10# in the Midwest).
In the post-HR period, as compared with the HR period, monthly average wholesale cheese prices and milk price continue to increase. The milk price increase rate is higher than the cheese price increase rates. The monthly average milk price increases by 30 %.[5] The cheese price increases are in the range of 14 % (Monterey Jack 10# in the Midwest) to 26 % (Cheddar 40# block in the Northeast). In the post-HR period, monthly average wholesale cheese prices are in the range of $2.06 per pound (Process American 5# loaf in the West) to $2.54 per pound (Monterey Jack 10# in the Midwest). The monthly average milk price is $1.90 per 10 pounds of milk.
In the post-HR period, as compared with the HR period, monthly average wholesale cheese margins decrease. The wholesale cheese margin decreases are in the range of −56 % (Process American 5# loaf in the West) to −10 % (Cheddar 40# block in the Northeast). In the post-HR period, monthly average wholesale cheese margins are in the range of 7.9 % (Process American 5# loaf in the West) to 25 % (Monterey Jack 10# in the Midwest).
4 Theoretical Framework: The Relationship Between Cheese Price and Milk Price, and Cost Pass-Through in the Cheese Industry
Figure 4 is a graphical representation of the theoretical framework that explains increases in the output (cheese) price that are due to an increase in the input (milk) price.[6] Within this framework, the milk price increase may be due to the increase in milk production costs and/or due to the herd retirement program. Figure 4 provides insights on the relationship between the wholesale cheese price and milk price and the nature of wholesale cheese pricing (perfectly competitive or oligopoly/monopoly pricing) evaluated using an econometric analysis presented in the next section. Figure 4 depicts an inverse demand curve for cheese at the wholesale level (labeled as “P”) reflecting a linear price-dependent demand function and a Marginal Cost curve (labeled as “MC”) reflecting a constant Marginal Cost function. Marginal Cost of producing cheese is basically the milk price that cheese manufacturers pay. The profit-maximizing cheese price-quantity combinations for two market structures are depicted in the figure: a perfectly competitive industry equilibrium labeled as “C” (Qc and Pc: original scenario) and a monopoly equilibrium labeled as “M” (Qm and Pm: original scenario).
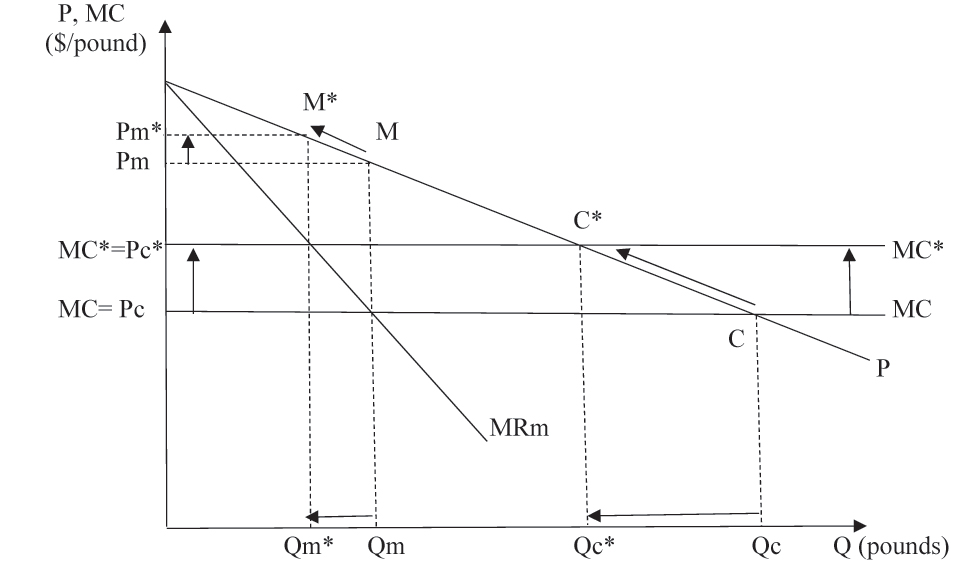
A perfectly competitive industry and monopoly: The output price increase due to a marginal cost increase.
The milk price increase, which may be due to an increase in milk production costs and/or due to the herd retirement program, is equivalent to an upward shift of the original MC curve (the original scenario with no herd retirement program) to the new MC curve labeled as “MC*” in Figure 4 (the new scenario: with herd retirement program). Assuming the cheese industry behaves as a perfectly competitive industry, it moves to the new market equilibrium labeled as “C*” (Qc* and Pc*). Assuming the cheese industry behaves as a monopoly, it moves to the new market equilibrium labeled as “M*” (Qm* and Pm*). In the case of both market structures, the cheese industry decreases cheese quantity and increases wholesale cheese price to pass the milk price increase on to the buyers of cheese at the wholesale level.
The difference between the two market structures is cost pass-through (CPT), which is the extent to which the industry passes the input price (cost) increase on the buyers of its output in the form of higher output prices. The CPT is a $ per unit increase (decrease) in the output price, which follows a $1 per unit increase (decrease) in the input price (or marginal cost). The CPT for a profit-maximizing perfectly competitive industry is equal to 1 (a complete CPT):
Generally, in the case of imperfectly competitive market structures, CPT magnitude is affected by the type of market structure (monopoly or oligopoly), a demand curvature assumption (linear, convex, or concave), and a Marginal Cost assumption (constant or upward sloping Marginal Cost curve) (Cotterill et al. 2001; Cotterill 1998; Kosicki and Cahill 2006; Harris and Sullivan 1979; Oxera Agenda 2007; RBB Economics 2014). In addition to CPT cases explained above, the following CPT magnitudes are discussed in academic literature. CPT for monopoly operating in market with concave demand (and constant marginal cost) is smaller than 0.5 (an incomplete CPT) (Oxera Agenda 2007; RBB Economics 2014). CPT for monopoly and oligopoly operating in market with convex demand is greater than 1 (more than complete CPT) (Cotterill et al. 2001; Cotterill 1998; Kosicki and Cahill 2006). An upward sloping Marginal Cost would decrease CPT magnitude, as compared to a constant Marginal Cost (RBB Economics 2014). In the case of a perfectly competitive market structure, CPT magnitude is typically affected by demand and supply elasticities (Harris and Sullivan 1979; RBB Economics 2014).
Table 2 summarizes CPT thresholds and corresponding market structure and pricing behavior assumptions relevant to the econometric analysis presented in the next section. These CPT thresholds were also used in the existing academic literature to analyze supermarket pricing practices in the U.S. fluid milk markets (Bolotova and Novakovic 2012; Carman and Sexton 2005) and wholesale cheese pricing practices at the Chicago Mercantile Exchange spot cheese market (Bolotova and Novakovic 2015). The CPT thresholds summarized in Table 2 are the hypotheses tested using the estimated econometric models in this research.
Cost pass-through (CPT) and assumptions on market structure and pricing behavior.
| Cost pass-through | Market structure and pricing behavior assumption |
|---|---|
| CPT = 1 (complete CPT) | Perfectly competitive pricing |
| 0.5 < CPT < 1 (incomplete CPT) | Oligopoly pricing in a market with linear demand and constant marginal cost CPT = 0.75 is chosen as a mid-range to test for oligopoly pricing |
| CPT = 0.5 (incomplete CPT) | Monopoly pricing in a market with linear demand and constant marginal cost |
| CPT < 0.5 (incomplete CPT) | Monopoly pricing in a market with concave demand and constant marginal cost |
5 Econometric Analysis
5.1 A Simple Framework of Farm-to-Wholesale Price Transmission Process
The econometric analysis is used to evaluate the nature of wholesale cheese pricing by cheese manufacturers (dairy cooperatives and proprietary firms) in the periods before, during, and after the herd retirement program. The cost pass-throughs (CPT) at the farm-to-wholesale level of the U.S. cheese supply chain are estimated to identify the nature of wholesale cheese pricing: a perfectly competitive industry pricing, an oligopoly pricing, or a monopoly pricing in the three periods of interest.
The focus is on the relationship between the wholesale cheese price (a revenue element for cheese manufacturers) and the milk price (a cost element for cheese manufacturers) specified by Equation (1). This equation represents a linear farm-to-wholesale price transmission process. The output (cheese) price is specified as a linear function of the input (milk) price.
a is a fixed absolute markup (FAM), which is a non-negative constant. b is a cost pass-through (CPT), which is also referred to as a farm-to-wholesale price transmission coefficient. Equation (1) suggests that the output (cheese) price has two components: a component that does not depend on the input price (a fixed absolute markup) and a component that depends on the input price (cost pass-through).
The magnitude of both components may be used to infer the type of output pricing method used by sellers of the output (Bolotova and Novakovic 2012; Carman and Sexton 2005; George and King 1971). The output price stabilization method would be consistent with a>0 and b<1; given the incomplete CPT, the output price is weakly dependent on the cost (input price) changes.[7] The percentage markup pricing method would be consistent with a>0 and b>1; given more than a complete CPT, the output price is strongly dependent on the markup added to the cost (input price).[8] b<1 and b>1 would reflect oligopoly and monopoly pricing, as discussed earlier. The absolute markup pricing method reflecting a perfectly competitive pricing would be consistent with a>0 and b = 1; given the complete CPT, the output price completely reflects the cost (input price) changes.
5.2 Econometric Models
Equation (2) is an econometric model of the wholesale cheese price behavior to be estimated for each wholesale cheese price series analyzed in the section presenting descriptive statistical analysis. This econometric model is specified as a linear regression model.
CPt is wholesale cheese price for a particular cheese variety in a particular geographic region in month t measured in $ per pound. MPt and MPt-1 are the current month Class III milk price and the previous month Class III milk price (the first lag) measured in $ per 10 pounds of milk to represent the cost of milk used to produce one pound of cheese. The Class III milk price is referred to as the milk price further in this section. HRt is a binary variable (intercept shifter); it is equal to one, if a wholesale cheese price observation belongs to the HR period (2004–2010) and is equal to zero otherwise. PostHRt is a binary variable (intercept shifter); it is equal to one, if a wholesale cheese price observation belongs to the post-HR period (2011–2014) and is equal to zero otherwise. The reference group is represented by wholesale cheese price observations belonging to the pre-HR period (2000–2003).[9] MPtHRt and MPt-1HRt are the interaction effects of milk prices with HR binary variable (slope shifters). MPtPostHRt and MPt-1PostHRt are the interaction effects of milk prices with post-HR binary variable (slope shifters). ε t is the error term. Each wholesale price series used in the econometric analysis includes 180 observations (15 years of monthly data). The Ordinary Least Squares (OLS) estimation procedure is used to estimate the econometric models.
Nine econometric models are estimated using wholesale cheese prices and milk price utilized in the descriptive statistical analysis. Tables 3 –5 summarize the main estimation results and their interpretation in light of the hypotheses on the nature of wholesale cheese pricing.[10] The fixed absolute markups (FAM) and cumulative cost pass-throughs (CPT) reported in Tables 3 –5 are determined as follows. The pre-HR period: FAM = α 0 and CPT = (β 0 + β 1 ). The HR period: FAM = (α 0 + γ 0 ) and CPT = (β 0 + β 1 + µ 0 + µ 1 ). The post-HR period: FAM = (α 0 + γ 1 ) and CPT = (β 0 + β 1 + θ 0 + θ 1 ). The cumulative CPTs are used to conduct T-tests on the nature of wholesale cheese pricing (perfectly competitive, monopoly, or oligopoly pricing).[11]
Wholesale cheese pricing in the U.S. Midwest (2000–2014).
| Cheddar 40# Block | Monterey Jack 10# | Process American 5# Loaf | |
|---|---|---|---|
| Price in $ per pound | |||
| Estimated Coefficient (T-ratio) | |||
| Pre-herd retirement program period (pre-HR period: 2000–2003) | |||
|
|
|||
| FAMa | 1.41 | 1.46 | 0.62 |
| CPTb | 0.40 * (−2.58) | 0.46 (−0.80) | 0.82 (1.15) |
| Ho: CPT = 0.50 is rejected in favor of Ha: CPT < 0.50; Ho: CPT = 0 is rejected in favor of Ha: CPT > 0 (10.06) |
Ho: CPT = 0.50 fails to be rejected | Ho: CPT = 0.75 fails to be rejected | |
| Economic model | Monopoly pricing [non-linear (concave) demand] | Monopoly pricing [linear demand] | Oligopoly pricing [linear demand] |
|
|
|||
| Herd retirement program period (HR period: 2004–2010) | |||
|
|
|||
| FAM | 1.49 | 1.51 | 0.70 |
| CPT | 0.45 (−0.76) | 0.48 (−0.32) | 0.84 (1.51) |
| Ho: CPT = 0.50 fails to be rejected | Ho: CPT = 0.75 fails to be rejected | ||
| Economic model | Monopoly pricing [linear demand] | Oligopoly pricing [linear demand] | |
|
|
|||
| Post-herd retirement program period (post-HR period: 2011–2014) | |||
|
|
|||
| FAM | 2.58 | 2.25 | 1.75 |
| CPT | −0.05 (−0.45) | 0.15 * (−4.09) | 0.27 * (−3.11) |
| Ho: CPT = 0 fails to be rejected | Ho: CPT = 0.50 is rejected in favor of Ha: CPT < 0.50; Ho: CPT = 0 is rejected in favor of Ha: CPT > 0 (1.67) |
Ho: CPT = 0.50 is rejected in favor of Ha: CPT < 0.50; Ho: CPT = 0 is rejected in favor of Ha: CPT > 0 (3.54) |
|
| Economic model | Monopoly pricing [non-linear (concave) demand] | ||
| R2 | 0.82 | 0.88 | 0.84 |
-
aFAM is fixed absolute markup. bCPT is a cumulative cost pass-through. T-ratios are for null hypotheses stated in this table. T-ratios are calculated using autocorrelation-adjusted standard errors based on Newey-West approach. T-statistic cut-off value used to conclude on statistical significance is |1.64| (one-tailed T-test, 5 % significance level). All FAMs are statistically greater than zero. The detailed estimation results are presented in Bolotova (2020).
Wholesale cheese pricing in the U.S. Northeast (2000–2014).
| Cheddar 40# Block |
Process American 5# Sliced |
|
|---|---|---|
| Price in $ per pound | ||
| Estimated Coefficient (T-ratio) | ||
| Pre-herd retirement program period (pre-HR period: 2000–2003) | ||
|
|
||
| FAMa | 0.73 | 0.84 |
| CPTb | 0.70 (−0.47) | 0.68 (−0.74) |
| Ho: CPT = 0.75 fails to be rejected | ||
| Economic model | Oligopoly pricing [linear demand] | |
|
|
||
| Herd retirement program period (HR period: 2004–2010) | ||
|
|
||
| FAM | 0.80 | 0.62 |
| CPT | 0.73 (−0.36) | 0.83 (1.28) |
| Ho: CPT = 0.75 fails to be rejected | ||
| Economic model | Oligopoly pricing [linear demand] | |
|
|
||
| Post-herd retirement program period (post-HR period: 2011–2014) | ||
|
|
||
| FAM | 1.30 | 0.83 |
| CPT | 0.56 (0.67) | 0.70 (−0.45) |
| Ho: CPT = 0.50 fails to be rejected | Ho: CPT = 0.75 fails to be rejected | |
| Economic model | Monopoly pricing [linear demand] | Oligopoly pricing [linear demand] |
| R2 | 0.86 | 0.79 |
-
aFAM is fixed absolute markup. bCPT is a cumulative cost pass-through. T-ratios are for null hypotheses stated in this table. T-ratios are calculated using autocorrelation-adjusted standard errors based on Newey-West approach. T-statistic cut-off value used to conclude on statistical significance is |1.64| (one-tailed T-test, 5 % significance level). All FAMs are statistically greater than zero. The detailed estimation results are presented in Bolotova (2020).
Wholesale cheese pricing in the Western U.S. (2000–2014).
| Cheddar 40# Block | Cheddar 10# Cuts | Process American 5# Loaf | Monterey Jack 10# | |
|---|---|---|---|---|
| Price in $ per pound | ||||
| Estimated coefficient (T-ratio) | ||||
| Pre-herd retirement program period (pre-HR period: 2000–2003) | ||||
|
|
||||
| FAMa | 0.61 | 0.90 | 0.76 | 0.88 |
| CPTb | 0.78 (0.25) | 0.71 (−0.45) | 0.68 (−0.74) | 0.71 (−0.44) |
| Ho: CPT = 0.75 fails to be rejected | ||||
| Economic model | Oligopoly pricing [linear demand] | |||
|
|
||||
| Herd retirement program period (HR period: 2004–2010) | ||||
|
|
||||
| FAM | 0.73 | 0.85 | 0.66 | 0.83 |
| CPT | 0.75 (0.04) | 0.75 (0.04) | 0.77 (0.31) | 0.75 (0.04) |
| Ho: CPT = 0.75 fails to be rejected | ||||
| Economic model | Oligopoly pricing [linear demand] | |||
|
|
||||
| Post-herd retirement program period (post-HR period: 2011–2014) | ||||
|
|
||||
| FAM | 1.13 | 1.25 | 1.07 | 1.23 |
| CPT | 0.53 (0.35) | 0.52 (0.28) | 0.52 (0.23) | 0.52 (0.28) |
| Ho: CPT = 0.50 fails to be rejected | ||||
| Economic model | Monopoly pricing [linear demand] | |||
| R2 | 0.83 | 0.81 | 0.80 | 0.81 |
-
aFAM is fixed absolute markup. bCPT is a cumulative cost pass-through. T-ratios are for null hypotheses stated in this table. T-ratios are calculated using autocorrelation-adjusted standard errors based on Newey-West approach. T-statistic cut-off value used to conclude on statistical significance is |1.64| (one-tailed T-test, 5 % significance level). All FAMs are statistically greater than zero. The detailed estimation results are presented in Bolotova (2020).
5.3 Estimation Results
The estimated econometric models have a high degree of explanatory power. The variation in the explanatory variables explains 79 %–88 % of the variation in the dependent variable (R2 reported in Tables 3 –5). The null hypothesis of a perfectly competitive industry pricing is rejected in favor of the alternative hypothesis of an imperfectly competitive industry pricing (oligopoly or monopoly) in the case of all analyzed cheese varieties in all analyzed regions in all three periods of interest. The estimated cost-pass throughs (CPT) are incomplete in all analyzed cases and are consistent with either oligopoly pricing in market with linear demand or monopoly pricing in markets with linear or concave demand. The incomplete CPT indicates that a $1 per unit increase (decrease) in the input (milk) price causes a less than $1 per unit increase (decrease) in the output (cheese) price. The dependence of changes in the wholesale cheese prices on changes in the milk price decreases and their dependence on fixed absolute markup increases in the post-HR period, as compared with the pre-HR and HR periods. This type of wholesale pricing is consistent with the output (cheese) price stabilization practice used by cheese manufacturers in the three periods of interest. The output (cheese) price stabilization practice may increase the output (cheese) price stability, decrease adverse effects of strategic uncertainty caused by increasing volatility of the input (milk) price, and increase margins and profit of cheese manufacturers.
5.3.1 Pre-Herd Retirement Program Period (Pre-HR Period: 2000–2003)
The wholesale cheese pricing in the Midwest region varies among cheese varieties. The wholesale pricing of Process American 5# loaf is consistent with oligopoly pricing. The wholesale pricing of Cheddar 40# block and Monterey Jack 10# is consistent with monopoly pricing. The wholesale pricing of the two analyzed cheese varieties in the U.S. Northeast region, Cheddar 40# block and Process American 5# sliced, is consistent with oligopoly pricing. The wholesale cheese pricing of the four analyzed cheese varieties in the Western U.S., Cheddar 40# block, Cheddar 10# cuts, Process American 5# loaf, and Monterey Jack 10#, is consistent with oligopoly pricing.
5.3.2 Herd Retirement Program Period (HR Period: 2004–2010)
In the HR period, as compared with the pre-HR period, the estimated CPT increases in eight out of nine analyzed cases. The estimated increases in CPT are not statistically significant from zero in seven out of eight cases. The fixed absolute markup (FAM) either increases or decreases, depending on the cheese price series. The estimated changes in FAM are not statistically significant from zero in eight out of nine analyzed cases. As a result, the nature of wholesale cheese pricing (monopoly or oligopoly pricing) does not change in all analyzed cases in the HR period, as compared with the pre-HR period.
5.3.3 Post-Herd Retirement Program Period (Post-HR Period: 2011–2014)
In the post-HR period, as compared with the HR period, FAM increases and CPT decreases in the case of all analyzed cheese price series. The estimated changes in FAM and CPT are statistically significant from zero in eight out of nine analyzed cheese price series. The estimated decreases in CPT reflect the shift from oligopoly pricing to monopoly pricing in six out of nine analyzed cheese price series in the post-HR period.
The wholesale pricing of Process American 5# loaf in the U.S. Midwest region shifts from oligopoly pricing in the HR period to monopoly pricing in the post-HR period. The wholesale pricing of Cheddar 40# block and Monterey Jack 10# in this region remains consistent with monopoly pricing in the post-HR period. The wholesale pricing of Cheddar 40# block in the U.S. Northeast region shifts from oligopoly pricing in the HR period to monopoly pricing in the post-HR period. The wholesale pricing of Process American 5# sliced in this region remains consistent with oligopoly pricing in the post-HR period. The wholesale pricing of the four analyzed cheese varieties in the Western U.S., Cheddar 40# block, Cheddar 10# cuts, Process American 5# loaf, and Monterey Jack 10#, shifts from oligopoly pricing in the HR period to monopoly pricing in the post-HR period.
6 Results: Discussion
The wholesale cheese pricing by cheese manufacturers in the pre-HR period is consistent with oligopoly pricing in the case of seven cheese price series and with monopoly pricing in the case of two cheese price series. This empirical evidence on imperfectly competitive pricing by cheese manufacturers is generally consistent with previous academic and government research focusing on the cheese industry structure and cheese pricing practices (Bolotova 2022; Bolotova and Novakovic 2015; Gould 2010; Mueller et al. 1996; Shields 2010). The estimated cost pass-through (CPT) is incomplete (smaller than one) in all analyzed cases (cheese varieties and geographic regions). Wholesale cheese margins are of a relatively high magnitude in the pre-HR period. The monthly average wholesale cheese margins are in the range of 24.7 %–43.7 % of the wholesale cheese prices in this period.
It is important to emphasize that in this research “oligopoly” and “monopoly” pricing is determined solely by the magnitude of cost pass-through. The most critical measure of seller market power would be a price-cost margin (a profitability measure). Wholesale cheese margins analyzed in this research may be thought of as proxies for price-cost margins. Wholesale cheese margins include cheese processing costs and profit of cheese manufacturers.
While the oligopoly and monopoly nature of wholesale cheese pricing characterized by an incomplete CPT does not change in the HR period, as compared with the pre-HR period, wholesale cheese margins decrease in the HR period. The monthly average wholesale cheese margins are in the range of 18.2 %–34.4 % of the wholesale cheese prices in this period. The observed decreases in wholesale cheese margins are likely to reflect decreasing profitability of cheese manufacturers in the HR period. This is because the milk price increases at a higher rate than wholesale cheese prices increase in this period.
The milk price increase observed in the HR period reflects increasing milk production costs and the current effects of the herd retirement program (Bolotova 2023). Because of the incomplete CPT, cheese manufacturers did not pass the entire milk price increase on the buyers of cheese in the HR period. While in the case of five cheese price series, fixed absolute markups (FAM) increased, these increases were not sufficient to help maintain wholesale cheese margins at a level like the one in the pre-HR period. In the case of four cheese price series, FAM decreased in the HR period.
In summary, the observed changes in FAM, CPT, and wholesale cheese margins indicate that seller market power of cheese manufacturers reflecting their ability to maintain the output (cheese) price above their marginal cost (milk price) was likely decreasing in the HR period, as compared to the pre-HR period. Cheese manufacturers absorbed a portion of the milk price increase (which was due to increasing milk production costs and/or herd retirement program), which might have caused their profitability to decrease in the HR period, as compared with the pre-HR period.
While there are shifts from oligopoly to monopoly pricing (characterized by a decrease in CPT) in the case of six analyzed cheese price series and wholesales cheese pricing in the case of remaining three cheese price series remains consistent with monopoly pricing in the post-HR period, as compared with the HR period, wholesale cheese margins continue to decrease in this period. The monthly average wholesale cheese margins are in the range of 7.9 %–25 % of the wholesale cheese prices in this period. The observed decreases in wholesale cheese margins are likely to reflect decreasing profitability of cheese manufacturers in the post-HR period. This is because the milk price kept increasing at a higher rate than wholesale cheese prices did in the post-HR period.
The milk price increase observed in the post-HR period reflects increasing milk production costs and may also reflect delayed effects of the herd retirement program and current effects of the export assistance program (Bolotova 2023). The CPT decreased in the post-HR period, as compared to the HR period, and became more incomplete in the case of all analyzed cheese price series. The observed decrease in CPT may suggest that cheese manufacturers did not pass the entire milk price increase on the buyers of cheese in the post-HR period. Furthermore, as compared to the HR period, cheese manufacturers passed a smaller portion of the milk price increase on the buyers of cheese in the post-HR period.
To compensate for a decrease in CPT to maintain a viable profitability level, cheese manufactures increased FAM in the case of all analyzed cheese price series in the post-HR period, as compared to the HR period. However, the FAM increase was not sufficient to help maintain wholesale cheese margins at a level like the one in the HR period.
In summary, the observed changes in FAM, CPT, and wholesale cheese margins indicate that seller market power of cheese manufacturers reflecting their ability to maintain the output (cheese) price above their marginal cost (milk price) was likely kept decreasing in the post-HR period, as compared to the HR period. Cheese manufacturers absorbed a portion of the milk price increase (which was due to increasing milk production costs and/or herd retirement program), which caused their profitability to decrease in the post-HR period, as compared with the HR period.
Presuming that they had a Capper-Volstead Act immunity, the CWT cooperatives acted in a cartel-like manner to decrease milk supply to increase and stabilize milk prices received by dairy farmers. The herd retirement program may have allowed dairy farmers to modestly increase their seller market power to receive higher milk prices and improve their returns (Bolotova 2023). In contrast, seller market power of dairy cooperatives involved in cheese manufacturing decreased during the HR and post-HR periods. This is because the cost of milk used in cheese manufacturing increased at a higher rate than wholesale cheese prices, which caused wholesale cheese margins, and consequently the profitability of cheese manufacturing, to decrease.
The behavior of wholesale cheese prices, milk price, and wholesale cheese margins evaluated in this research may reflect the effects of factors other than the herd retirement program. First, milk production costs increased during the analyzed periods (Bolotova 2023), which contributed to increasing milk prices that cheese manufacturers paid, their wholesale cheese prices, and consequently to decreasing wholesale cheese margins. Second, changes in the demand for cheese at the retail level and buyer market power of food retailers may have affected the behavior of wholesale cheese prices that food retailers pay to cheese manufacturers.
Third, the CWT export assistance program (2003-present) that provides subsidies on the export of cheese and other manufactured dairy products to the participating dairy cooperatives decreased the quantity of cheese available for the domestic market and consequently contributed to higher wholesale cheese prices in the domestic market in the HR and post-HR periods. Table A2 presented in Appendix 3 summarizes data on American cheese supply and use for the period of 2000–2014. For example, the export of American cheese increases by 117 % in the HR period, compared with the pre-HR period, and this export further increases by 212 % in the post-HR period, as compared with the HR period.
Fourth, changing cheese processing and marketing costs that cheese manufacturers incur may have affected the behavior of wholesale cheese margins. Finally, the herd retirement program may have had a delayed effect on both the milk price and wholesale cheese prices during the post-HR period. The herd retirement program’s delayed effects may have lasted 3–5 years after each round (Brown et al. 2010). Given that the last round took place in 2010, the herd retirement program may have affected milk prices and cheese prices during the period of 2011–2015.
7 Competition (Antitrust) Issues
The CWT dairy cooperatives presumed that their herd retirement program was within the scope of the Capper-Volstead Act immunity. Section 1 of the Capper-Volstead Act provides a limited antitrust immunity for collective agricultural marketing activities to Section 1 of the Sherman Antitrust Act. Section 1 of the Capper-Volstead Act declares:
Persons engaged in the production of agricultural products as farmers, planters, ranchmen, dairymen, nut or fruit growers may act together in associations, corporate or otherwise, with or without capital stock, in collectively processing, preparing for market, handling, and marketing in interstate and foreign commerce, such products of persons so engaged. Such associations may have marketing agencies in common; and such associations and their members may make the necessary contracts and agreements to effect such purposes: Provided, however, That such associations are operated for the mutual benefit of the members thereof …
Absent the Capper-Volstead Act, collective agricultural marketing activities of individual agricultural producers implemented through their organizations would have violated Section 1 of the Sherman Act, which declares illegal contracts, conspiracies, and combinations in restraint of trade in interstate commerce. Price-fixing and output limitation agreements among competitors are examples of the most common restraints of trade violating Section 1 of the Sherman Act (Hovenkamp 2005). Price-fixing agreements aim to increase, decrease, or fix (stabilize) product prices, and can be verbal, written, or inferred from the conduct of firms (Federal Trade Commission 2023).
In 2015, buyers of raw farm milk, cheese, and butter, who purchased these products directly from CWT dairy cooperatives, filed a class action antitrust lawsuit alleging that the CWT herd retirement program was not within the scope of the Capper-Volstead Act immunity because it was not a form of collective agricultural marketing. The organizations of agricultural producers in the potato, egg and mushroom industries in the U.S. also implemented agricultural supply management programs affecting quantities of agricultural products produced and faced similar antitrust lawsuits (Bolotova 2014, 2015; Peck 2015). Apparently, there was a very limited case law interpreting legal status of agricultural supply management programs in light of Section 1 of the Capper-Volstead Act.
In December 2011, a U.S. district court for the first time in history of the Capper-Volstead Act evaluated legal status of agricultural production restrictions in a lawsuit against a group of cooperatives of potato growers and individual potato growers (In Re: Fresh and Process Potatoes Antitrust Litigation 2011). After conducting a comprehensive analysis, in its advisory opinion the court stated that “acreage reductions, production restrictions, and collusive crop planning are not activities protected by the Capper-Volstead Act.”
One of the main arguments of the defendants (potato cooperatives) in this antitrust litigation was that if the Capper-Volstead Act cooperatives were allowed to fix prices, they should be allowed to restrict production. The existing case law has established that price-fixing activities of agricultural cooperatives are generally within the scope of Capper-Volstead Act immunity because “price-fixing” is a form of pricing activities, which are essential elements of “marketing” mentioned in Section 1 of the Capper-Volstead Act. This argument did not persuade the court, which responded that “Individual freedom to produce more in times of high prices is a quintessential safeguard against Capper-Volstead Act abuse, which Congress recognized in enacting the statute.”
Recent legal discussions establish that the types of agricultural supply management programs, whether they are implemented at the pre-agricultural production stage, agricultural production stage, or post-agricultural production stage, affect their legal status in light of the Capper-Volstead Act (Bolotova 2015; Peck 2015; Frackman and O’Rourke 2011; Hibner 2011). It is crucial whether collective agricultural marketing activities (programs) in question can be interpreted as “marketing” in light of Section 1 of the Capper-Volstead Act. Collective agricultural supply management activities implemented at the post-agricultural production stage are more likely to be interpreted as “marketing” and therefore are likely to be within the scope of Capper-Volstead Act immunity. Collective agricultural supply management activities implemented at the pre-agricultural production and agricultural production stages are not likely to be interpreted as “marketing” and therefore are outside the scope of Capper-Volstead Act immunity. The courts interpret the legal status of collective agricultural marketing activities on a case-by-case basis.
If in the future the U.S. dairy industry is to consider implementing a supply management program affecting quantities of raw milk produced at the farm level, this program should be designed as a public program under the Agricultural Marketing Agreement Act (1937) with the participation of the U.S. Department of Agriculture. The U.S. dairy industry implemented two public voluntary supply management programs in the 1980s: Milk Diversion Program and Dairy Termination Program (Brown et al. 2010). The U.S. Congress authorized these programs, and they were funded through the dairy producer assessments and government funds.
U.S. Dairy Industry: Economic Effects of the Herd Retirement Program (HRP), 2003–2010.
| Year | Milk cow inventorya | Cows removed due to HRPb | Milk quantity per cowa | Total milk quantitya | Milk quantity removed due to HRPb | Milk pricea | Milk price increase due to HRPb,c | Milk revenuea | Milk revenue increase due to HRPc | |
|---|---|---|---|---|---|---|---|---|---|---|
| number of cows | pounds per cow | billion pounds | $ per cwt | $ per cwt | % of milk price | $ billion | ||||
| 2003 | 9,141,700 | 32,724 | 18,759 | 170.3 | 0.609 | 12.55 | 0.05 | 0.4 | 21.38 | 0.09 |
| 2004 | 8,987,500 | 50,478 | 18,960 | 170.8 | 0.908 | 16.13 | 0.16 | 1.0 | 27.56 | 0.27 |
| 2005 | 9,003,500 | 64,069 | 19,550 | 176.9 | 1.174 | 15.19 | 0.44 | 2.9 | 26.88 | 0.78 |
| 2006 | 9,103,900 | N/Ad | 19,895 | 181.8 | 0.000 | 12.96 | 0.55 | 4.2 | 23.56 | 1.00 |
| 2007 | 9,144,500 | 52,783 | 20,204 | 185.7 | 1.001 | 19.21 | 0.62 | 3.2 | 35.66 | 1.15 |
| 2008 | 9,257,000 | 75,215 | 20,397 | 190.0 | 1.408 | 18.45 | 0.57 | 3.1 | 35.05 | 1.08 |
| 2009 | 9,332,800 | 200,493 | 20,561 | 189.2 | 3.988 | 12.93 | N/A | N/A | N/A | N/A |
| 2010 | 9,086,500 | 31,159 | 21,142 | 192.9 | 0.584 | 16.35 | N/A | N/A | N/A | N/A |
| Total | 73,057,400 | 506,921 | 159,468 | 1457.6 | 9.672 | |||||
-
aMilk cow inventory, milk quantity per cow, total milk quantity, milk price, and milk revenue are collected by the author from the U.S. Department of Agriculture, National Agricultural Statistics Service (2021). bNumber of cows and milk quantities removed due to HRP and milk price increases ($ per cwt) due to HRP are from the power-point slides developed by Professor Brown that are included in the complaint filed by buyers of cheese and butter (First Impressions Salon, Inc., et al. v. National Milk Producers Federation, et al. 2015). cMilk price increase (% of the milk price) and milk revenue increase due to HRP are calculated by the author. dN/A is “not available.”
2.1 Cost Pass-Through in a Perfectly Competitive Industry
The profit-maximization problem for a perfectly competitive industry is to maximize Total Profit (TP) with respect to the output quantity (Q).
where TR, TC, and P are Total Revenue, Total Costs, and the output price, respectively.
The output price is an exogenous variable (constant).
The profit-maximizing First-Order Condition is:
where P is the output price and at the same time Marginal Revenue, and MC is Marginal Cost.
The cost pass-through for a perfectly competitive industry is:
Interpretation: A $1 per unit increase (decrease) in the marginal cost (input price) causes the output price to increase (decrease) by $1 per unit.
2.2 Cost Pass-Through for Monopoly Operating in Market with Linear Demand and Constant Marginal Cost
The profit-maximization problem for monopoly is to maximize Total Profit (TP) with respect to the output quantity (Q).
where TR, TC, and P are Total Revenue, Total Costs and the output price, respectively.
The output price is a function of output quantity due to the inverse (price-dependent) demand function: P = a − bQ.
The profit-maximizing First-Order Condition is:
where [a − 2bQ] is Marginal Revenue, and MC is Marginal Cost.
Next, substitute the output quantity maximizing profit in the inverse demand equation to determine the output price maximizing profit.
The cost pass-through for monopoly in market with linear demand and constant marginal cost is:
Interpretation: A $1 per unit increase (decrease) in the marginal cost (input price) causes the output price to increase (decrease) by $0.50 per unit.
U.S. Dairy Industry: American Cheese Supply and Use (2000–2014).
| Production | Total supply | Export | Availability | ||
|---|---|---|---|---|---|
| Total | Per capita | ||||
| --- million pounds --- | --- pounds --- | ||||
| Pre-herd retirement program period (pre-HR period: 2000–2003) | |||||
| Average | 3624.6 | 4174.0 | 27.6 | 3646.9 | 12.7 |
| Herd retirement program period (HR period: 2004–2010) | |||||
| Average | 3991.0 | 4562.1 | 59.8 | 3931.4 | 13.0 |
| % Change in HR period, relative to pre-HR period | |||||
| Average | 10.1 | 9.3 | 116.9 | 7.8 | 2.4 |
| Post-herd retirement program period (post-HR period: 2011–2014) | |||||
| Average | 4397.4 | 5041.4 | 186.5 | 4202.8 | 13.3 |
| % Change in post-HR period, relative to HR period | |||||
| Average | 10.2 | 10.5 | 212.0 | 6.9 | 2.3 |
-
Data Source: U.S. Department of Agriculture, Economic Research Service (2021).
References
Bolotova, Y. 2023. ““Market Power in the U.S. Dairy Industry” (Case Study). 2023.” Applied Economics Teaching Resources 5: 62–84.Search in Google Scholar
Bolotova, Y. 2022. “Price Discovery in the United States Dairy Industry.” Journal of Agricultural and Food Industrial Organization 20 (2): 83–97. https://doi.org/10.1515/jafio-2019-0002.Search in Google Scholar
Bolotova, Y. 2020. “The Price Effects of Milk Supply Control in the U.S. Dairy Industry.” Selected Paper, presented at Annual (Virtual) Meeting of Agricultural and Applied Economics Association; August 10–11. Also available at https://ageconsearch.umn.edu/record/304209?ln=en.Search in Google Scholar
Bolotova, Y. 2016. “Agricultural Supply Management and Market Power: Evidence from the U.S. Dairy and Potato Industries.” Agribusiness: An International Journal 32: 563–8. https://doi.org/10.1002/agr.21485.Search in Google Scholar
Bolotova, Y. 2015. “Agricultural Supply Control: Lessons from the U.S. Dairy and Potato Industries.” Choices 4th quarter.10.1002/agr.21485Search in Google Scholar
Bolotova, Y., and A.M. Novakovic. 2015. “An Empirical Analysis of Wholesale Cheese Pricing Practices on the Chicago Mercantile Exchange (CME) Spot Cheese Market.” International Food and Agribusiness Management Review 18: 49–66.Search in Google Scholar
Bolotova, Y. 2014. “Agricultural Supply Management and Antitrust in the United States System of Agribusiness.” International Food and Agribusiness Management Review 17: 53–76.Search in Google Scholar
Bolotova, Y., and A.M. Novakovic. 2012. “The Impact of the New York State Milk Price Gouging Law on the Price Transmission Process and Supermarket Pricing Strategies in the Fluid Whole Milk Market.” Agribusiness: An International Journal 28: 377–99. https://doi.org/10.1002/agr.21304.Search in Google Scholar
Bolotova, Y. 2009. “Cartel Overcharges: An Empirical Analysis.” Journal of Economic Behavior and Organization 70: 321–41. https://doi.org/10.1016/j.jebo.2009.02.002.Search in Google Scholar
Brown, S., B. Cropp, B.W. Gould, and E. Jesse. 2010. Dairy Policy Issues for the 2012 Farm Bill. Dairy Policy Analysis Alliance. Food and Agricultural Policy Research Institute (FAPRI), University of Missouri-Columbia, and the Department of Agricultural and Applied Economics, University of Wisconsin-Madison. Also available at http://www.iatp.org/files/258_2_107651.pdf.Search in Google Scholar
Butter and Cheese Class Action. 2021. Also available at https://www.butterandcheeseclassaction.com/.Search in Google Scholar
Carlton, D.W., and J.M. Perloff. 2004. Modern Industrial Organization. Boston, San Francisco, New York, London: Pearson.Search in Google Scholar
Carman, H.F., and R.J. Sexton. 2005. “Supermarket Fluid Milk Pricing Practices in the Western United States.” Agribusiness 21: 509–30. https://doi.org/10.1002/agr.20062.Search in Google Scholar
Cooperatives Working Together. 2023. Also available at http://www.cwt.coop/.Search in Google Scholar
Cotterill, R.W. 1998. Estimation of Cost Pass Through to Michigan Consumers in the ADM Price Fixing Case. Research Report No. 39. Storrs: University of Connecticut, Food Marketing Policy Center. Also available at http://ageconsearch.umn.edu/bitstream/25148/1/rr980039.pdf.Search in Google Scholar
Cotterill, R., L. Egan, and W. Buckhold. 2001. “Beyond Illinois Brick: The Law and Economics of Cost Pass-Through in the ADM Price Fixing Case.” Review of Industrial Organization 18: 45–52. https://doi.org/10.1023/a:1026570012375.10.1023/A:1026570012375Search in Google Scholar
First Impressions Salon, Inc., et al. v. National Milk Producers Federation, et al., Case No. 3:13-CV-00454-NJR-GCS. 2015. Third Amended Consolidated Complaint filed on 09/11/2015. Also available at https://www.butterandcheeseclassaction.com/Content/Documents/Complaint.pdf.Search in Google Scholar
Federal Trade Commission. 2023. Price-fixing. Also available at https://www.ftc.gov/advice-guidance/competition-guidance/guide-antitrust-laws/dealings-competitors/price-fixing.Search in Google Scholar
Frackman, A.J., and K.R. O’Rourke. 2011. The Capper-Volstead Act Exemption and Supply Restraints in Agricultural Antitrust Actions. Presentation to New York State Bar Association. New York: Antitrust Section Executive Committee, February 16. Also available at http://www.nysba.org/Sections/Antitrust_Law/Resources/Resource_PDFs/Capper_Volstead_Act_presentation.html.Search in Google Scholar
Fu, J. 2019. Milk Co-ops Slaughtered 500,000 Cows via a “Retirement” Program. Now They’ll Pay $220 Million in a Price-Fixing Lawsuit. THE NEW FOOD ECONOMY, December 05. Also available at https://newfoodeconomy.org/dairy-cooperatives-herd-retirement-cow-slaughter-antitrust-price-fixing-retailer-lawsuit-settlement/.Search in Google Scholar
George, P.S., and G.A. King. 1971. Consumer Demand for Food Commodities in the United States, with Projections for 1980. Giannini Foundation Monograph No. 26. Davis: University of California, Davis, Department of Agricultural and Resource Economics. Also available at http://ageconsearch.umn.edu/handle/11936.Search in Google Scholar
Gould, B.W. 2010. “Consolidation and Concentration in the U.S. Dairy Industry.” Choice 25.Search in Google Scholar
Harris, R.G, and L.A. Sullivan. 1979. “Passing on the Monopoly Overcharge: A Comprehensive Policy Analysis.” University of Pennsylvania Law Review 128: 269–360. https://doi.org/10.2307/3311655.Search in Google Scholar
Hibner, D.T. 2011. Allegations of Conspiracy to Limit Crop Production: Ripe for Analysis under Capper-Volstead. Martindale Legal Library, December 29. Also available at http://www.martindale.com/antitrust-trade-regulation-law/article_Sheppard-Mullin-Richter-Hampton-LLP_1400560.htm.Search in Google Scholar
Hovenkamp, H. 2005. Federal Antitrust Policy the Law of Competition and its Practice, 3rd ed. St. Paul: Thomson West.Search in Google Scholar
In Re: Fresh and Process Potatoes Antitrust Litigation No. 4:10-MD-2186-BLW (D.Id.). 2011. Also available at https://scholar.google.com/scholar_case?case=3083777526870283711&q=Re:+Fresh+and+Process+Potatoes+Antitrust+Litigation+&hl=en&as_sdt=3,33.Search in Google Scholar
Kosicki, G., and M.B. Cahill. 2006. “Economics of Cost Pass Through and Damages in Indirect Purchaser Antitrust Cases.” The Antitrust Bulletin 51: 599–630.Search in Google Scholar
Ling, K.C. 2011. Cooperative Theory, Practice, and Financing: A Dairy Cooperative Case Study. U.S. Department of Agriculture, Rural Development Research Report 221.Search in Google Scholar
Ling, K.C. 2012. The Nature of the Cooperative: A Dairy Cooperative Case Study. U.S. Department of Agriculture, Rural Development Research Report 224.Search in Google Scholar
Ling, K.C. 2014. Market Operations of Dairy Cooperatives, 2012. U.S. Department of Agriculture, Rural Development Research Report 230.Search in Google Scholar
Mueller, W.F., B.W. Marion, M.H. Sial, and F.E. Geithman. 1996. Cheese Pricing: A Study of the National Cheese Exchange. A Report of the Food System Research Group, Department of Agricultural Economics, University of Wisconsin-Madison prepared for the Wisconsin Department of Agriculture, Trade and Consumer Protection Investigation into Cheese Pricing. Also available at https://www.researchgate.net/publication/262698134_Cheese_Pricing_A_Study_of_National_Cheese_Exchange.Search in Google Scholar
Oxera Agenda. 2007. Passing the Buck: The Passing-On Defense in Cartel Damages Cases. Also available at https://www.oxera.com/wp-content/uploads/2018/03/Cartel-damages-claims-3.pdf.Search in Google Scholar
Peck, A. 2015. “The Cost of Cutting Agricultural Output: Interpreting the Capper-Volstead Act.” Missouri Law Review 80: 451–98.Search in Google Scholar
RBB Economics. 2014. Cost Pass-Through: Theory, Measurement, and Potential Policy Implications. A Report Prepared for the Office of Fair Trading (U.K.). Also available at https://assets.publishing.service.gov.uk/government/uploads/system/uploads/attachment_data/file/320912/Cost_Pass-Through_Report.pdf.Search in Google Scholar
Saitone, T.L., and R.J. Sexton. 2009. “Supply Management for the U.S. Dairy Industry? Opportunities and Challenges.” ARE Update 13 (1): 5–8.Search in Google Scholar
Shields, D.A. 2010. Consolidation and Concentration in the U.S. Dairy Industry. Congressional Research Service Report R41224.Search in Google Scholar
Siebert, J., and C. Lyford. 2009. “U.S. Dairy Industry Supply Control: Managing the Cooperatives Working Together Program.” Review of Agricultural Economics 31: 999–1013. https://doi.org/10.1111/j.1467-9353.2009.01476.x.Search in Google Scholar
Stigler, G.J. 1964. “A Theory of Oligopoly.” The Journal of Political Economy 72: 44–61. https://doi.org/10.1086/258853.Search in Google Scholar
U.S. Department of Agriculture, Agricultural Marketing Service. 2021a. Dairy Market News Portal. Also available at https://www.marketnews.usda.gov/mnp/da-report-config.Search in Google Scholar
U.S. Department of Agriculture, Agricultural Marketing Service. 2021b. Dairy Public Database. Also available at https://www.ams.usda.gov/resources/marketing-order-statistics.Search in Google Scholar
U.S. Department of Agriculture, Economic Research Service. 2021. Food Availability (Per Capita) Data System. Also available at https://www.ers.usda.gov/data-products/food-availability-per-capita-data-system/.Search in Google Scholar
U.S. Department of Agriculture, National Agricultural Statistics Service. 2021. Quick Stats Database. Also available at https://quickstats.nass.usda.gov/.Search in Google Scholar
U.S. Department of Agriculture, Rural Development. 2019. Marketing Operations of Dairy Cooperatives 2017. Research Report 234.Search in Google Scholar
© 2023 the author(s), published by De Gruyter, Berlin/Boston
This work is licensed under the Creative Commons Attribution 4.0 International License.
Articles in the same Issue
- Frontmatter
- Research Articles
- Private Supply Management and Market Power in the U.S. Dairy Industry
- Implementing Antitrust Regulations in Dynamic Industries: The Case of the U.S. Cottonseed Industry
- Price Hedonics of Beers: Effects of Alcohol Content, Quality Rating, and Production Country
- Olive Oil World Price Forecasting: A Bayesian VAR Approach
- Network Analysis of Price Comovements Among Corn Futures and Cash Prices
- Evaluating Impacts of Subsidy Removal in the Tunisian Bakery Sector
- Mark Ups and Pass-Through in Small and Medium Retailers for Rice, Tomato Sauce and Oil