Utilization of indocynanine green fluorescent imaging (ICG-FI) for the assessment of microperfusion in vascular medicine
-
Anna Duprée
 ,
Henrik Rieß
,
Henrik Rieß

Abstract
Intraoperative valuation of organ and tissue microperfusion is always a current topic in different surgical situations. Although indocyanine green fluorescent imaging (ICG-FI) has turned to be a more and more common technique to evaluate organ perfusion, only few studies tried to quantitatively validate the technique for microperfusion assessment. The aim of the following manuscript is to present the results of our interdisciplinary research confirming additional quantitative assessment tools in different surgical conditions. Thus, we are implementing the background-subtracted peak fluorescent intensity (BSFI), the slope of fluorescence intensity (SFI), and the time to slope (TTS) using ICG-FI in several regions of interest (ROI).
Intraoperative imaging
ICG visualization
Due to its biological characteristics following intravenous injection, indocyanine green (ICG) is a suitable contrast agent for fluorescent imaging (FI) using the near-infrared laser technology [1]. The technology is based on the fluorescence of ICG, a non-toxic, water-soluble fluorescent dye that has been used extensively for >40 years for the examination of liver function, microcirculation, and ophthalmic angiography. The dye immediately binds to plasma proteins and remains intravascular after systemic intravasal injection. Because of its rapid elimination exclusively by the liver (half-life, 2.4 min), repeated injections of ICG are possible. Adverse reactions related to its clinical use are rare, and the side effects other than iodine allergy have not been reported [1], [2]. In plasma, it displays an absorption maximum at 805 nm and an emission maximum at 830 nm [1].
For ICG-FI, the fluorescent dye ICG is intravenously applied through a peripheral venous line (0.01 mg/kg body weight) [3], [4], [5], [6], [7], [8] and the tissue in the region of interest is illuminated with near-infrared light at a wavelength of 785 nm with a total output of 80 mW in a field of view of 10 cm in diameter (1 mW/cm2) operating at a distance of approximately 20 cm above tissue. The fluorescence emission of the excited dye is detected by an infrared-sensitive charge-coupled device (CCD) camera system (dynamic range 54 dB). In our studies, the camera was equipped with a band pass filter for the selective transmission of light at the emission maximum of ICG (830 nm) [9], [10], [11] (Figure 1). The fluorescent cardiac imaging (FCI) images are displayed and recorded in real-time on a computer monitor. In our studies, we used a digital image processing system with a temporal resolution of 40 ms and spatial resolution of about 0.2 mm at a penetration depth of 4 mm for quantitative assessment of tissue perfusion (LLS GmbH, Ulm, Germany) [9].
The laser has an excellent safety profile for both patient and operating stuff. Because of the low power density of the emitted laser energy, there is no tissue warming. Further, eye protection is not required because the laser light energy is dispersed and remitted light has no hazardous potential (I=1 mW/cm2).
Although ICG-FI has turned to be a more and more common technique to evaluate intraoperative organ perfusion, only few studies tried to quantitatively validate the technique for visceral perfusion assessment.
In our studies, we confirmed additional methods for quantitative assessment using ICG-FI [9], [10], [11]:
First, background-subtracted peak fluorescent intensity (BSFI) in the time-dependent fluorescence intensity curves is a useful parameter for quantitative assessment during repeated injections of ICG. By subtraction of residual fluorescent intensity of the previous injection, misinterpretation of false high fluorescence intensities can be avoided. Thus, several injections in short-time intervals can be performed with viable results, while solely visual interpretation would mislead to false high perfusion levels. Nevertheless, capillary leakage must be taken into consideration due to increased fluorescence intensity in the extravascular space.
Second, the maximal slope of fluorescence intensity (SFI) during the increase of the time-dependent fluorescent intensity can be assessed. This allows the quantitative determination of the increase of fluorescent signal in the region of interest (ROI), independent of the background fluorescent signal. Nevertheless, the SFI is dependent on the blood flow and therefore dependent on the cardiac output.
Cardiac surgery
Intraoperative assessment of graft patency and detection of significant coronary artery bypass stenosis is of major importance for optimal early and long-term outcome following coronary artery bypass grafting (CABG).
However, no routine quality control is performed by most cardiac surgeons because the techniques used suffered from time-consuming, unreliable, invasiveness, or lack of visualization.
FCI using the dye ICG is a non-invasive imaging technology for intraoperative visualization of coronary vessels and myocardial perfusion and can detect patency of the bypass graft as well as graft occlusion [3], [4], [5], [6], [7]. Several studies demonstrated that the FCI technique was clinically useful for evaluation of graft patency using a similar ICG-based imaging device (SPY; Novadaq Technologies; Toronto, Canada) for quality control after CABG [3], [4], [5], [6]. Solely visual assessment of non-occlusive graft-flow abnormalities could not be identified reliably [3], [4], [8]. Therefore, additional quantitative assessment of myocardial perfusion by FCI is a useful tool for intraoperative quality control.
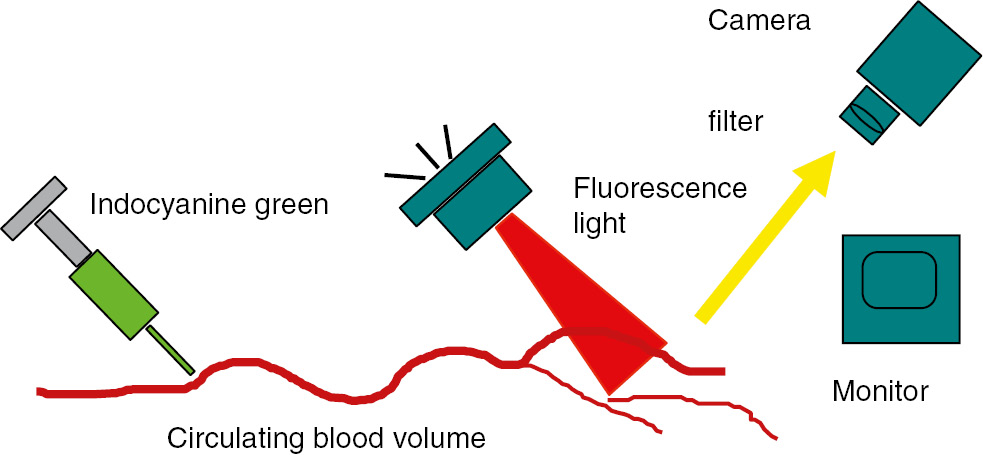
Indocyanine green fluorescent imaging (IDG-FI): After intravenous injection, the region of interest is illuminated with near-infrared light (785 nm).
The fluorescence emission of the excited dye is detected by an infrared-sensitive charge-coupled device camera system (dynamic range 54 dB) equipped with a band pass filter for the selective transmission of light at the emission maximum of ICG (830 nm).
Quantitative assessment of myocardial perfusion during coronary stenosis of variable severity was validated in an experimental setting [9], [10], [11]. For FCI, ICG (0.01 mg/kg body weight) is intravenously applied through a peripheral venous line and the heart is illuminated with near-infrared light at a wavelength of 785 nm with a total output of 80 mW in a field of view of 10 cm in diameter (1 mW/cm2) operating at a distance of 20 cm above the left ventricle. The fluorescence emission of the excited dye was detected by an infrared-sensitive charge-coupled device camera system (dynamic range 54 dB) equipped with a band pass filter for the selective transmission of light at the emission maximum of ICG (830 nm; Figure 2). The FCI images were recorded in real-time and analyzed using a digital image processing system as previously described (LLS GmbH, Ulm, Germany) [9], [10], [11].

Left: experimental setting of ICG-FI.
The tissue in the region of interest is illuminated with near-infrared light at a wavelength of 785 nm with a total output of 80 mW in a field of view of 10 cm in diameter (1 mW/cm2) operating at a distance of approximately 20 cm above tissue. The fluorescence emission of the excited dye is detected by an infrared-sensitive charge-coupled device (CCD) camera system (dynamic range 54 dB). Right: ICG-FI before stenosis (above) and myocardial perfusion during flow-limiting coronary stenosis of high severity (lower).
The experimental study was able to show that quantitative assessment of myocardial perfusion during flow-limiting coronary stenosis of high severity and even during non-flow limiting stenosis is possible by FCI (Figure 2).
Nevertheless, the experimental studies were evaluated under perfectly controlled hemodynamic conditions in open-chest pigs. Direct transfer of the experimental findings into a clinical setting in humans might be limited: rotation of the heart is necessary for proper imaging of the lateral or posterior wall. Changes in hemodynamic parameters such as heart rate, blood pressure, and cardiac output as well as optical parameters like scattering due to overlying fat tissue and movement of the beating heart may influence absolute values. Furthermore, in a clinical setting, competitive coronary flow and collateral flow may affect perfusion measurements, which have to be proved in future studies.
Finally, FCI might be a useful tool for intraoperative quality control during CABG.
Vascular surgery
Peripheral arterial disease (PAD) is a major health problem affecting over 200 million people worldwide [12]. Demographic changes inevitably lead to increasing numbers subsequently requiring an optimal best medical or invasive treatment. As the gold standard Ankle-brachial index (ABI) measurement is certainly the oldest method for diagnosis of PAD and assessment of lower limb macroperfusion [13]. However, its utilization is limited in patients with extensive calcification of the medial vessel layer causing incompressibility of peripheral arteries during measurement leading to falsely elevated pressure values. Other measuring tools, such as toe-pressure brachial index measurements (TBI), photoplethysmography, and transcutaneous oxygen pressure measurements (TcPO2), are used for assessing microperfusion of the foot [14], [15]. However, their application requires sensors or probes being placed on the foot to conduct microperfusion measurements. Hence, usability may be limited in patients with foot ulcers and infected tissue. Furthermore, diabetes mellitus poses a significant risk factor for disturbing the micro-circulation of the lower extremity leading to diabetic foot ulcers with increasing incidence and prevalence that may contribute to increasing numbers of amputations [16]. As described above, ICG-FI serves as a tool for assessing the microperfusion of various tissues without necessary probes that have to be placed on the area of interest. For that purpose, it has been widely used in various medical disciplines over the 30 years with excellent results in terms of validity and reproducibility [9], [17], [18], [19], [20], [21]. Considering the advantages of this technique, it might be surprising that its utilization for the assessment of mirco-circulation in PAD is relatively new. Braun et al. and Colvard et al. successfully tested ICG-FI (SPY system, NOVADAQ, Bonita Springs, USA) as a tool for quality control by evaluating the perfusion of the foot in patients with PAD prior and after a revascularization procedure [22], [23]. Quantitative evaluation of data was performed via the SPY software-package assessing time-intensity curves of fluorescent intensity by ingress, ingress rate, egress, and egress rate. Results were successfully correlated to ABI and Toe-pressure measurements (TP). Igari et al. correlated results of pre- and postoperative ICG-FI to ABI, TBI, and TP [24]. They were the first in assessing different regions of interest (ROIs) of the foot and described “time from ICG onset to maximum intensity” (Tmax), time elapsed from fluorescence onset to half the maximum intensity” (T1/2) and “fluorescence intensity measured 10 seconds after the onset of fluorescence” (PDE10) as new parameters used for the assessment of curves obtained from ICG-FI. They found Tmax and T1/2 more significantly correlated with ABI, TBI, and TP [24]. In another study, Venermo et al. showed repeatability of time-intensity curves obtained from ICG-FI using T1/2 and PDE10 in patients undergoing a revascularization procedure. Interestingly a strong correlation of TcPO2 and PDE10 for diabetic patients was observed [25]. Although the process of ICG-FI measurements of the foot may vary between the different studies, the main principle stays the same. Our protocol and setting for ICG-FI measurements can be obtained from Table 1 and Figure 3. In a recently published study, we introduced a new way of assessing time-intensity curves obtained from ICG-FI in patients that underwent open-surgical revascularization procedure for PAD [26]. Time-intensity curves were analyzed offline using our own software package (Institute for Laser Technology, University Ulm, GmbH) that enables manually fitting the slope of fluorescence intensity (SFI) to the maximum incline of the curve (Figure 4) [26]. Since results obtained from maximum fluorescent intensity measurements, which are analyzed by many previous studies, can be influenced by skin color, light in the room, distance to the camera, peripheral edema, and previous injections of ICG causing a residual fluorescent signal may in our opinion over or underestimate perfusion. We successfully correlated results to perfusion measurements obtained from ABI and photoplethysmography and thereby proved the practical feasibility of this new technique of analyzing data [26]. ICG-FI can be utilized for various purposes in vascular medicine. Rother et al. recently used ICG-FI for assessing indirect and direct revascularized angiosomes after tibial bypass surgery [27]. Lepow et al. showed first attempts in using the ICG-FI to visually assess a chronic diabetic ulcer and intraoperatively evaluated wound margins during debridement in the operating room [28]. They concluded that ICG-FI may serve as a tool for predicting wound healing and help in determining resection margins during surgical treatment of chronic wounds. Figure 5 presents a patient suffering from microembolization of digitus I of the left foot, which was caused by atrial fibrillation without sufficient anticoagulation (Figure 5). Visual assessment of the bare foot and the image obtained from ICG-FI consistently proved full recovery after medical treatment with heparin and Alprostadil (Prostavasin) for 10 days.
Protocol for ICG-FI measurement.
| Clear the patient of contraindications for ICGA |
| Eliminate all light sources and remove any clothes or wound dressings |
| Wait for 15 min and measure systolic blood pressure |
| Position the camera head perpendicular to the plantar region of the foot with the help of two overlapping laser beams |
| Administer a bolus of dissolved indocyanine green at a dose of 0.1 mg/kg and immediately inject 10 mL normal saline to flush intravenous line |
| Initiate capturing for a sequence of 272 s without moving the camera |

Setting for ICG-FI measurements.
The camera is positioned perpendicular to area of interest. ICG-FI is captured when all light sources are removed.

Green time-intensity curve corresponding to preoperative ICG-FI measurement.
Purple time-intensity curve corresponding to postoperative ICG-FI measurement. Yellow line (linear regression trendline) corresponding to SFI manually fitted to the maximum incline of the curves. Reprinted from Publication Vasa, 46/5, H. C. Rieß et al., A new tool for fluorescent imaging, pp. 383–388. Copyright Hogrefe Publishing Corp. Reproduced with permission.

Microembolization of digitus I of the left foot.
Before (left side) and after 10 days of treatment with Heparin and Alprostadil (Prostavasin).
Visceral surgery
Intestinal microperfusion and viability of intestinal organs is usually estimated from the color of serosal surface, presence of peristalsis, pulsation, and bleeding from marginal arteries. However, clinical assessment remains subjective and still depends on the personal experience of the surgeon [29]. ICG-FI is getting more and more common to evaluate tissue perfusion because of its impact in anastomotic healing [30], [31], [32]. However, the method still remains subjective caused by solely visual interpretation of fluorescence intensity as a parameter of perfusion. Our study group recently evaluated the role of FI for quantitative assessment of intestinal perfusion first in a gastric tube model as a one-vessel model and second in an experimental setting of mesenteric ischemia.
Although numerous objective quantitative techniques of intraoperative bowel viability assessment are available, fluorescence based methods seem to be most promising [29], [33]. Several studies describe clinical use of ICG-FI in esophageal [32], [34], [35], [36], [37] and colorectal surgery [31], [38], [39], [40], [41], [42], [43], [44], [45], [46].
Zehetner et al. concluded in their study on 150 patients undergoing esophagectomy, that intraoperative real-time assessment of perfusion correlated with the likelihood of an anastomotic leak and confirmed the critical relationship between good perfusion and anastomotic healing [35]. Same observation has been recently published by Karampinis et al. presenting the results in 55 patients [32]. However, only visual and no quantitative assessment of the ICG-FI data was performed.
Toens et al. conducted an experimental study on mesenteric ischemia in a rabbit model comparing ICG-FI to radioactive microspheres. Validation of ICG-FI was performed by the increment of fluorescence in the ischemic ROIs compared to a control loop as reference region. ICG-FI was concluded to be a feasible, reliable, and valid technique for mesenterial blood flow assessment [47].
Diana et al. showed in a porcine study the real-time assessment of intestinal viability using ICG-FI. Quantitative assessment of ICG-FI was reached by calculating the time to peak in ischemic and non-ischemic areas of the bowel. They concluded that ICG-FI perfusion assessment may effectively detect bowel perfusion [33]. They concluded in a following study that 25% less perfusion certainly impairs anastomotic healing without generating surgical complications [48].
In our studies (manuscript under submission), ICG-FI correlated perfectly with the predicted perfusion changes using the explained evaluation tool SFI, BSFI, and TTS. In our one-vessel model, we found a strong correlation between our evaluation technique, and the fluorescent microspheres as the gold standard in experimental perfusion assessment.
The aim of our second study was to establish and validate our quantitative assessment tools for intraoperative perfusion measurement in ischemic and post-ischemic bowel (Figure 6). Acute mesenteric ischemia remains a highly morbid condition with poor outcome [49]. It is mandatory to confirm diagnosis, assess bowel viability, perform revascularization if useful, and resect non-viable bowel as early as possible. Evaluation of bowel vitality is still subjective, and may lead to resection of segments that potentially can recover [49]. Thus, objective non-invasive methods to assess intestine viability are needed to determine correctly the extent of ischemia and to evaluate anastomosis in several visceral procedures.
The use of ICG-FI in evaluation of ischemic bowel has been described in small case series so far [46], [50], [51], [52]. All authors conclude that ICG-FI is easy to handle and little time-consuming even in emergency situations [46]. Some changed their intraoperative decision after assessing bowel perfusion via ICG-FI, still with the limitation of only subjective visual evaluation [46], [52]. Behrendt et al. investigated bowel perfusion after simple manual manipulation using ICG-FI in a rat model using a perfusion index between region of interest and AMS as reference region. They proved the system capable on quantifying gastrointestinal transit and bowel perfusion [53].
Matsui et al. performed similar experiments in a porcine model combined with a survivor study in rats. He used 30 min of ischemia to induce ischemia in 2–12 cm of bowel. ICG-FI was quantified by absolute fluorescence intensity and contrast-to-background ratio. They assumed that clinical assessment alone had high sensitivity, but relatively low specificity, and therefore accuracy remained low in predicting animal survival. Surprisingly, the quantitative metrics like maximum fluorescence intensity to control were only marginally better than clinical assessment [54].
Our study evaluated the use of ICG-FI in the assessment of bowel viability after different ischemic periods in a porcine model. In contrast to existing studies, ischemic period was adjusted to realistic clinical setting. ICG-FI showed significant difference in tissue viability comparing 6 and 10 h of ischemia. While macroscopic damage of bowel tissue after 10 h of ischemia was obvious even by solely visual inspection, detection of tissue damage after 6 h of ischemia remained difficult. Thus, quantitative ICG-FI can predict tissue damage even if qualitative macroscopic evaluation fails (Figure 5).
In connection with this work, we observed two major points, which affect the interpretation of the ICG-FI technique in daily life visceral surgery.

Induced mesenteric ischemia in a porcine model on the left.
On the right side, the corresponding ICG-FI picture with total loss of fluorescence in the left loop.
Hyper intensity due to capillary leakage and thus the pooling of ICG in the tissue may lead to misinterpretation. In the case of visual assessment alone, there is a risk that previously damaged areas will be assessed as adequately perfused because of the ongoing fluorescence of the tissue. Normally, this pooling fluorescence lasts longer due to the loss of epithelial integrity. A well-perfused tissue shows a quickly influx of ICG, and a slower, but visible, outflow.
Hemodynamic alterations during operation or in between the patients causes different ICG-FI. In our studies we observed that higher cardiac causes elevated ICG-FI levels. Hemodynamics, such as cardiac output, blood pressure, and vascular resistance, volume load, and catecholamine substitution can influence ICG-FI results. In the clinical setting, those parameters have to be taken into consideration for valid measurement. If a stable setting is not possible, either a ratio to a baseline value, or comparison to a non-ischemic area during the same measurement is mandatory. So far, this important influencing factor seems to be underestimated in the literature.
SFI and BSFI measurements are valid quantitative assessment tools using ICG-FI for intraoperative quality evaluation of tissue perfusion. The translation to clinical use is therefore much easier and will be performed in the future. First observational studies in humans are mandatory to evaluate predictive value of ICG-FI assessment.
Conclusion
ICG-FI is a promising tool for intraoperative evaluation of microperfusion in different interdisciplinary settings. As discussed above solely, visual assessment might be misleading; therefore, quantitative determination of microperfusion should be implemented into every days clinical evaluation. Thus, in vascular surgery, ICG-FI can be successfully used for perioperative quality control and postoperative follow-up. In cardiac and visceral surgery, ICG-FI is useful intraoperative assessment tool to evaluate tissue perfusion after ischemia and anastomotic sides enabling immediate revision or decision making. Further clinical studies are needed to prove the findings and integrate the technique into daily routine.
Author Statement
Research funding: Authors state no funding involved. Conflict of interest: Authors state no conflict of interest. Informed consent: Informed consent has been obtained from all individuals included into the reported studies. Ethical approval: All experiments were performed in compliance with the Institutional Review Board for the care of animals in accordance with the National Institutes of Health guidelines for ethical animal research. Also the research results in the reported studies related to human use complied with all the relevant national regulations and institutional policies.
Author Contributions
Anna Duprée: conceptualization; investigation; writing – original draft; writing – review and editing. Henrik Rieß: conceptualization; data curation; writing – original draft. Christian Detter: conceptualization; writing – review and editing. Eike Sebastian Debus: conceptualization; writing – review and editing. Sabine Helena Wipper: conceptualization; data curation; investigation; methodology; writing – original draft; writing – review and editing.
Publication Funding
The German Society of Surgery funded the article processing charges of this article.
References
[1] Cherrick GR, Stein SW, Leevy CM, Davidson CS. Indocyanine green: observations on its physical properties, plasma decay, and hepatic extraction. J Clin Invest 1960;39:592–600.10.1172/JCI104072Search in Google Scholar PubMed
[2] Hope-Ross M, Yannuzzi LA, Gragoudas ES, Guyer DR, Slakter JS, Sorenson JA, et al. Adverse reactions due to indocyanine green. Ophthalmology 1994;101:529–33.10.1016/S0161-6420(94)31303-0Search in Google Scholar PubMed
[3] Reuthebuch O, Haussler A, Genoni M, Tavakoli R, Odavic D, Kadner A, et al. Novadaq SPY: intraoperative quality assessment in off-pump coronary artery bypass grafting. Chest 2004;125:418–24.10.1378/chest.125.2.418Search in Google Scholar PubMed
[4] Taggart DP, Choudhary B, Anastasiadis K, Abu-Omar Y, Balacumaraswami L, Pigott DW. Preliminary experience with a novel intraoperative fluorescence imaging technique to evaluate the patency of bypass grafts in total arterial revascularization. Ann Thorac Surg 2003;75:870–3.10.1016/S0003-4975(02)04669-6Search in Google Scholar PubMed
[5] Desai ND, Miwa S, Kodama D, Cohen G, Christakis GT, Goldman BS, et al. Improving the quality of coronary bypass surgery with intraoperative angiography: validation of a new technique. J Am Coll Cardiol 2005;46:1521–5.10.1016/j.jacc.2005.05.081Search in Google Scholar PubMed
[6] Desai ND, Miwa S, Kodama D, Koyama T, Cohen G, Pelletier MP, et al. A randomized comparison of intraoperative indocyanine green angiography and transit-time flow measurement to detect technical errors in coronary bypass grafts. J Thorac Cardiovasc Surg 2006;132:585–94.10.1016/j.jtcvs.2005.09.061Search in Google Scholar PubMed
[7] Detter C, Russ D, Iffland A, Wipper S, Schurr MO, Reichenspurner H, et al. Near-infrared fluorescence coronary angiography: a new noninvasive technology for intraoperative graft patency control. Heart Surg Forum 2002;5:364–9.Search in Google Scholar PubMed
[8] Balacumaraswami L, Abu-Omar Y, Choudhary B, Pigott D, Taggart DP. A comparison of transit-time flowmetry and intraoperative fluorescence imaging for assessing coronary artery bypass graft patency. J Thorac Cardiovasc Surg 2005;130:315–20.10.1016/j.jtcvs.2004.11.033Search in Google Scholar PubMed
[9] Detter C, Wipper S, Russ D, Iffland A, Burdorf L, Thein E, et al. Fluorescent cardiac imaging: a novel intraoperative method for quantitative assessment of myocardial perfusion during graded coronary artery stenosis. Circulation 2007;116:1007–14.10.1161/CIRCULATIONAHA.106.655936Search in Google Scholar PubMed
[10] Wipper S, Reiter B, Russ D, Hahnel F, Kersten JF, Kolbel T, et al. Distinction of non-ischemia inducing versus ischemia inducing coronary stenosis by fluorescent cardiac imaging. Int J Cardiovasc Imaging 2016;32:363–71.10.1007/s10554-015-0767-ySearch in Google Scholar PubMed
[11] Detter C, Russ D, Kersten JF, Reichenspurner H, Wipper S. Qualitative angiographic and quantitative myocardial perfusion assessment using fluorescent cardiac imaging during graded coronary artery bypass stenosis. Int J Cardiovasc Imaging 2018;34:159–67.10.1007/s10554-017-1212-1Search in Google Scholar PubMed
[12] Fowkes FG, Rudan D, Rudan I, Aboyans V, Denenberg JO, McDermott MM, et al. Comparison of global estimates of prevalence and risk factors for peripheral artery disease in 2000 and 2010: a systematic review and analysis. Lancet 2013;382:1329–40.10.1016/S0140-6736(13)61249-0Search in Google Scholar PubMed
[13] Aboyans V, Criqui MH, Abraham P, Allison MA, Creager MA, Diehm C, et al. Measurement and interpretation of the ankle-brachial index: a scientific statement from the American Heart Association. Circulation 2012;126:2890–909.10.1161/CIR.0b013e318276fbcbSearch in Google Scholar PubMed
[14] Allen J. Photoplethysmography and its application in clinical physiological measurement. Physiol Meas 2007;28:R1–39.10.1088/0967-3334/28/3/R01Search in Google Scholar PubMed
[15] Lusiani L, Visona A, Nicolin P, Papesso B, Pagnan A. Transcutaneous oxygen tension (TcPO2) measurement as a diagnostic tool in patients with peripheral vascular disease. Angiology 1988;39:873–80.10.1177/000331978803901004Search in Google Scholar PubMed
[16] Sharma M, Nazareth I, Petersen I. Trends in incidence, prevalence and prescribing in type 2 diabetes mellitus between 2000 and 2013 in primary care: a retrospective cohort study. BMJ Open 2016;6:e010210.10.1136/bmjopen-2015-010210Search in Google Scholar PubMed PubMed Central
[17] Brown N, Strong R. Infrared fundus angiography. Br J Ophthalmol 1973;57:797–802.10.1136/bjo.57.10.797Search in Google Scholar PubMed PubMed Central
[18] Craandijk A, Van Beek CA. Indocyanine green fluorescence angiography of the choroid. Br J Ophthalmol 1976;60:377–85.10.1136/bjo.60.5.377Search in Google Scholar PubMed PubMed Central
[19] Yeoh MS, Kim DD, Ghali GE. Fluorescence angiography in the assessment of flap perfusion and vitality. Oral Maxillofac Surg Clin North Am 2013;25:61–6, vi.10.1016/j.coms.2012.11.004Search in Google Scholar PubMed
[20] Ashitate Y, Stockdale A, Choi HS, Laurence RG, Frangioni JV. Real-time simultaneous near-infrared fluorescence imaging of bile duct and arterial anatomy. J Surg Res 2012;176:7–13.10.1016/j.jss.2011.06.027Search in Google Scholar PubMed PubMed Central
[21] Carus T, Dammer R. Laparoscop fluorescence angiography with indocyanine green to control the perfusion of gastrointestinal anastomoses intraoperatively. Surg Technol Int 2012;22:27–32.Search in Google Scholar PubMed
[22] Braun JD, Trinidad-Hernandez M, Perry D, Armstrong DG, Mills JL, Sr. Early quantitative evaluation of indocyanine green angiography in patients with critical limb ischemia. J Vasc Surg 2013;57:1213–8.10.1016/j.jvs.2012.10.113Search in Google Scholar PubMed
[23] Colvard B, Itoga NK, Hitchner E, Sun Q, Long B, Lee G, et al. SPY technology as an adjunctive measure for lower extremity perfusion. J Vasc Surg 2016;64:195–201.10.1016/j.jvs.2016.01.039Search in Google Scholar PubMed PubMed Central
[24] Igari K, Kudo T, Toyofuku T, Jibiki M, Inoue Y, Kawano T. Quantitative evaluation of the outcomes of revascularization procedures for peripheral arterial disease using indocyanine green angiography. Eur J Vasc Endovasc Surg 2013;46:460–5.10.1016/j.ejvs.2013.07.016Search in Google Scholar PubMed
[25] Venermo M, Settembre N, Alback A, Vikatmaa P, Aho PS, Lepantalo M, et al. Pilot assessment of the repeatability of indocyanine green fluorescence imaging and correlation with traditional foot perfusion assessments. Eur J Vasc Endovasc Surg 2016;52:527–33.10.1016/j.ejvs.2016.06.018Search in Google Scholar PubMed
[26] Riess HC, Dupree A, Behrendt CA, Kolbel T, Debus ES, Larena-Avellaneda A, et al. Initial experience with a new quantitative assessment tool for fluorescent imaging in peripheral artery disease. Vasa 2017;46:383–8.10.1024/0301-1526/a000642Search in Google Scholar PubMed
[27] Rother U, Lang W, Horch RE, Ludolph I, Meyer A, Gefeller O, et al. Pilot assessment of the angiosome concept by intra-operative fluorescence angiography after tibial bypass surgery. Eur J Vasc Endovasc Surg 2018;55:215–21.10.1016/j.ejvs.2017.11.024Search in Google Scholar PubMed
[28] Lepow BD. The use of SPY intra-operative vascular angiography as a predictor of wound healing. Podiatry Management 2011:141–8.Search in Google Scholar
[29] Urbanavicius L, Pattyn P, de Putte DV, Venskutonis D. How to assess intestinal viability during surgery: a review of techniques. World J Gastrointest Surg 2011;3:59–69.10.4240/wjgs.v3.i5.59Search in Google Scholar PubMed PubMed Central
[30] Thompson SK, Chang EY, Jobe BA. Clinical review: healing in gastrointestinal anastomoses, part I. Microsurgery 2006;26:131–6.10.1002/micr.20197Search in Google Scholar PubMed
[31] Degett TH, Andersen HS, Gogenur I. Indocyanine green fluorescence angiography for intraoperative assessment of gastrointestinal anastomotic perfusion: a systematic review of clinical trials. Langenbecks Arch Surg 2016;401:767–75.10.1007/s00423-016-1400-9Search in Google Scholar PubMed
[32] Karampinis I, Ronellenfitsch U, Mertens C, Gerken A, Hetjens S, Post S, et al. Indocyanine green tissue angiography affects anastomotic leakage after esophagectomy. A retrospective, case-control study. Int J Surg 2017;48:210–4.10.1016/j.ijsu.2017.11.001Search in Google Scholar PubMed
[33] Diana M, Noll E, Diemunsch P, Dallemagne B, Benahmed MA, Agnus V, et al. Enhanced-reality video fluorescence: a real-time assessment of intestinal viability. Ann Surg 2014;259:700–7.10.1097/SLA.0b013e31828d4ab3Search in Google Scholar PubMed
[34] Shimada Y, Okumura T, Nagata T, Sawada S, Matsui K, Hori R, et al. Usefulness of blood supply visualization by indocyanine green fluorescence for reconstruction during esophagectomy. Esophagus 2011;8:259–66.10.1007/s10388-011-0291-7Search in Google Scholar PubMed PubMed Central
[35] Zehetner J, DeMeester SR, Alicuben ET, Oh DS, Lipham JC, Hagen JA, et al. Intraoperative assessment of perfusion of the gastric graft and correlation with anastomotic leaks after esophagectomy. Ann Surg 2015;262:74–8.10.1097/SLA.0000000000000811Search in Google Scholar PubMed PubMed Central
[36] Murawa D, Hunerbein M, Spychala A, Nowaczyk P, Polom K, Murawa P. Indocyanine green angiography for evaluation of gastric conduit perfusion during esophagectomy – first experience. Acta Chir Belg 2012;112:275–80.10.1080/00015458.2012.11680838Search in Google Scholar PubMed
[37] Pacheco PE, Hill SM, Henriques SM, Paulsen JK, Anderson RC. The novel use of intraoperative laser-induced fluorescence of indocyanine green tissue angiography for evaluation of the gastric conduit in esophageal reconstructive surgery. Am J Surg 2013;205:349–52; Discussion 52–3.10.1016/j.amjsurg.2012.11.005Search in Google Scholar PubMed
[38] Kudszus S, Roesel C, Schachtrupp A, Hoer JJ. Intraoperative laser fluorescence angiography in colorectal surgery: a noninvasive analysis to reduce the rate of anastomotic leakage. Langenbecks Arch Surg 2010;395:1025–30.10.1007/s00423-010-0699-xSearch in Google Scholar PubMed
[39] Kin C, Vo H, Welton L, Welton M. Equivocal effect of intraoperative fluorescence angiography on colorectal anastomotic leaks. Dis Colon Rectum 2015;58:582–7.10.1097/DCR.0000000000000320Search in Google Scholar PubMed
[40] Jafari MD, Wexner SD, Martz JE, McLemore EC, Margolin DA, Sherwinter DA, et al. Perfusion assessment in laparoscopic left-sided/anterior resection (PILLAR II): a multi-institutional study. J Am Coll Surg 2015;220:82–92 e1.10.1016/j.jamcollsurg.2014.09.015Search in Google Scholar PubMed
[41] Sherwinter DA. Transanal near-infrared imaging of colorectal anastomotic perfusion. Surg Laparosc Endosc Percutan Techn 2012;22:433–6.10.1097/SLE.0b013e3182601eb8Search in Google Scholar PubMed
[42] Sherwinter DA, Gallagher J, Donkar T. Intra-operative transanal near infrared imaging of colorectal anastomotic perfusion: a feasibility study. Colorectal Disease 2013; 15:91–6.10.1111/j.1463-1318.2012.03101.xSearch in Google Scholar PubMed
[43] Hellan M, Spinoglio G, Pigazzi A, Lagares-Garcia JA. The influence of fluorescence imaging on the location of bowel transection during robotic left-sided colorectal surgery. Surg Endosc 2014;28:1695–702.10.1007/s00464-013-3377-6Search in Google Scholar PubMed
[44] Protyniak B, Dinallo AM, Boyan WP, Jr., Dressner RM, Arvanitis ML. Intraoperative indocyanine green fluorescence angiography – an objective evaluation of anastomotic perfusion in colorectal surgery. Am Surg 2015;81:580–4.10.1177/000313481508100621Search in Google Scholar PubMed
[45] Boni L, David G, Mangano A, Dionigi G, Rausei S, Spampatti S, et al. Clinical applications of indocyanine green (ICG) enhanced fluorescence in laparoscopic surgery. Surg Endosc 2015;29:2046–55.10.1007/s00464-014-3895-xSearch in Google Scholar PubMed PubMed Central
[46] Nowak K, Sandra-Petrescu F, Post S, Horisberger K. Ischemic and injured bowel evaluation by Fluorescence imaging. Colorectal Dis 2015;17 Suppl 3:12–5.10.1111/codi.13032Search in Google Scholar PubMed
[47] Toens C, Krones CJ, Blum U, Fernandez V, Grommes J, Hoelzl F, et al. Validation of IC-VIEW fluorescence videography in a rabbit model of mesenteric ischaemia and reperfusion. Int J Colorectal Dis 2006;21:332–8.10.1007/s00384-005-0017-1Search in Google Scholar PubMed
[48] Diana M, Halvax P, Dallemagne B, Nagao Y, Diemunsch P, Charles AL, et al. Real-time navigation by fluorescence-based enhanced reality for precise estimation of future anastomotic site in digestive surgery. Surg Endosc 2014;28:3108–18.10.1007/s00464-014-3592-9Search in Google Scholar PubMed
[49] Meng X, Liu L, Jiang H. Indications and procedures for second-look surgery in acute mesenteric ischemia. Surg Today 2010;40:700–5.10.1007/s00595-009-4140-4Search in Google Scholar PubMed
[50] Iinuma Y, Hirayama Y, Yokoyama N, Otani T, Nitta K, Hashidate H, et al. Intraoperative near-infrared indocyanine green fluorescence angiography (NIR-ICG AG) can predict delayed small bowel stricture after ischemic intestinal injury: report of a case. J Pediatr Surg 2013;48:1123–8.10.1016/j.jpedsurg.2013.03.067Search in Google Scholar PubMed
[51] Ryu S, Yoshida M, Ohdaira H, Tsutsui N, Suzuki N, Ito E, et al. Intestinal blood flow assessment by indocyanine green fluorescence imaging in a patient with the incarcerated umbilical hernia: report of a case. Ann Med Surg 2016;8:40–2.10.1016/j.amsu.2016.04.020Search in Google Scholar PubMed PubMed Central
[52] Nitori N, Deguchi T, Kubota K, Yoshida M, Kato A, Kojima M, et al. Successful treatment of non-occlusive mesenteric ischemia (NOMI) using the HyperEye Medical System for intraoperative visualization of the mesenteric and bowel circulation: report of a case. Surg Today 2014;44:359–62.10.1007/s00595-013-0503-ySearch in Google Scholar PubMed
[53] Behrendt FF, Tolba RH, Overhaus M, Hirner A, Minor T, Kalff JC. Indocyanine green fluorescence measurement of intestinal transit and gut perfusion after intestinal manipulation. Eur Surg Res 2004;36:210–8.10.1159/000078855Search in Google Scholar PubMed
[54] Matsui A, Winer JH, Laurence RG, Frangioni JV. Predicting the survival of experimental ischaemic small bowel using intraoperative near-infrared fluorescence angiography. Br J Surg 2011;98:1725–34.10.1002/bjs.7698Search in Google Scholar PubMed PubMed Central
Supplementary Material
The article (https://doi.org/10.1515/iss-2018-0014) offers reviewer assessments as supplementary material.
©2018 Duprée A., et al., published by De Gruyter, Berlin/Boston
This work is licensed under the Creative Commons Attribution-NonCommercial-NoDerivatives 4.0 License.
Articles in the same Issue
- Editorial
- Navigation and visualisation with HoloLens in endovascular aortic repair
- Magnetic particle imaging in vascular medicine
- Utilization of indocynanine green fluorescent imaging (ICG-FI) for the assessment of microperfusion in vascular medicine
- Generating vascular conduits: from tissue engineering to three-dimensional bioprinting
- Dehydration improves biomechanical strength of bioartificial vascular graft material and allows its long-term storage
- Artificial vascular models for endovascular training (3D printing)