Discrimination of Volatiles of Shiitakes (Lentinula edodes) Produced during Drying Process by Electronic Nose
-
Hui Zhang


Abstract
This study aimed to investigate the potential of electronic nose (E-nose) to differentiate volatiles of shiitakes produced at different drying stages. Shiitakes at different drying time slots were categorized into four groups (fresh, early, middle and late stage) by sensory evaluation. E-nose was used to analyze the volatiles and compared with headspace solid phase micro-extraction combined with gas chromatography-mass spectrometry (HS/GC-MS). The principal component analysis results showed that shiitakes at each stage could be successfully discriminated by E-nose and HS/GC-MS. The differences in volatile organic compounds produced at each stage were mainly caused by sulfurs and alcohols, leading to apparent changes of sensors sensitive to sulfurs, alcohols and aromatic compounds. The discriminant models were established by partial least squares discriminant analysis and support vector machine classification, with accuracy rates of 91.25 % and 95.83 %, respectively. The results demonstrated the potential use of E-nose in classifying and monitoring shiitakes during drying process.
1 Introduction
Shiitake mushroom (Lentinula edodes) is the second largest edible mushroom in the world [1]. It is popular at the table because of its pleasant aroma, delicious taste and rich nutrients, such as amino acids, minerals and polysaccharides [2, 3]. However, the fresh shiitake is highly perishable as it contains moisture up to 90 % that quality deterioration caused by microbial and enzyme activities would quickly take place if not preserved in time [4, 5].
Drying is the most commonly used method for shiitakes preservation [6]. Drying process not only changes the moisture content of the shiitake, but also affects its aroma, nutrition and palatability [7]. Aroma is one of the most important marketable characteristics of dried shiitakes, and the changes in aroma are closely related to product quality [8]. The aroma of shiitakes is determined by a combination of volatile organic compounds (VOCs) such as alcohols, sulfur compounds, ketones, aldehydes and esters [9]. Both enzymatic and non-enzymatic reactions as well as macromolecules degradation take place in shiitakes during drying process, which change the composition and concentration amounts of VOCs and therefore the aroma of the products. With the drying ongoing, the aroma of shiitakes changes from slight garlic smell to strong rotten egg smell, finally to a saute scent [10, 11]. Simultaneously, the unique volatile compounds such as sulfur compounds, especially 1, 2, 4-trithiolane and 2, 3, 5-trithiahexane are formed during this process, leading to significant differences in the aroma between dried and fresh shiitakes [12, 13]. On the other hand, because of dynamic and complex nature of drying process, undesirable physiochemical changes caused by inappropriate drying conditions can result in low quality products with unpleasant aroma. Since aroma volatilization and off-odors production are the major reasons for the food quality deterioration during drying process, it is necessary to analyze and monitor the aroma of shiitakes during drying process [14].
Headspace solid phase microextraction combined with gas chromatography-mass spectrometry (HS/GC-MS) has been widely used for analyzing the VOCs of foods. Although this method can accurately measure and quantify the aroma components, the big drawback is that the sample preparation is complicated and the detection time is long. In recent decades, emerging technologies and efficient methods have been explored to monitor the food quality during drying process. The electronic nose (E-nose) is a non-destructive testing technology that emulates the structure of the biological nose, and can directly obtain the overall aroma information of the samples by suitable sensor array [15]. E-nose has been applied in various foods for grading, identifying external and internal inferior quality and authenticity tracing [16]. Qiu and Wang [17] employed E-nose to determine the concentrations of food additives. Li et al. [18] identified ordor differences of Goji berries and discriminated their geographic origins by E-nose. Nowadays, researchers are more inclined to use a combination of E-nose and GC-MS, which is widely used in the classification of different varieties of edible fungi [19] and other agricultural products, such as bayberry [20] and jujubes [21].
At present, studies on the aroma of shiitakes are mainly focused on the changes between fresh and processed shiitakes, such as blanching, drying and crushing [22, 23, 24]. There are few studies related to the changes of VOCs of shiitakes during drying process. To the best of our knowledge, aroma changes of shiitakes during different drying stages that analyzed and classified by E-nose have not been reported yet. Therefore, this study aimed to investigate the changes in volatile profile of shiitakes during drying process, and explore the potential of E-nose on discriminating their aroma characteristics produced at different drying stages. The main objectives were to (1) classify different drying stages of shiitakes by sensory evaluation; (2) analyze VOCs of shiitakes produced during different drying stages by HS/GC-MS; (3) collect the sensor responses of shiitakes at different drying stages using E-nose and screen out the target sensors by principal component analysis (PCA); (4) comparative analysis of sensor responses and VOCs of shiitakes obtained by E-nose and HS/GC-MS; and (5) develop models for distinguishing different drying stages of shiitakes based on partial least squares discriminant analysis (PLS-DA) and support vector machine classification (SVM-C).
2 Materials and methods
2.1 Sample preparation and drying procedure
Fresh shiitakes were purchased from a local supermarket in Nanjing, China. The intact shiitakes with a radius of about 2.5 cm were selected and used in this study [25]. Samples were rinsed with clean water and the residual water was removed from the surface with filter paper. Next, the handle of the samples were trimmed to approximately 1.0 cm. The average initial moisture content of the samples was 88.0 ± 1.2 % (w.b.), as determined by oven drying method [26].
Fresh samples (400 g, about 18–19 fruit-bodies) were put in hot air oven and dried at 65 °C [27] until the moisture content fell below 13 % (w.b.) according to the Chinese official analysis method [28]. It took 8 h for the samples to reach the target moisture content. Samples were weighed once per hour using an analytical balance (JH2102, Precision & Scientific Instrument Co., Ltd., Shanghai, China) during the drying process Then moisture content was calculated by using the difference in mass and analyzed as a function of drying time [29].
2.2 Classification of different drying stages
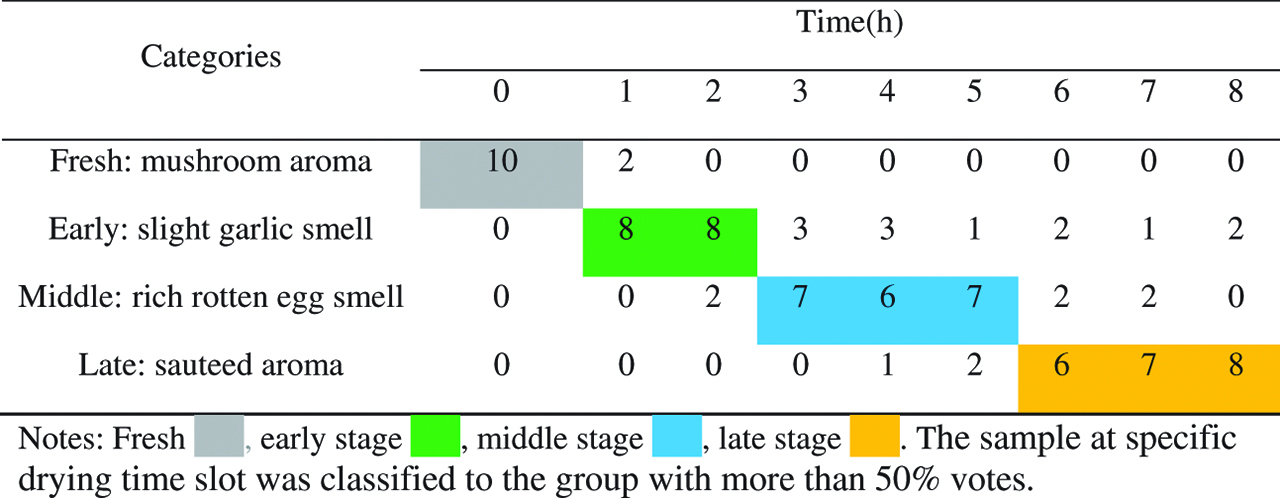
Sensory evaluation was carried out to classify different drying stages for shiitakes according to their odors, which is closely correlated to their overall quality [8]. A panel of 10 trained assessors (five females and five males, ages 20–40) with good living habits and no special dietary preferences were invited to the sensory test. Each assessor was asked to complete a questionnaire about the differences of the aroma of shiitakes using a four-odor description (mushroom, slight garlic, rich rotten egg and sauteed smell), which refers to the four different drying stages (fresh, early, middle and late), respectively. The description of the smell refers to Hiraide et al. [10] and Pei et al. [11] with slight modification. A set of 9 samples were served for each assessor. Each sample was obtained from one specific drying time, and nine samples represented shiitakes with nine different drying time (0, 1, 2, 3, 4, 5, 6, 7, 8 h). Each sample was put in a beaker which labeled with random 3-digit numbers. The questionnaire was carried out at room temperature and one at a time, with a 3 min wait between each sample. The assessors marked each sample to one of the four aroma groups (mushroom, slight garlic, rich rotten egg and sauteed smell), and the sample was classified to the group with more than 50 % votes.
Apart from odor, shrinkage and color are also important quality attributes for shiitakes during the drying process. Thus, the shrinkage rate and total color difference (ΔE) of shiitakes were used to verify the classification results obtained by sensory evaluation. Three fruit bodies were randomly selected from each group for color and shrinkage measurement, and the shrinkage rate and ΔE values were represented by the mean values of measurements from three batches. The shrinkage rate (%) of the sample was calculated by dividing the volume loss of dried samples by the initial volume of the fresh samples. The volume was measured by a millet displacement method [30]. The L*, a* and b* values of the samples were determined by Minolta colorimeter (CR-400, Tokyo, Japan). Five measurements were carried out on the cap of each sample at different positions. The calculation of ΔE followed the equation below:
where L0*, a0* and b0* represent the color values of fresh samples, and L*, a* and b* refer to the color values of dried shiitakes. Experiments were conducted in triplicates.
2.3 Analysis of VOCs by HS/GC-MS
The volatiles of shiitakes were isolated by solid phase micro-extraction. Samples at different drying stages were crushed by an analytical grinding machine (IKA, Germany) separately. Weighted samples (2 g) were placed into a 15 mL headspace vial.
A 65 μm layer Polydimethylsiloxane/ Divinylbenzene (PDMS/DVB) fibers was used to absorb the volatile compounds at 55 °C for 40 min based on our pre-experiments, then introduced directly into the GC injector and desorbed at 250 °C for 3 min [13]. The VOCs of shiitakes were separated and identified by using Agilent-5975 Gas Chromatography Mass Spectrometer (Agilent, USA) and DB-WAX column (30 m × 0.25 mm × 0.25 um), following the method described by Wang et al. [31] with slight modification. The temperature was programmed as follows: the initial temperature was 40 °C and kept for 3 min. Next, it was increased to 120 °C at a rate of 6 °C/min, then to 230 °C at the rate of 10 °C/min and maintained for 2 min. Helium was used as carrier gas at a constant flow rate of 1 mL/min. Both the detector and injector temperatures of the GC equipment were maintained at 250 °C. The MS fragmentation was performed by electronic impact mode. Ion source temperature was 230 °C and quadruple temperature was 150 °C. Electron energy was 70 eV. The acquisition was full-scan mode with mass acquisition range of 35–550 m/z [32]. All compounds were identified by matching with National Institute of Standards and Technology mass spectrometry library (2008), and the components with the matching degree greater than 80 % were selected. The relative content of each chemical component was calculated by the peak area normalization method (The ratio of the peak area of each compound to the total peak area of the sample) [33]. All experiments were performed in triplicates.
2.4 E-nose system
The aromatic information of shiitakes was carried out using a commercial E-nose system, PEN3 electronic nose (Airsense Company, Germany). This E-nose system consists of a sample introduction system, a pattern recognition unit and a sensor array with a total of 10 sensors, which are differentially sensitive to different characteristic volatile compounds. Details of the parameters about the sensors can be found in Table 1 [34].
Sensors used in PEN3 system and their main applications.
| Sensor number | Sensor name | Main applications | Reference |
|---|---|---|---|
| R1 | W1C | Sensitive to aromatic compounds | Toluene, 10 mg kg−1 |
| R2 | W5S | Broad sensitivity and very sensitive to nitrogen oxides | NO2, 1 mg kg−1 |
| R3 | W3C | Sensitive to ammonia and aromatic compounds | Benzene, 10 mg kg−1 |
| R4 | W6S | Mainly sensitive to hydrogen | H2, 100 μg kg−1 |
| R5 | W5C | Sensitive to alkenes and aromatic compounds | Propane, 1 mg kg−1 |
| R6 | W1S | Sensitive to methane | CH3, 100 mg kg−1 |
| R7 | W1W | Sensitive to sulfides | H2S, 1 mg kg−1 |
| R8 | W2S | Sensitive to alcohol | CO, 100 mg kg−1 |
| R9 | W2W | Sensitive to aromatic compounds and organic sulfides | H2S, 1 mg kg−1 |
| R10 | W3S | Mainly sensitive to alkenes | CH3, 100 mg kg−1 |
For the measurements, each shiitake at different drying stages was put into a 250 mL beaker sealed with tinfoil paper at room temperature of around 25 °C for 10 min to ensure the VOCs from the shiitakes were filling the beaker and achieving equilibrium [35]. Sixty samples (from four different batches) were taken from each drying stage. Before testing, the E-nose system was warmed up to ensure the sensor surface was heated up to working temperature. Then filtered air was used to clean the gas path and made each sensor reach the baseline. After that, volatiles at the headspace were delivered into the sensor surfaces for 60 s at a constant flow rate of 120 mL/min, which was long enough for the sensors to reach stable signal responses. The probe was cleaned for 120 s before next measurement [16, 36]. The detection data were recorded per second and then the averages of response values from 58 to 60 s were used as the characteristic values for further analysis [37].
2.5 Model establishment
The discrimination models for volatiles of shiitakes at different drying stages were set up by two methods: PLS-DA and SVM-C. Samples were randomly divided into validation set and prediction set by 3:1. The characteristic value of each sensor was used as an input variable, and the corresponding drying stage label was used as an output variable. The performance was evaluated by the accuracy rate of the model.
2.6 Data analysis
Data analysis was performed using IBM SPSS Statistics 18.0 (IBM, Chicago, IL, USA). One-way analysis of variance and Duncan test were used to analyze the significance (p < 0.05) of mean difference among different groups of samples. PLS toolbox and LibSVM 3.3.1 toolbox in Matlab R2010 software (The Math Works Inc.; Natick, MA, USA, 2012a) were used for discrimination and Origin 9.0 was used for drawing graphics.
3 Results and discussion
3.1 Classification of different drying stages by sensory evaluation
The classification results of volatiles of shiitakes produced during different drying stages evaluated by ten sensory assessors is summarized in Table 2 . It took 8 h to dry the shiitakes to the target moisture (< 13 %) at 65 °C by hot air. Samples from different drying time slots (0–8 h) were classified into four stages based on their smell: fresh stage (mushroom aroma), early stage (slight garlic smell), middle stage (rich rotten egg smell) and late stage (saute aroma). Fresh samples were all recognized as mushroom aroma and were categorized in the fresh stage. Samples dried within 2 h were inclined to have slight garlic smell and 80 % of assessors classified them as the products of early-stage drying. More than 60 % of assessors considered samples dried for 3–5 h with rich rotten egg smell and classified them into the middle stage, while those dried above 5 h exhibiting sauteed aroma and were mostly (60 %) classified into the late stage. Based on the sensory evaluation results, volatiles of shiitakes produced during drying process were categorized into four groups: fresh (0 h drying), early stage (≤ 2 h drying), middle stage (3–5 h drying) and late stage (6–8 h drying). Therefore, the samples dried at 0, 2, 5 and 8 h, which typically represented the four drying stages, were selected and used in our later study, and their corresponding moisture contents were around 88 %, 75 %, 50 % and 13 %, respectively (Table 3).
Classification of volatiles of shiitakes produced during drying process by sensory evaluation.
Changes in moisture content, shrinkage and ΔE of shiitakes at different drying stages.
| Drying stages | Moisture content (%) | Shrinkage rate (%) | ΔE |
|---|---|---|---|
| Fresh | 88.0 ± 1.2a | – | – |
| Early stage | 75.8 ± 2.9b | 26.39 ± 2.83c | 5.34 ± 0.15c |
| Middle stage | 49.3 ± 1.2c | 53.67 ± 1.16b | 6.31 ± 0.31b |
| Late stage | 12.5 ± 0.3d | 66.48 ± 1.94a | 7.81 ± 0.19a |
Data are mean values ± SD of three replicates. Values in the same columns with different letters indicate significant differences (p < 0.05).
Color and shrinkage rate are important quality attributes for dried shiitakes and were used to verify the classification of different drying stages besides moisture content. It can be seen that the shrinkage rate continued increasing with drying process going on, and significant differences (p < 0.05) were observed in the shrinkage values among samples at each drying stage (Table 3). The RGB images of the samples from different drying stages can be found in Figure 1. Similarly, the total color difference (ΔE) kept increased with increasing drying time and samples at different drying stages showed significant differences in their ΔE values by Duncan multiple comparison. This proved that the classification of drying stages for shiitakes by sensory evaluation was reasonable.
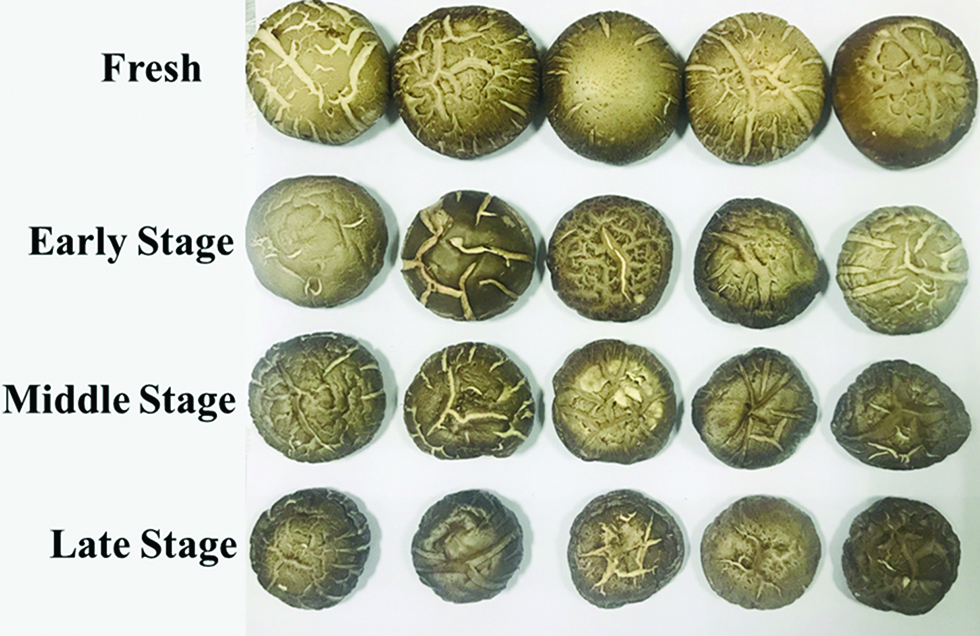
The RGB images of the samples from different drying stages.
3.2 VOCs of shiitakes produced during drying process analyzed by HS/GC-MS
A total of 59 different VOCs were detected from shiitakes during the whole drying process by HS/GC-MS, including sulfur compounds, alcohols, aldehydes, alkanes, esters and acids (Table 4). The number of compounds presented in shiitakes increased with increasing drying time, from 36 substances for those at the fresh stage to 40 for those at the middle stage and 44 at the late stage. The types and relative contents of VOCs for shiitakes at different drying stages were different, indicating a certain correlation between the VOCs of the shiitakes and the drying stages, which shows the feasibility of detecting the drying stage for shiitakes by the smell. It can be seen from Table 4, among the VOCs detected, alcohols and sulfurs are the two most important compounds in shiitakes. Alcohols content in fresh shiitakes was the highest, accounting for almost half of all substances (49.72 %). As drying progressed, alcohol content decreased rapidly, from 24.42 % at the early stage to about 8 % at the middle and late stages. Beluhan and Ranogajec [38] reported similar results that the alcohol contents of edible mushrooms decreased significantly during thermal processing. In contrast, sulfur compounds increased significantly, from 22.26 % at the fresh stage to 44.08 % at the early stage, and continued increasing during the drying process until reaching a maximum of 70.32 %. The relative contents of aldehydes and ketones varied from 5 to 20 %, while the values were all below 5 % for alkanes, esters and acids. It can be seen that the changing trends in the alcohols and sulfur compounds were smoother at the mid-late drying stage, while in alkanes and esters were more apparent. At the end of drying, the content of esters and sulfurs increased to the maximum values, while the content of alcohols, aldehydes and ketones reached the minimum values.
VOCs detected in shiitakes at four drying stages by HS/GC-MS.
| Compounds | Fraction (area %) | ||||
|---|---|---|---|---|---|
| Fresh | Early stage | Middle stage | Late stage | ||
| Alcohols | 1-Octen-3-ol | 3583 ± 7.81a | 13.32 ± 2.13b | ND | ND |
| 3-Octanol | 5.8 ± 0.55a | 3.61 ± 0.42b | 2.12 ± 0.45c | 0.61 ± 0.18d | |
| 1-Octanol | 4.13 ± 0.89a | 2.89 ± 0.51b | 1.5 ± 0.23c | 0.22 ± 0.09d | |
| 2-Octen-1-ol, (Z)- | 3.18 ± 0.78a | 2.59 ± 0.45b | 0.65 ± 0.15c | 0.22 ± 0.12d | |
| Phenylethyl Alcohol | 0.34 ± 0.05d | 0.88 ± 0.11c | 2.19 ± 0.19b | 3.57 ± 0.78a | |
| Benzyl Alcohol | 0.17 ± 0.08d | 0.33 ± 0.06a | 0.24 ± 0.09c | 0.32 ± 0.09b | |
| Benzeneethanol, .beta.-methyl- | 0.27 ± 0.09d | 0.73 ± 0.12c | 1.83 ± 0.22b | 3.2 ± 0.56a | |
| D-Glucitol | ND | 0.07 ± 0.02c | 0.14 ± 0.05b | 0.16 ± 0.05a | |
| 1-Pentanol, 2-ethyl-4-methyl- | ND | ND | 0.17 ± 0.03b | 0.34 ± 0.06a | |
| Subtotal | 49.72 ± 4.02a | 24.42 ± 2.80b | 8.84 ± 1.01c | 8.65 ± 1.18c | |
| Sulfurs | Carbon disulfide | 8.1 ± 0.72b | 12.28 ± 2.56a | 7.46 ± 1.23c | 0.31 ± 0.11d |
| Lenthionine | 5.32 ± 0.68c | 4.26 ± 0.75d | 9.95 ± 1.98b | 14.3 ± 1.25a | |
| Disulfide, dimethyl | 0.88 ± 0.23d | 4.09 ± 0.55c | 7.85 ± 0.38b | 11.6 ± 1.69a | |
| Dimethyl trisulfide | 4.62 ± 0.99d | 14.95 ± 2.68c | 22.77 ± 4.92b | 25.5 ± 3.69a | |
| Tetrasulfide, dimethyl | 1.3 ± 0.12d | 3.93 ± 0.23c | 7.08 ± 0.61a | 6.81 ± 0.83b | |
| 1,2,4-Trithiolane | 1.04 ± 0.28d | 2.57 ± 0.57c | 4.23 ± 1.03b | 5.54 ± 0.89a | |
| 1,2,4,5-Tetrathiane | 0.29 ± 0.09d | 0.44 ± 0.16c | 1.68 ± 0.39b | 2.73 ± 0.85a | |
| 1,2,4,6-Tetrathiepane | ND | 0.67 ± 0.27c | 1.98 ± 0.79b | 2.75 ± 1.21a | |
| (methyldisulfanyl)-methylsulfanylmethane | ND | 0.3 ± 0.07c | 0.77 ± 0.12a | 0.69 ± 0.16b | |
| 2,4-Dithiapentane | ND | 0.34 ± 0.09 | ND | ND | |
| Cyclic octaatomic sulfur | 0.7 ± 0.15a | 0.26 ± 0.05b | 0.05 ± 0.01c | ND | |
| Dimethyl sulfone | ND | ND | 0.06 ± 0.01b | 0.13 ± 0.03a | |
| Subtotal | 22.26 ± 1.05c | 44.08 ± 3.50b | 63.84 ± 4.18a | 70.32 ± 5.1a | |
| Acids | Cystine | 0.55 ± 0.11 | ND | ND | ND |
| Acetic acid | 0.43 ± 0.12 | ND | ND | ND | |
| 7-Methoxy-2-oxo-2H-chromene-3-carboxylic acid | ND | ND | ND | 0.19 ± 0.04 | |
| n-Hexadecanoic acid | 0.17 ± 0.03a | 0.07 ± 0.01c | 0.06 ± 0.01d | 0.1 ± 0.02b | |
| Pentadecanoic acid | 0.08 ± 0.01b | ND | 0.05 ± 0.01c | 0.1 ± 0.02a | |
| Tetradecanoic acid | 0.26 ± 0.03 | ND | ND | ND | |
| Subtotal | 1.48 ± 0.30a | 0.07 ± 0.01c | 0.17 ± 0.02c | 0.51 ± 0.08b | |
| Aldeh-ydes | Benzaldehyde | 0.82 ± 0.15d | 1.37 ± 0.46c | 2.71 ± 0.57a | 2.02 ± 0.24b |
| 2-Phenylpropenal | 9.4 ± 0.12a | 8.2 ± 0.88b | 2.18 ± 0.35c | 0.5 ± 0.07d | |
| 2-Phenylpropionaldehyde | 0.23 ± 0.05d | 0.53 ± 0.1c | 2.43 ± 0.62a | 1.69 ± 0.32b | |
| Benzeneacetaldehyde | 0.4 ± 0.06d | 0.63 ± 0.04a | 0.51 ± 0.04c | 0.55 ± 0.04b | |
| 2-Octenal, (E)- | 0.6 ± 0.08a | 0.13 ± 0.04b | ND | ND | |
| Hexanal | ND | 0.21 ± 0.04c | 0.59 ± 0.09b | 0.69 ± 0.13a | |
| Octanal | 0.26 ± 0.08 | ND | ND | ND | |
| 2-Propenal, 3-phenyl- | 0.26 ± 0.12 | ND | ND | ND | |
| 2-phenyl-2-butenal | ND | 0.04 ± 0.01c | 0.67 ± 0.02b | 1.2 ± 0.13a | |
| Subtotal | 11.99 ± 0.36b | 11.18 ± 0.78a | 9.12 ± 0.97c | 6.77 ± 0.56c | |
| Alkanes | 3-Octene, (E)- | ND | ND | 0.53 ± 0.12b | 1.02 ± 0.16a |
| Cyclobutane cyclobutylidene- | ND | 0.09 ± 0.01c | 0.12 ± 0.03b | 0.16 ± 0.04a | |
| Undecane | ND | 0.16 ± 0.02c | 0.33 ± 0.06b | 0.45 ± 0.03a | |
| Oxirane, 2-methyl-2-phenyl- | 1.01 ± 0.09 | ND | ND | ND | |
| 1-Nonene | ND | ND | ND | 0.16 ± 0.01 | |
| Dodecane | 0.04 ± 0.01d | 0.2 ± 0.03c | 0.49 ± 0.03b | 0.64 ± 0.09a | |
| Tridecane | ND | 0.04 ± 0.01c | 0.12 ± 0.01b | 0.18 ± 0.03a | |
| Nonadecane | ND | ND | ND | 0.16 ± 0.03 | |
| Pentadecane | 0.1 ± 0.01 | ND | ND | ND | |
| Heptadecane | 0.21 ± 0.02 | ND | ND | ND | |
| Hexadecane | 0.14 ± 0.02a | 0.06 ± 0.01b | 0.05 ± 0.01c | 0.03 ± 0.01d | |
| Subtotal | 1.79 ± 0.15b | 0.62 ± 0.08c | 1.74 ± 0.26a | 2.90 ± 0.52a | |
| Ketones | 3-Octanone | 11.71 ± 0.64c | 18.19 ± 0.48a | 15.37 ± 0.92b | 8.5 ± 0.63d |
| 2-Undecanone | 0.08 ± 0.01c | 0.14 ± 0.02b | 0.15 ± 0.01b | 0.18 ± 0.02a | |
| Acetophenone | ND | ND | 0.15 ± 0.02b | 0.31 ± 0.03a | |
| 2-Pyrrolidinone | ND | ND | ND | 0.32 ± 0.01 | |
| 1-Isoindolinone | 0.93 ± 0.13 | ND | ND | ND | |
| Subtotal | 12.73 ± 0.48c | 18.33 ± 0.45a | 15.68 ± 0.82b | 9.33 ± 0.73d | |
| Esters | Formic acid, octyl ester | ND | 0.08 ± 0.01c | 0.16 ± 0.02b | 0.32 ± 0.02a |
| Methyl palmitate | 0.13 ± 0.01 | ND | ND | ND | |
| Dimethyl Trithiocarbonate | ND | ND | 0.1 ± 0.01b | 0.19 ± 0.02a | |
| ethyl acetate | ND | 0.09 ± 0.02c | 0.15 ± 0.01b | 0.21 ± 0.02a | |
| 1, 4-Benzenedicarboxylic acid, 1, 4-dimethyl ester | ND | 1.14 ± 0.26 | ND | ND | |
| Hexanedioic acid, 1, 6-diisooctyl ester | ND | ND | 0.2 ± 0.01b | 0.4 ± 0.01a | |
| 10-hydroxy-11-morpholin-4-yl-Undecanoic acid isopropyl ester | ND | ND | ND | 0.4 ± 0.01 | |
| Subtotal | 0.13 ± 0.01b | 1.31 ± 0.19a | 0.61 ± 0.05b | 1.53 ± 0.79a | |
ND = not detected. Results were expressed as the mean value ± standard deviation (SD) of three replicates. Values in the same row with different letters indicate significant differences (p < 0.05).
The data of VOCs obtained by HS/GC-MS were analyzed by PCA. Three main components were obtained after reducing the dimensionality of the GC-MS data for shiitakes at four different drying stages. The variance contribution rates of three principal components were 56.18 %, 33.34 % and 8.31 %, respectively, containing most of the information of the samples. Figure 2 shows that the four different stages of shiitakes during drying process can be completely distinguished by their aroma. In the direction of the first principal component (PC1), samples at the early, middle and late stage were close to each other, scattered with the fresh samples, indicating an apparent difference between the fresh and dried samples. Based on the obtained HS/GC-MS data, this difference may be caused by the reduction of alcohols, acids and the increase of sulfur compounds during the drying process, particularly the reduction or disappearance of 1-octene-3-ol, pentatanic acid and addition of lentin, dimethyl disulfide and dimethyl trisulfide (Table 4). In the direction of the second principal component (PC2), the VOCs of samples at the fresh stage were close to those at the early stage, while dispersed with those at the middle and late stages, which can be explained by the changes of dimethyl tetrasulfide and benzyl alcohol according to the HS/GC-MS data shown in Table 4.

PCA of HS/GC-MS data of shiitakes at different drying stages.
3.3 E-nose response signal of VOCs of shiitakes produced during drying process
E-nose detection signal of shiitakes at four different drying stages is shown in Figure 3. The response values of each sensor were presented by G/G0, the ratio of the conductivity of the sensor when detecting the sample to the initial conductivity when passing the clean air [16]. The more the response values deviated from the baseline value, the greater the gas concentration detected by the sensors. The sensors of R2, R7 and R10 were positively correlated with the odor of fresh shiitakes, while R6 and R8 were negatively correlated with their odor, with relatively low response values around 1.0 (Figure 3(a)). For samples at the early drying stage, R7 (sensitive to sulfur compounds) had the highest response values which exceeding 8, followed by R9 (sensitive to aromatic compounds) and R2 (sensitive to nitrogen oxides), with response values about 7.5 and 3.5, respectively. For samples at the middle stage, R7, R2 and R9 were the three sensors with the higher response values (Figure 3(c)). Compared with the early drying stage, the response values of those three sensors were improved, with values of R7 exceeding 12 and values of R2 and R9 about 11. The response values of those three sensors were decreased for shiitakes at the late stage, with values around 4–6, obviously lower than that at the early and middle stages.

Response values of ten sensors to VOCs of shiitakes at different drying stages (A: fresh; B: early stage; C: middle stage; D: late stage).
For better understanding the difference of response signals to the shiitakes with different drying stages, the average of the stable values of response signal by the ten sensors were drawn as a radar chart (Figure 4). As it can be seen, shiitakes at different drying stages exhibited different odor fingerprints. The sensors of R2, R6, R7, R8 and R9 had relatively high response values, and the values differed among samples at different drying stages, especially for R2, R7 and R9 sensors. The signal changes of R1, R3, R4, R5 and R10 were very small, indicating those sensors were not sensitive to the odor changes of shiitakes during the drying process. As the drying time increased, the response signals of the five major sensors kept rise during the first drying stage. The odor got the strongest at the middle stage and began to fade thereafter. This may be explained by the activation of γ-GTPase with drying progressing, and therefore the formation of sulfur compounds (garlic odor) during the first drying stage. Then the sulfides continued to accumulate and produced a rotten egg flavor at the middle stage. At the late stage of drying, the maillard reaction was intensified and produced a variety of compounds that reducing the rotten egg odor and presenting some sauteed smell [39].

Radar fingerprint chart of the VOCs of shiitakes at different drying stages.
3.4 Correlations between sensor responses and VOCs
Generally, the overall smell of fresh shiitakes was very slight and the signal response of each sensor was weak (values around 1), with 1-octene-3-ol, 3-octanol and n-octanol as the characteristic odors. At the early drying stage, the sharp increase in the relative contents of sulfurs (from 22.26 % to 44.08 %) and decrease in the acid contents (from 1.48 % to 0.07 %) were observed. This may be explained by the activation of various enzymes during the early drying stage, which led to the formation of sulfurs and the reduction of acids (the precursor compounds of sulfur compounds). Thus, the sulfide-sensitive sensors (R7) produced high responses at the early stage, with values increased to around 8 (Figure 3(b)). E-nose responses of sulfide-sensitive sensors reached the peak values (around 12) at the middle drying stage, with high relative contents of sulfurs (63.84 %) detected by GC-MS At the late stage, E-nose responses reduced to around 5, which might be caused by the disappearance of the intermediate products and the formation of alkanes, aldehydes, ketones and esters. The later four volatile compounds were reported to mainly play a harmonious and complementary role in the odor of shiitakes [13]. Lentin, 1, 2, 4-trithiolane and 1, 2, 4, 5-tetrathiane were the characteristic odors of samples at this stage based on our GC-MS results, which are in agreement with those reported by Shiga et al. [40].
The correlation analysis of ten sensor response values of E-nose and VOCs in shiitakes during drying is summarized in Table 5. The alcohol content was significantly positive (p < 0.05) correlated with the sensor of R8 (sensitive to alcohols), with the correlation coefficient of 0.959. The sulfurs content was significantly positive correlated with the sensors of R2 and R7, and significantly negative correlated with the sensors of R8 and R9, with absolute values of the correlation coefficients varied from 0.907 to 0.987. Significantly positive correlation was also found between alkanes and sensor R6, with a correlation coefficient of 0.962. The absolute values of the correlation coefficients of acids, aldehydes, ketones and esters with each sensor ranged from 0.479–0.821, 0.105–0.762, 0.12–0.724 and 0.075–0.673, respectively, none of which was statistically significant. These results are in accordance with our radar chart (Figure 4), and would be further confirmed in our later PCA loading analysis.
Correlation analysis of sensor responses and the VOCs in shiitakes during the drying process.
| Name | Alcohols | Sulfurs | Acids | Aldehydes | Alkanes | Ketones | Esters |
|---|---|---|---|---|---|---|---|
| R1 | 0.636 | −0.861 | 0.782 | 0.685 | 0.008 | −0.134 | −0.503 |
| R2 | −0.686 | 0.987* | −0.63 | −0.493 | −0.17 | 0.339 | 0.075 |
| R3 | 0.841 | −0.783 | 0.657 | 0.688 | −0.025 | −0.131 | −0.306 |
| R4 | −0.537 | 0.321 | −0.821 | −0.048 | −0.639 | 0.724 | 0.051 |
| R5 | 0.736 | −0.615 | 0.724 | 0.466 | 0.235 | −0.391 | −0.161 |
| R6 | 0.141 | 0.526 | −0.717 | −0.785 | 0.962* | −0.12 | 0.572 |
| R7 | −0.771 | 0.910* | −0.593 | −0.105 | −0.437 | 0.546 | 0.329 |
| R8 | 0.959* | −0.987* | −0.58 | −0.762 | 0.374 | −0.272 | 0.673 |
| R9 | −0.749 | −0.907* | 0.564 | −0.275 | −0.464 | 0.573 | 0.302 |
| R10 | −0.671 | 0.546 | −0.479 | −0.417 | −0.265 | 0.427 | 0.269 |
* indicates significant correlation, p < 0.05.
3.5 Analysis of the E-nose responses by PCA
Figure 5 shows the PCA results of the characteristic values of shiitakes at different drying stages. The total contribution rate of PC1 and PC2 was 91.88 %, indicating that the data after dimension reduction can represent most of the information of the original data [41]. From Figure 5, we can see that the samples of the shiitakes at four different drying stages can be well distinguished, though there was a very small overlap between the early stage and the middle stage. The PCA result of the E-nose data was consistent with that of HS/GC-MS The data points of the samples at four drying stages were all dispersed along PC1. The data points at the early-middle stages were also dispersed along PC2, and scattered within each group, indicating relatively big differences among the individual samples. In contrast, data points at the fresh and late stages were concentrated, indicating very small differences among individuals within each group. Therefore, in order to reduce the overall error caused by the differences between individuals, it was necessary to have a sufficient number of samples.

PCA of E-nose responses of shiitakes at different drying stages.
The contributions of the ten sensors for distinguishing the odor changes of the shiitakes at different drying stages are shown in Figure 6. In the direction of PC1, the scores of R2, R7 and R9 were higher than 0.85, while those of R1, R3, R4 and R5 were less than 0.5, indicating the former three sensors had the highest contributions among those sensors. In the direction of PC2, the contributions of R8, R6 and R1 were the highest, with scores varied from 0.7 to 0.9. However, considering the contribution rate of PC2 (5.34 %) was far lower than PC1 (86.54 %), mainly the scores of sensors on PC1 was taken into account, which indicate sensors of R2, R7 and R9 contributing the most to distinguishing the odor changes of shiitakes during the whole drying process, followed by R6 and R8.

Loading analysis of sensor response values of shiitakes at different drying stages.
3.6 Discrimination drying stages of shiitakes using E-nose responses by PLS-DA and SVM-C analysis
The PLS-DA and SVM-C algorithms were used to establish the discrimination models for volatiles of shiitakes produced at different drying stages. Divided by the ratio of the validation set to the prediction set of 3:1, a total of 180 samples were randomly selected as the validation and 60 samples were used as the prediction. The distribution of total E-nose data from samples at different drying stages in the validation and prediction sets is shown in Figure 7. The prediction samples were randomly scattered and all included in the validation samples, indicating that the division of validation and prediction sets was reasonable.

The distribution of total E-nose data from samples in the validation and prediction sets.
The results of the discrimination models for shiitakes at different drying stages based on E-nose data are summarized in Table 6. For the PLS-DA model, the accuracy rate of the validation and the prediction was 91.67 % and 90.00 %, respectively, and the overall accuracy rate was 91.25 %. The accuracy rate of the validation and prediction built with SVM-C model was 96.11 % and 93.33 %, respectively, and the overall accuracy rate was 95.83 %, which was better than those obtained by the PLS-DA model. These results demonstrated that E-nose technology can successfully be used to identify shiitakes at different drying stages.
Discrimination for drying stages of shiitakes by PLS-DA and SVM-C.
| E-nose | Accuracy rate(%) | ||||||
|---|---|---|---|---|---|---|---|
| Fresh | Early stage | Middle stage | Late stage | Total | |||
| PLS-DA (LVs:1) | Validation | 100 | 88.89 | 82.22 | 95.56 | 91.67 | 91.25 |
| Prediction | 100 | 86.67 | 80.00 | 93.33 | 90.00 | ||
| SVM-C (gamma:0.01;cost:100) | Validation | 100 | 91.11 | 95.56 | 97.78 | 96.11 | 95.83 |
| Prediction | 100 | 86.67 | 93.33 | 93.33 | 93.33 | ||
4 Conclusions
The potential of commercial E-nose system in the classification of shiitakes during drying process was investigated in this study. HS/GC-MS data showed that the differences in volatiles of shiitakes produced during drying process were mainly caused by the compositions and contents of sulfurs and alcohols, particularly 1-octene-3-ol, 1, 2, 4-trithiolane and 1, 2, 4, 5-tetrathiane. The PCA results of E-nose responses were consistent with that of HS/GC-MS, and shiitakes at four different drying stages can be successfully discriminated from each other. In addition, the sensors that were sensitive to the smell of shiitakes during drying process were screened out, namely, R2, R6, R7, R8 and R9 (sensitive to sulfur compounds, alkanes, alcohols and aromatic compounds). The discriminant models were established based on PLS-DA and SVM-C algorithms, and the overall classification accuracy rates were 91.25 % and 95.83 %, respectively. However, the commercial PEN3 E-nose cannot be used for online detection of the VOCs of shiitakes during drying process in practice due to its hardware structure and simple analysis system. Therefore, it is necessary to develop an E-nose that can be used for rapid and real-time discrimination for shiitakes. This study provides a theoretical basis for monitoring the quality of shiitakes during drying process, and also useful information for self-designing of simple and accurate E-nose for on-line or off-line detection of shiitakes during drying.
Acknowledgements
This work was financially supported by the Thirteenth -Five-Year National Key R&D Programme (2017YFD0400904).
Compliance with ethical standards
Conflict of interest
The authors declare that they have no conflict of interest.
References
[1] Reis FS, Barros L, Martins A, Ferreira IC. Chemical composition and nutritional value of the most widely appreciated cultivated mushrooms: an inter-species comparative study. Food Chem Toxicol. 2012;50:191–7. DOI: 10.1016/j.fct.2011.10.056.Search in Google Scholar
[2] Caglarirma N. The nutrients of exotic mushrooms (Lentinula edodes and Pleurotus species) and an estimated approach to the volatile compounds. Food Chem. 2007;105:1188–94. DOI: 10.1016/j.foodchem.2007.02.021.Search in Google Scholar
[3] Mittal TC, Sharma SR, Muker JS, Gupta SK. Drying behaviour and change in colour and textural properties of mushroom during drying. Int J Food Eng. 2012;8:1–7. DOI: 10.1515/1556-3758.1696.Search in Google Scholar
[4] Çakmak RŞ, Tekeoğlu O, Bozkır H, Ergün AR, Baysal T. Effects of electrical and sonication pretreatments on the drying rate and quality of mushrooms. LWT Food Sci Technol. 2016;69:197–202. DOI: 10.1016/j.lwt.2016.01.032.Search in Google Scholar
[5] Huang Q, Chen L. Effect of different drying method on volatile aroma compounds of Lactarius deliciosus. J Food Process Technol. 2016;7:2–5. DOI: 10.4172/2157-7110.1000615.Search in Google Scholar
[6] Artnaseaw A, Theerakulpisut S, Benjapiyaporn C. Drying characteristics of shiitake mushroom and Jinda chili during vacuum heat pump drying. Food Bioprod Process. 2010;88:105–14. DOI: 10.1016/j.fbp.2009.09.006.Search in Google Scholar
[7] Kiani S, Minaei S, Ghasemi-Varnamkhasti M. Real-time aroma monitoring of mint (Mentha spicata L.) leaves during the drying process using electronic nose system. Measurement. 2018;124:447–52. DOI: 10.1016/j.measurement.2018.03.033.Search in Google Scholar
[8] Ghasemi-Varnamkhasti M, Aghbashlo M. Electronic nose and electronic mucosa as innovative instruments for real-time monitoring of food dryers. Trends Food Sci Technol. 2014;38:158–66. DOI: 10.1016/j.tifs.2014.05.004.Search in Google Scholar
[9] Politowicz J, Lech K, Lipan L, Figiel A, Carbonell-Barrachina ÁA. Volatile composition and sensory profile of shiitakes as affected by drying method. J Sci Food Agri. 2018;98:1511–21. DOI: 10.1002/jsfa.8622.Search in Google Scholar
[10] Hiraide M, Miyazaki Y, Shibata Y. The smell and odorous components of dried shiitake mushroom, Lentinula edodes I: relationship between sensory evaluations and amounts of odorous components. J Wood Sci. 2004;50:358–64. DOI: 10.1007/s10086-003-0568-0.Search in Google Scholar
[11] Pei F, Yang W, Ma N, Fang Y, Zhao L, An X, et al. Effect of the two drying approaches on the volatile profiles of button mushroom (Agaricus bisporus) by headspace GC–MS and electronic nose. LWT Food Sci Technol. 2016;72:343–50. DOI: 10.1016/j.lwt.2016.05.004.Search in Google Scholar
[12] Hiraide M, Yokoyama I, Miyazaki Y. The smell and odorous components of dried shiitake mushroom, Lentinula edodes II: sensory evaluation by ordinary people. J Wood Sci. 2005;51:628–33. DOI: 10.1007/s10086-004-0689-0.Search in Google Scholar
[13] Tian Y, Zhao Y, Huang J, Zeng H, Zheng B. Effects of different drying methods on the product quality and volatile compounds of whole shiitakes. Food Chem. 2016;197:714–22. DOI: 10.1016/j.foodchem.2015.11.029.Search in Google Scholar
[14] Li Z, Raghavan GS, Wang N, Gariepy Y. Real-time, volatile-detection-assisted control for microwave drying. Comput Electron Agric. 2009;69:177–84. DOI: 10.1016/j.compag.2009.08.002.Search in Google Scholar
[15] Capone S, Tufariello M, Francioso L, Montagna G, Casino F, Leone A, et al. Aroma analysis by GC/MS and electronic nose dedicated to Negroamaro and Primitivo typical Italian Apulian wines. Sens Actuator B Chem. 2013;179:259–69. DOI: 10.1016/j.snb.2012.10.142.Search in Google Scholar
[16] Liu Q, Zhao N, Zhou D, Sun Y, Sun K, Pan L, et al. Discrimination and growth tracking of fungi contamination in peaches using electronic nose. Food Chem. 2018;262:226–34. DOI: 10.1016/j.foodchem.2018.04.100.Search in Google Scholar
[17] Martin A, Mallikarjunan K, Zoecklein BW. Discrimination of wines produced from Cabernet Sauvignon grapes treated with aqueous ethanol post-bloom using an electronic nose. Int J Food Eng. 2008;4:1–14. DOI: 10.2202/1556-3758.1410.Search in Google Scholar
[18] Li Q, Yu X, Xu L, Gao J. Novel method for the producing area identification of Zhongning Goji berries by electronic nose. Food Chem. 2017;221:1113–19. DOI: 10.1016/j.foodchem.2016.11.049.Search in Google Scholar
[19] Zhou J, Feng T, Ye R. Differentiation of eight commercial mushrooms by electronic nose and gas chromatography-mass spectrometry. J Sens. 2015;2015:1–14. DOI: 10.1155/2015/374013.Search in Google Scholar
[20] Cheng H, Chen J, Chen S, Wu D, Liu D, Ye X. Characterization of aroma-active volatiles in three Chinese bayberry (Myrica rubra) cultivars using GC–MS–olfactometry and an electronic nose combined with principal component analysis. Food Res Int. 2015;72:8–15. DOI: 10.1016/j.foodres.2015.03.006.Search in Google Scholar
[21] Chen Q, Song J, Bi J, Meng X, Wu X. Characterization of volatile profile from ten different varieties of Chinese jujubes by HS-SPME/GC–MS coupled with E-nose. Food Res Int. 2018;105:605–15. DOI: 10.1016/j.foodres.2017.11.054.Search in Google Scholar
[22] Li Q, Zhang H, Claver IP, Zhu K, Peng W, Zhou H. Effect of different cooking methods on the flavour constituents of mushroom (Agaricus bisporus Sing) soup. Int J Food Sci Tech. 2011;46:1100–8. DOI: 10.1111/j.1365-2621.2011.02592.x.Search in Google Scholar
[23] Li B, Kimatu BM, Li C, Pei F, Hu Q, Zhao L. Analysis of volatile compounds in L. edodes blanched by hot water and microwave. Int J Food Sci Tech. 2017;52:1680–9. DOI: 10.1111/ijfs.13442.Search in Google Scholar
[24] Wu C, Wang Z. Volatile compounds in fresh and processed shiitakes (Lentinus edodes Sing.). Food Sci Technol Res. 2000;6:166–70.Search in Google Scholar
[25] García-Segovia P, Andrés-Bello A, Martínez-Monzó J. Rehydration of air-dried shiitake mushroom (Lentinus edodes) caps: comparison of conventional and vacuum water immersion processes. LWT Food Sci Technol. 2011;44:480–8. DOI: 10.1016/j.lwt.2010.08.010.Search in Google Scholar
[26] AOAC. Official methods of analysis of AOAC international, 15th ed. USA: Association of Official Analytical Chemists, 1995.Search in Google Scholar
[27] Šumić Z, Tepić A, Vidović S, Vakula A, Vladic J, Pavlic B. Drying of shiitake mushrooms in a vacuum dryer and optimization of the process by response surface methodology (RSM). J Food Meas Charact. 2016;10:425–33. DOI: 10.1007/s11694-016-9321-4.Search in Google Scholar
[28] GB 7096-2014: National food safety standard: Edible fungus and its products. China, 2016.Search in Google Scholar
[29] Giri SK, Prasad S. Drying kinetics and rehydration characteristics of microwave-vacuum and convective hot-air dried mushrooms. J Food Eng. 2007;78:512–21. DOI: 10.1016/j.jfoodeng.2005.10.021.Search in Google Scholar
[30] Wang H, Zhang M, Mujumdar AS. Comparison of three new drying methods for drying characteristics and quality of shiitake mushroom (Lentinus edodes). Drying Technol. 2014;32:1791–802. DOI: 10.1080/07373937.2014.947426.Search in Google Scholar
[31] Wang H, Zhang M, Adhikari B. Drying of shiitake mushroom by combining freeze-drying and mid-infrared radiation. Food Bioprod Process. 2015;94:507–17. DOI: 10.1016/j.fbp.2014.07.008.Search in Google Scholar
[32] Cho D, Seo H, Kim K. Analysis of the volatile aroma compounds produced during the growth stages of the shiitake mushrooms (Lentinus edodes). Prev Nutr Food Sci. 2003;8:306–14.DOI: 10.3746/jfn.2003.8.4.306.Search in Google Scholar
[33] Wang J, Li Y, Chen R, Bao J, Yang G. Comparison of volatiles of banana powder dehydrated by vacuum belt drying, freeze-drying and air-drying. Food Chem. 2007;104:1516–21. DOI: 10.1016/j.foodchem.2007.02.029.Search in Google Scholar
[34] Xu S, Sun X, Lü E, Lu H. A modified mean deviation threshold function based on fast Fourier transform and its application in litchi rest storage life recognition using an electronic nose. J Food Meas Charact. 2018;12:867–76. DOI: 10.1007/s11694-017-9701-4.Search in Google Scholar
[35] Xing M, Sun K, Liu Q, Pan L, Tu K. Development of novel electronic nose applied for strawberry freshness detection during storage. Int J Food Eng. 2018;111:1–15. DOI: 10.1515/ijfe-2018-0111.Search in Google Scholar
[36] Jiang S, Wang J. Internal quality detection of Chinese pecans (Carya cathayensis) during storage using electronic nose responses combined with physicochemical methods. Postharvest Biol Technol. 2016;118:17–25. DOI: 10.1007/s11694-017-9701-4.Search in Google Scholar
[37] Wei Z, Wang J, Zhang W. Detecting internal quality of peanuts during storage using electronic nose responses combined with physicochemical methods. Food Chem. 2015;177:89–96. DOI: 10.1016/j.foodchem.2014.12.100.Search in Google Scholar
[38] Beluhan S, Ranogajec A. Chemical composition and non-volatile components of Croatian wild edible mushrooms. Food Chem. 2011;124:1076–82. DOI: 10.1016/j.foodchem.2010.07.081.Search in Google Scholar
[39] Chen CC, Ho CT. Identification of sulfurous compounds of shiitake mushroom (Lentinus edodes sing.). J Agric Food Chem. 1986;34:830–3.Search in Google Scholar
[40] Shiga H, Yoshii H, Ohe H, Yasuda M, Furuta T, Kuwahara H, et al. Encapsulation of shiitake (Lenthinus edodes) aromas by spray drying. Biosci Biotechnol Biochem. 2004;68:66–71. DOI: 10.1271/bbb.68.66.Search in Google Scholar
[41] Tang K, Chiu S, Pan C, Hsieh H, Liang Y, Liu S. Development of a portable electronic nose system for the detection and classification of fruity odors. Sensors. 2010;10:9179–93. DOI: 10.3390/s101009179.Search in Google Scholar
© 2020 Walter de Gruyter GmbH, Berlin/Boston
Articles in the same Issue
- Articles
- Discrimination of Volatiles of Shiitakes (Lentinula edodes) Produced during Drying Process by Electronic Nose
- Influence of Potato Flour on Dough and Steamed Bread Quality and Correlation Analysis
- Microwave-Assisted Extraction and Ultrasound-Assisted Extraction of Bioactive Compounds from Grape Pomace
- Analysis of the Heat Transfer of Ginkgo Biloba Seeds during Radio-Frequency Heating
- The Impact of an Inert Gas Atmosphere on the Kinetics of Changes in the Physical and Chemical Properties of Carrot Lyophilisate
- Special section for selected papers from VI Food Enginering Symposium (Warsaw, Poland)
- The Use of a Hybrid Drying Method with Pre-Osmotic Treatment in Strawberry Bio-Snack Technology
- The Influence of the Agglomeration Process on Stability of Microencapsulated β-Carotene
- The Impact of the Pre-Treatment in Ethanol Solution on the Drying Kinetics and Selected Properties of Convective Dried Apples
- Influence of the Freeze-drying Conditions on the Physicochemical Properties and Grinding Characteristics of Kiwi
- The Influence of Osmotic Dehydration Conditions on Drying Kinetics and Total Carotenoid Content of Kiwiberry (Actinidia Arguta)