Visualization and Interaction with Multiple Devices. A Case Study on Reachability of Remote Areas for Emergency Management
-
Jordi Tost
Jordi Tost is since 2015 a research associate at the Interaction Design Lab (IDL) of the University of Applied Sciences Potsdam. He received a bachelor’s degree in Audiovisual Systems Engineering from the Technical University of Catalonia and a Master’s degree in Interface Design from the University of Applied Sciences Potsdam. His research focuses on Human-Computer Interaction (HCI), Information Visualization and User-Centered Design.
 and
Frank Heidmann
and
Frank Heidmann
Dr. Frank Heidmann is a professor of human-computer interaction and head of the Interaction Design Lab (IDL) at FH;P (Potsdam University of Applied Sciences). He teaches user experience and human-computer interaction, and conducts research on geographic visualization and natural user interfaces for smart environments, smart cities, and ubiquitous computing.

Abstract
When a hazard event strikes, the reachability of affected areas is a significant factor that can determine if the situation becomes a disaster. Decision makers have to react quickly while under stress to tasks that depend on the road network, such as management of relief operations, planning of evacuation routes, or food and first aid distribution. In this paper we present an approach for exploring and validating reachability of remote areas through visualization with an interactive tabletop and tablets. We propose a simple way to combine and visualize data from scientists and communities to provide insights into area reachability, as well as the likely impacts of future hazard events on access routes. Moreover, our interface introduces an approach to assess alternative accessibility options to isolated settlements by helicopter or off-road routes that builds on satellite data and interactive collaborative mapping. This set of visualization and interaction techniques facilitates the formation of risk scenarios for better planning, preparedness and response activities. We developed our research with a case study of landslide threat for an area in Colombia.
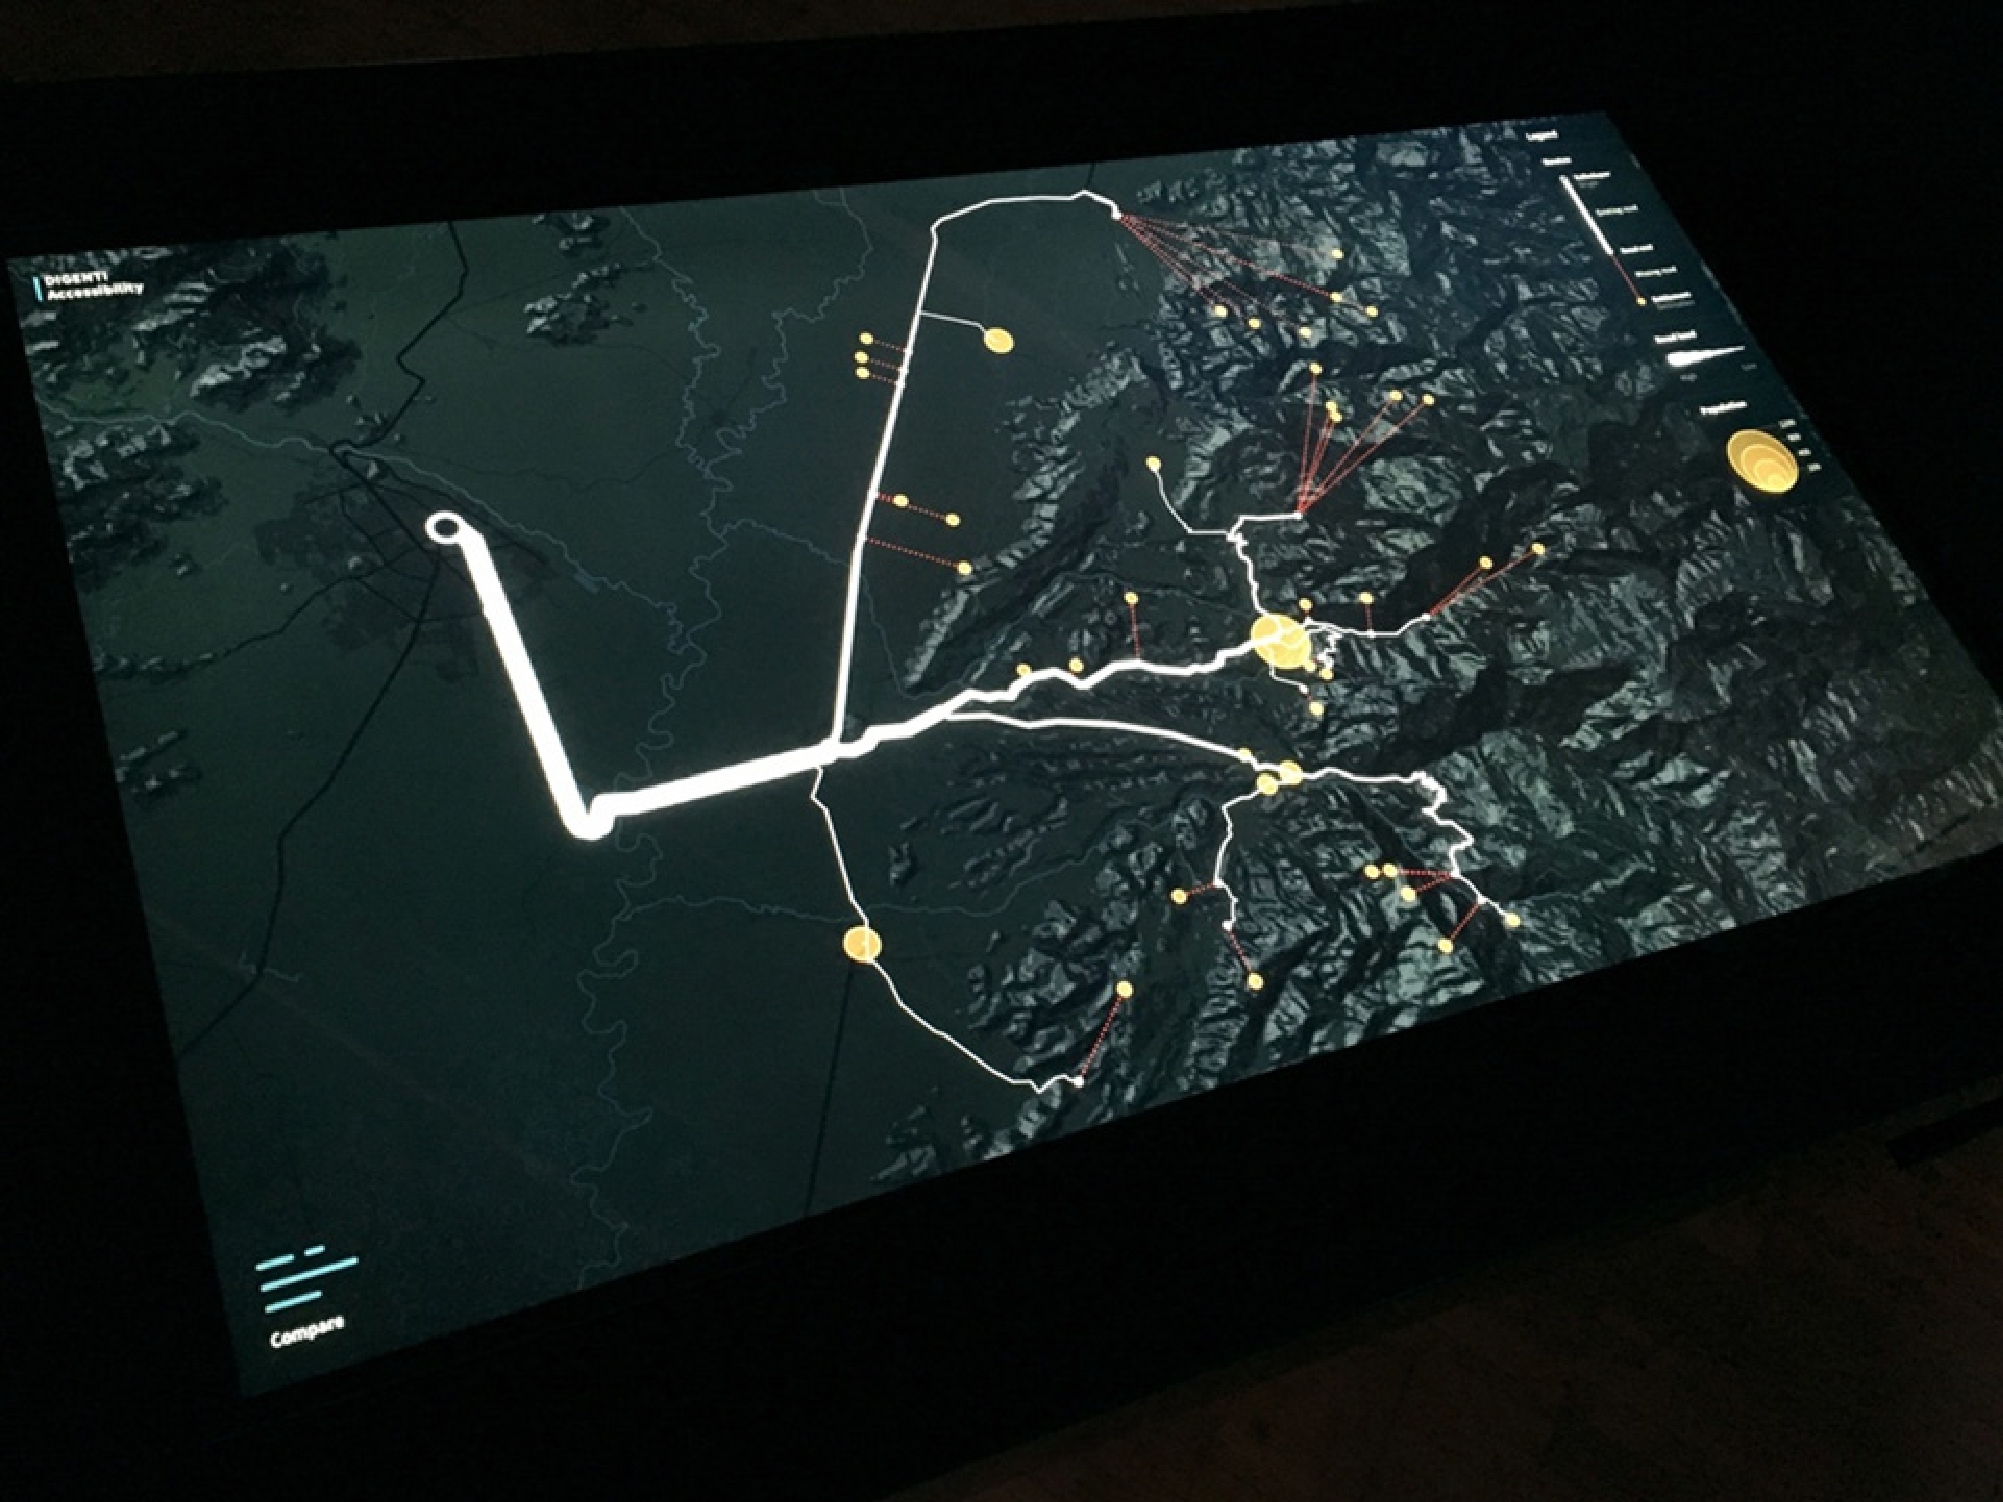
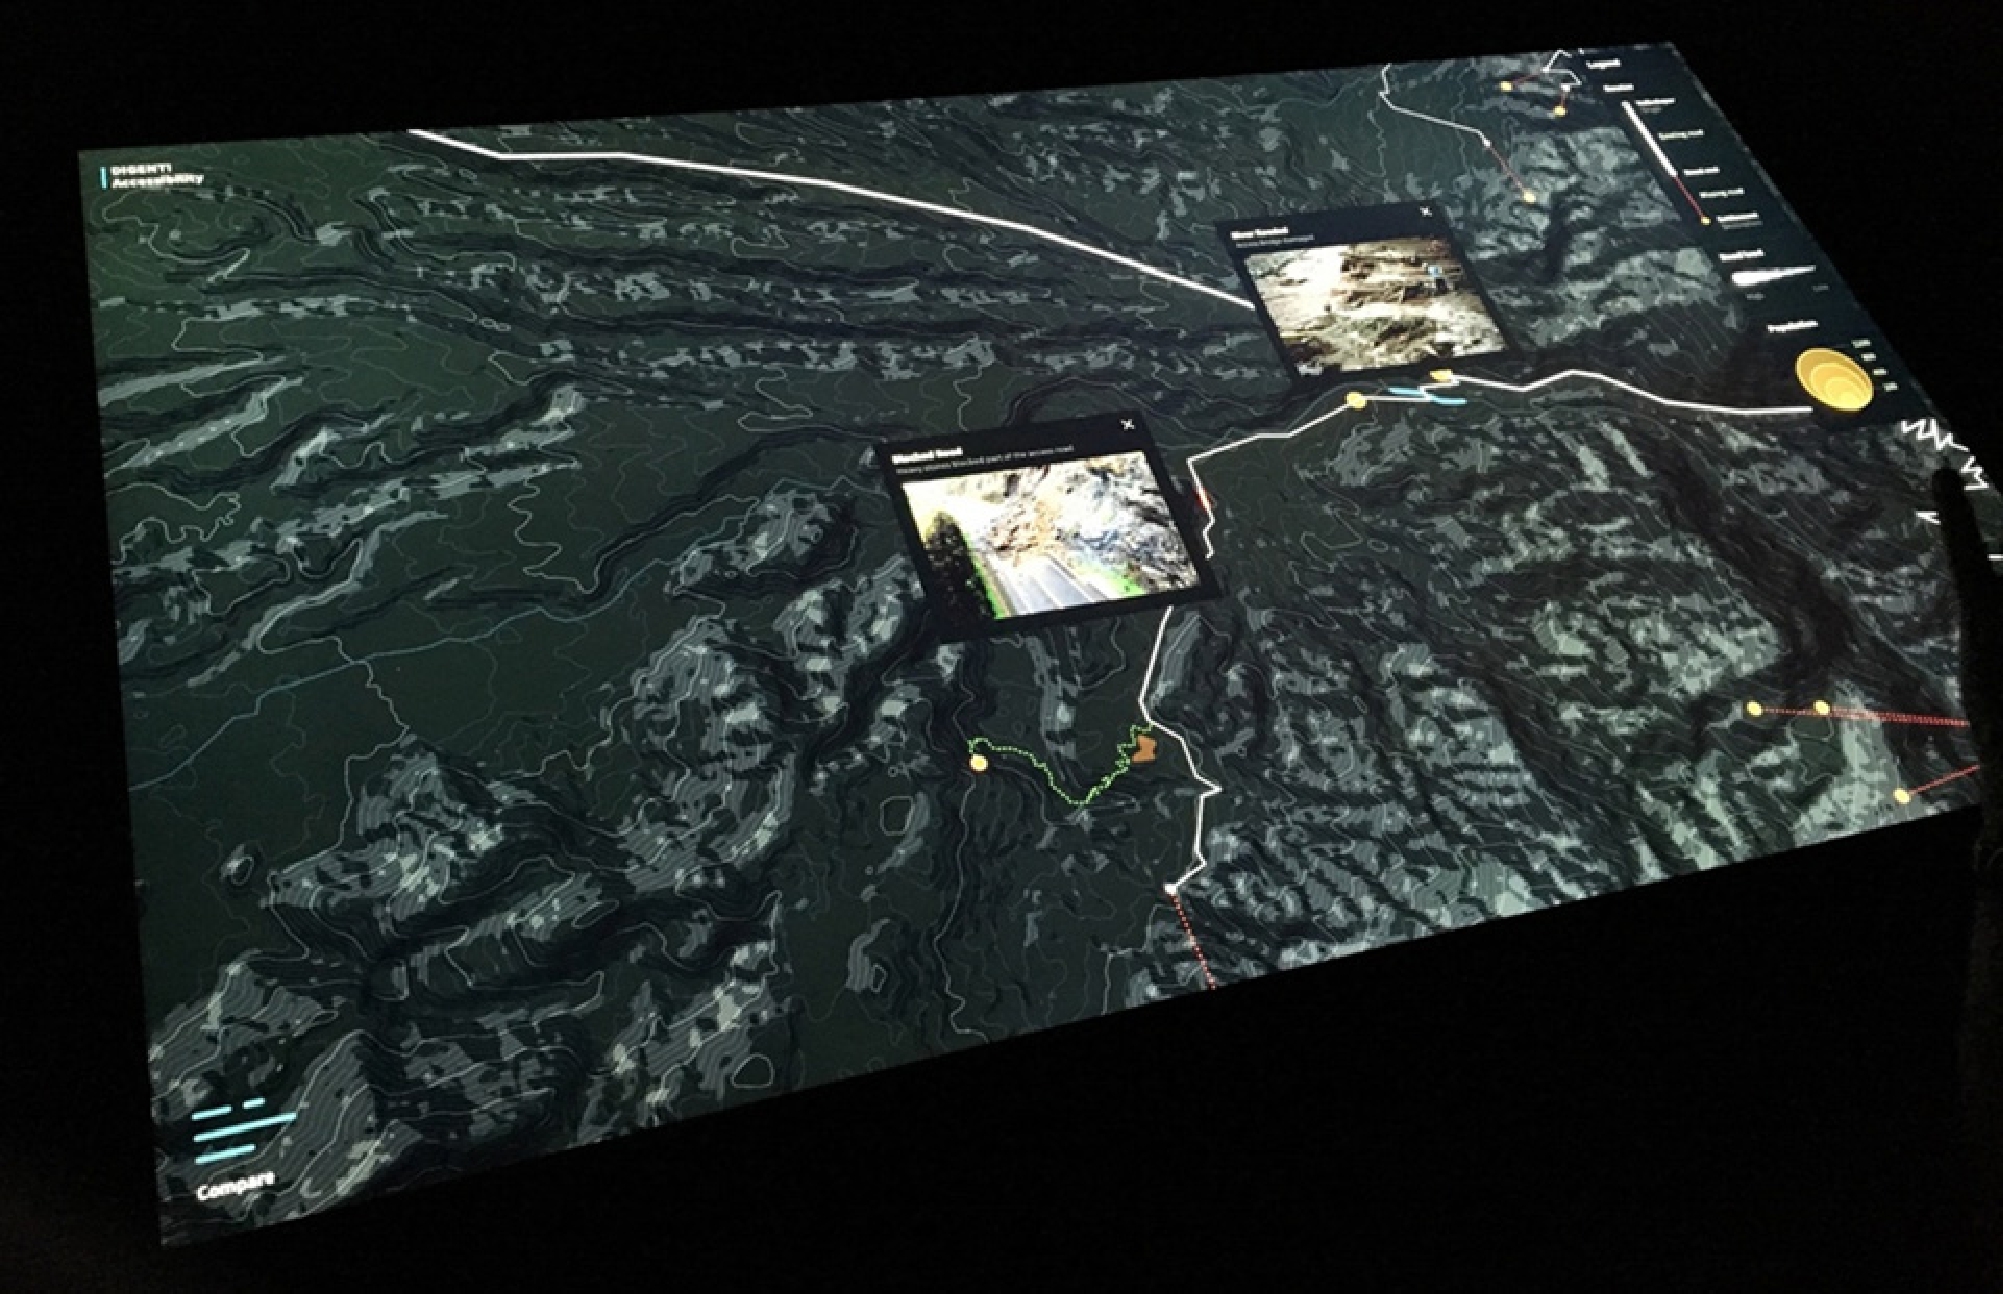
Area reachability visualization in a tabletop.
1 Introduction
In recent years, increasing amounts of data from multiple sources, such as satellite-based data in ever-improving resolutions [52], official or collaboratively mapped infrastructure data [34] or volunteered geographic information (VGI), amongst others, have become available to support decision-making in disaster management. However, in high-stress scenarios, where crisis managers need a fast situation overview with the lowest cognitive workload, this apparent benefit may also lead to information overload [8], [45]. This has raised the question of what the role is of geovisualization and human-computer interaction (HCI) in addressing this problem.
Several research projects have explored the use of interactive tabletops, multi-device or multi-surface environments as tools in emergency operation centers, also known as crisis rooms [3], [10], [26]. These approaches aim to provide stakeholders with real-time information for monitoring and planning response tasks and resources during events. Nevertheless, there is little research on analytic tools that, through visualization, facilitate the identification of impact and risk scenarios in advance for better planning, preparedness and response activities.
Reachability of affected areas and mobility within them play an important role in emergencies. Decisions that depend on the road network have to be made continuously: relief teams need to be deployed in affected areas, logistics teams have to distribute humanitarian aid or food, population evacuations have to be coordinated, etc. For these purposes it is challenging to evaluate in advance how reachable specific areas are by road, and the likely impacts that future hazards may have on the road network. To this end, our goal is to propose more effective means of visualizing area reachability and potential threats along roads. We do so for two different user groups: crisis room members and stakeholders on the field.
In this paper we introduce a case study on visual exploration of area reachability on a multi-touch tabletop and tablets for emergency management in the context of landslides. First, our approach facilitates the identification of accessible or isolated areas. Second, it allows users to analyze reachability of particular settlements on demand. This view depicts access travel times with isochrones, as well as critical spots along the access routes that are likely to collapse, in order to detect potential future blockades that would isolate the area. We do so by combining and visualizing satellite-based threat data and up-to-date open infrastructure data by OpenStreetMap [50]. Through visual exploration, we want to allow domain users to gain an understanding of the susceptibilities of a particular area. Additionally, we enable the analysis of alternative accessibility to isolated settlements through helicopter by depicting potential landing sites.
Furthermore, while scientific and community data help users to understand risk scenarios, these data hold uncertainty or may be incomplete, and the situation still needs to be evaluated and validated. To overcome this problem, apart from the multi-touch tabletop for analysis and decision-making in the crisis room, we introduce an interface for tablets for stakeholders on the field for mapping and validation purposes and task execution. This interface, based on the same visualization principles, allows stakeholders to receive tasks, validate access routes or map new ones by free-form sketching, and map further spatial data by uploading field reports, uploading photos or videos, and drawing damaged areas. This multi-device environment allows active collaboration between different stakeholders and enables information sharing and exchange.
We developed our methodology with a particular case study of landslides in a rural mountainous area in north-east Colombia. The area, situated between the Cesar and La Guajira departments, contains part of the Serranía del Perijá mountain range, and has a variable topography and a typical Caribbean climate with heavy rain and El Niño-related phenomena. This causes a serious threat of landsliding in the area, which, combined with the dispersed spatial distribution of settlements and the lack of infrastructure, creates a high risk of isolation. The research presented in this paper was done in the scope of the DIGENTI project, whose goal is to construct an interdisciplinary methodology for quantifying and communicating the threat of natural hazards, and to provide an interactive guide for policy and decision makers in the field of disaster management. We addressed our challenges in close cooperation with experts from the geological remote sensing and disaster management domains.
In the following we will summarize related works and introduce the user-centered design (UCD) process and the design goals extracted from it. Then, we will present the system, explain our design decisions concerning visualization and interactions, and discuss our findings and lessons learned from a preliminary evaluation with domain experts at the Colombian National Unit for Disaster Risk Management (UNGRD).
2 Related Work
Past research has shown that transport infrastructure itself can be a crucial factor of risk [18]. Decisions based on area reachability have to be constantly made, and decision makers need an understanding of the susceptibilities of the local road network, as well as to identify risk scenarios that may be caused by the impact of natural hazards. While there is an interest by experts in performing such analysis for planning, preparedness and mitigation, there is still a lack of visualization tools and interactive systems that facilitate such pre-event analyses, which makes emergency response mostly a reactive process.
2.1 Tabletops and Surfaces
Work practices in disaster management are traditionally paper-based. This adds extra difficulty when designing novel alternative systems in a field where users are sometimes still reticent to trust new digital tools. To this end, HCI researchers have considered the importance of human factors and natural interaction by designing alternative systems that are based on multi-modal, multi-touch interactions. Related research has investigated the use of large tabletops for supporting collaborative planning during emergency situations using finger and pen gestures [14], [42]. The useTable [36] explores the use of such novel interaction techniques in interfaces for real-world applications, and builds on a user and application centered process in collaboration with domain experts from the German Federal Agency for Technical Relief (Technisches Hilfswerk/THW). useTable enables task assigning, information sharing, and integrates tools that assist the planning of mobile network coverage and the planning of routes for water transportation in real-time with the help of sketch input and aided by additional data. The evaluation with expert domain users confirms that new interaction techniques can enable significant improvements that provide a real benefit to the end-users, and that the use of a user-centered design approach is essential for developing usable applications for real-world scenarios. OrMiS [3] supports simulation-based training for the military on a tabletop interface which enables users to analyze terrain, discuss unit dispositions, and introduces a technique for planning routes using free-form sketching. In contrast to these approaches, our system incorporates the use of novel visualization techniques for supporting decision-making for a specific application (reachability analysis). Moreover, besides supporting face-to-face collaboration on the tabletop, we introduce collaboration between two different user roles (decision makers in the control room and stakeholders on the field).
Additionally, in recent years, people are increasingly using multiple devices in a shared information space by using cross-device interactions. Research on multi-device environments and cross-device interactions has opened new opportunities for interoperability and collaborative work between multiple users. In the disaster management domain, previous research projects have combined multiple heterogeneous devices in multi-surface environments to examine different ways in which interactions can take place [48], for example for communication, information sharing and collaboration in emergency response [10]. Similar interaction methods have been also combined in other work domains, such as air-traffic control [23]. Although the potential benefit that cross-device interactions can provide to different application domains has been shown, there are still challenges to address before they can be successfully applied in everyday scenarios [22]. Houben et al. point out that cross-device interactions will not become a reality in practice if they require extra effort and time from users. This is especially challenging in the disaster management domain, where action has to be taken rapidly and efficiently.
Unlike the above-mentioned approaches, which mostly rely on device technologies and interaction techniques, we propose the use of basic interaction methods with established simple touch gestures so that users can focus on the visual analysis of the dataset. The core of our methodology is visualization and visual exploration. Interactive visualizations are a well-established way to communicate complex data to different stakeholders and user groups. However, the medium through which visualizations are accessed also plays an important role. Isenberg et al. [25] argue that interactive surfaces can make insight formation more attainable for users by offering more engaging ways to explore visualizations. Since our system is geared towards users that are not used to novel interactive tools and who are reluctant to change traditional work practices, our emphasis is on creating a compelling visual language and simple interactivity that is easy to understand. The use of aesthetically pleasing visualizations has been proven successful for engaging the use of interactive systems and facilitating insight formation both with experts [1] and casual users [31].
By combining multiple complex datasets in a simple format, we want to allow users to gain new insights about possible risk scenarios. By designing our system for tabletop and tablets, we want to create a space for discussion, insight sharing and collaborative decision-making.
2.2 Transport Infrastructure as a Vulnerability Factor
The vulnerability of transport infrastructure has been modeled with multiple methods that estimate the performance of infrastructure systems in disasters [16]. These methods are mostly based on mathematical models that quantify how susceptible a network is to malfunction given an adverse event such as a hazard. But these calculate general vulnerability indices for a network and are neither based on hazard data nor present a visual approach for real-world use. While Pellicani et al. [38] map landslide susceptibility and risk along road corridors in a visual way, the goal was to develop predictive models based on historical data, and not to enable a visual analysis of the resulting dataset to link critical areas with the reachability and mobility of the study region. For practical purposes (e.g. field operations, etc.), there is a lack of tools that show the georeferenced potential local threat to infrastructure and that use geospatial mapping to visualize which areas can represent a threat to vital infrastructure in case of a hazard. In other words, it is important to know “what is the vulnerability index of my local road network?”, but for practical use, it is necessary to know “which settlements in the area are isolated from the road network?”, or “which spots on a road are susceptible to being damaged or blocked?”. Our challenge is how to assess the threat to infrastructure in a more direct, visual way.
2.3 Hazard Data and Emergency Mapping
In terms of data, remote sensing offers several possibilities to generate threat and hazard maps for risk assessment, including damage assessment for disaster response and recovery using high resolution images or, for example, detecting road damages after events [11]. The use of volunteered geographic information has been also shown effective after a disaster for road damage assessment [46]. For example, OpenStreetMap has shown the potential of open collaborative mapping for disaster relief, as shown after events like the Haiti Earthquake 2010 [54] or the Nepal Earthquake 2015 [39]. During disasters, a large community of volunteers works on keeping maps updated by rapidly mapping damages and by completing areas that were not mapped before [24], [37]. This makes it possible to create reliable routing services for emergency vehicles that use up-to-date infrastructure data [32].
Information visualization plays an essential role in mitigating information overload [8], [45]. Its importance for making sense of large amounts of data and for supporting decision-making has already been demonstrated [5]. Especially for high-stress situations during emergency response, visual representation has been proven useful for enhancing the user’s ability to process information [12]. Borzo [4] recommends considering both the characteristics of decision makers and decision tasks in order to make the relevant insights stand out for each of them. For example, PetaJakarta.org [21] uses two different abstraction levels depending on the user role and the tasks that they need to solve using the data: the interface provides the information at a city scale for decision makers in the crisis room, and at a street scale for stakeholders on the field. Although the problem of information overload is clear and the power of information visualization to deal with it has been already proven in numerous contexts, there is a lack of research that applies it in the field of disaster management in real scenarios. In this paper, we deal with this by proposing a visualization solution that combines multiple datasets to depict area reachability and the threat to the road network in a simple and compelling way.
3 User-Centered Design Observations
User-Centered Design (UCD) describes the process in which target users are involved in the design and development of an interface in order to ensure its success. This methodology includes activities like gathering of input and feedback from domain experts and facilitation of co-creation workshop sessions with these experts. UCD increasingly has been recommended for interactive maps [17], [44]. Work practices in disaster management are traditionally paper-based. Domain stakeholders have little or no experience with digital tools, and are usually reticent to change their workflow. We believe that UCD facilitates the success of new digital interfaces in the domain of disaster management by involving domain stakeholders in the design process. In this chapter we briefly describe some observations about our UCD approach.
In Colombia, the Colombian National Unit for Disaster Risk Management (UNGRD) coordinates all protocols regarding hazard risk mitigation and disaster management. A direct participation of experts from the UNGRD was not possible at early stages of design, and as a result, we prioritized the development of a series of data processing and visualization experiments with the available datasets. Through prototyping, we identified early gaps and requirements and learned about the study domain before domain experts from Colombia could get involved into the process.
Once the contact with the UNGRD was established, we divided our work domain analysis in two parts. First, we conducted a series of remote expert interviews with stakeholders from the UNGRD, in order to: learn about their protocols and workflows, find out about available data and maps, available interactive tools and their functionality, and reflect on our ideas and research in light of this new information. Second, we organized a workshop in Colombia, attended by expert stakeholders from different local, regional and national entities, such as Fire Brigades, Civil Defense, National Police, Red Cross, the National Army and the UNGRD itself, among others. In preparation for the workshop, we prepared an online questionnaire for the workshop participants. The goal of the questionnaire was to get a closer look at participants’ daily personal work practices, as well as the tools, maps and data available to them on a daily basis. In addition, we wanted to gain some insights about their knowledge of visualization and interactive tools. The questionnaire and interview results allowed us to design the workshop exercises.
In the workshop at the UNGRD we organized different co-creation activities in mixed groups. To begin, we showed participants a selection of early prototypes, as well as an early working version of the interface concept presented in this paper, which at that stage was for an interactive tabletop only. Showing experts working prototypes and early versions of software has been shown to be beneficial by Roth et al. [43] “to prompt useful ideas and reactions that users might not otherwise think to offer”. Since not all participants were familiar with visualization or interactive interfaces, this established a common framework for discussion, where participants reflected upon their own expertise and experience in the domain, and on their personal role within the disaster management process. These discussions served as well as a preliminary evaluation of our interface concept and prototype; participants highlighted positive aspects and areas for improvement, suggested new ideas, and identified scenarios for potential real-world applications of the system.
Co-creation activities and discussions revealed a number of potential improvements that could be addressed through visualization and interface design. The study also confirmed the importance of performing mobility and reachability analyses at different stages of disaster management: for mitigation, and both the preparation and execution of the response (e.g. evacuations, access to affected areas, transportation of victims to hospitals, logistics, etc.). The visual analysis of reachability and vulnerabilities in the road network was set therefore as a priority. With these insights, we refined, complemented, and prioritized the system requirements. These requirements established the design goals, which are explained in detail in the next section.
4 Design Goals
According to the requirements gathered from domain users, and gaps, challenges and opportunities identified from related work, we defined a set of visual design and usability goals for our system. In this section, we describe these goals, relating them to particular insights extracted from our user-centered design process.
4.1 Attractive Visual Language with Simple Interactions
As our interface is intended for users with little or no experience using visualization and interactive tools in their work, our emphasis is on a simple and attractive visual design. We also see it as beneficial to keep interactions simple. The system has to be fluid and responsive when interacting with the dataset. With simple visual and usability patterns we aim to attract reluctant domain users to use the system, build confidence and engage in discussion and collaboration.
4.2 Facilitate Insight Formation and Identification of Scenarios of Risk
Domain experts pointed out the importance of identifying risk scenarios in advance, in a visual way. With these scenarios, according policies and measures to reduce risk can be taken, and emergency response can be planned to be more effective. We aim to support insight formation through simple and attractive visualizations that are easy to understand. By achieving a fast situation overview through visualization, we want to facilitate the identification of risk scenarios, in order to improve performance in preparation and planning.
4.3 Reduce Data Complexity
In the feedback and workshop sessions, domain experts explained the messiness and chaos of real-world practices, where information from different sources has to be reviewed separately and in different forms (e.g. paper maps, official reports, Google Maps-based digital maps). We see it as beneficial to first combine different complex data sources in a single system, and then visualize them in a simple form that is tailored to the user role and to the task to perform. Showing the raw datasets would be overwhelming for users, and this requires new ways to deal with the data (e.g. filtering, aggregation). We believe that reducing data complexity through visualization will enable different views into the dataset. This will make task-oriented analysis easier, and will support the gathering of insights for problem solving and decision-making.
4.4 Support Information Sharing, Validation and Collaboration
During the workshop discussions, participants pointed out that a proper system for information sharing between the different institutions and stakeholders does not exist. Which information is available is not completely transparent. We also learned that there are no tools that allow the collection and visualization of multiple datasets from different stakeholders. Our system has to enable access to data for different user groups, as well as be a platform that facilitates knowledge exchange and collaboration between them. Moreover, experts were concerned about the uncertain quality and validity of OpenStreetMap data and thus, about the reliability of predicted routes and time estimations. For effective analysis and decision-making in the control room, experts pointed out importance of validating existing data, as well as gathering new data from the ground. Thus, the system has to keep all data synchronized and allow control room members and stakeholders on the field exchange and work collaboratively.
4.5 Provide Alternative Access Options
According to domain experts, when the access roads to affected areas are blocked, an assessment with helicopters is performed. Moreover, in mountainous areas this alternative accessibility is further needed for assessing settlements in the mountains that are not accessible by road at all (e.g. farms, indigenous reserves, etc.). In practice, the calculation of potential landing sites is a manual process, usually done with paper maps or by analyzing different satellite or aerial imagery, and it can take hours until decision makers give helicopter pilots an estimation of potential landing spots around the target area. This process can take even longer, when decision makers have little to no area knowledge (e.g. international emergency teams). Our interface should provide users an overview of which areas are isolated and provide an overview of potential landing sites in the surroundings. Moreover, during the Nepal Earthquake 2015 the Logistics Cluster team had to plan alternative accessibility (e.g. off-road vehicles or on foot with donkeys) when the delivery of food and first aid to isolated settlements was even not possible with helicopters [27]. Our system should allow users to map off-road routes manually using either satellite imagery or directly on the field.
4.6 Inform but not Decide
One factor that makes experts distrust new interactive tools is when systems decide by themselves. In our case study, remote sensing can identify potential landing sites, but local knowledge and ground truthing are still needed. The system should inform users about different possibilities through visual analysis, but not decide for them. Stakeholders with local knowledge should then decide.
5 Visualization and Interaction Patterns
In order to explore our design goals, we implemented a set of visualization and interaction techniques within a functional prototype. We put special emphasis on the combination of new complex data from different sources, as well as in the design of novel user-centered and ambitious formal-aesthetic forms of visualization. These were designed for specific devices and developed within a real-world case study with partners in Colombia. Moreover, we use basic interaction methods with established simple touch gestures so that users can focus on the visualizations and insight formation.
In this prototype, we propose interfaces for two different devices, each of them covering different needs for domain users with different roles.
First, an interface for a multi-touch tabletop for crisis room members (Figure 2), which gives a situational overview of the overall study area, but also enables a more detailed exploration on demand [49]. With this interface, crisis room members are able to identify risk scenarios, and with them create a space for debate and collaborative decision making.
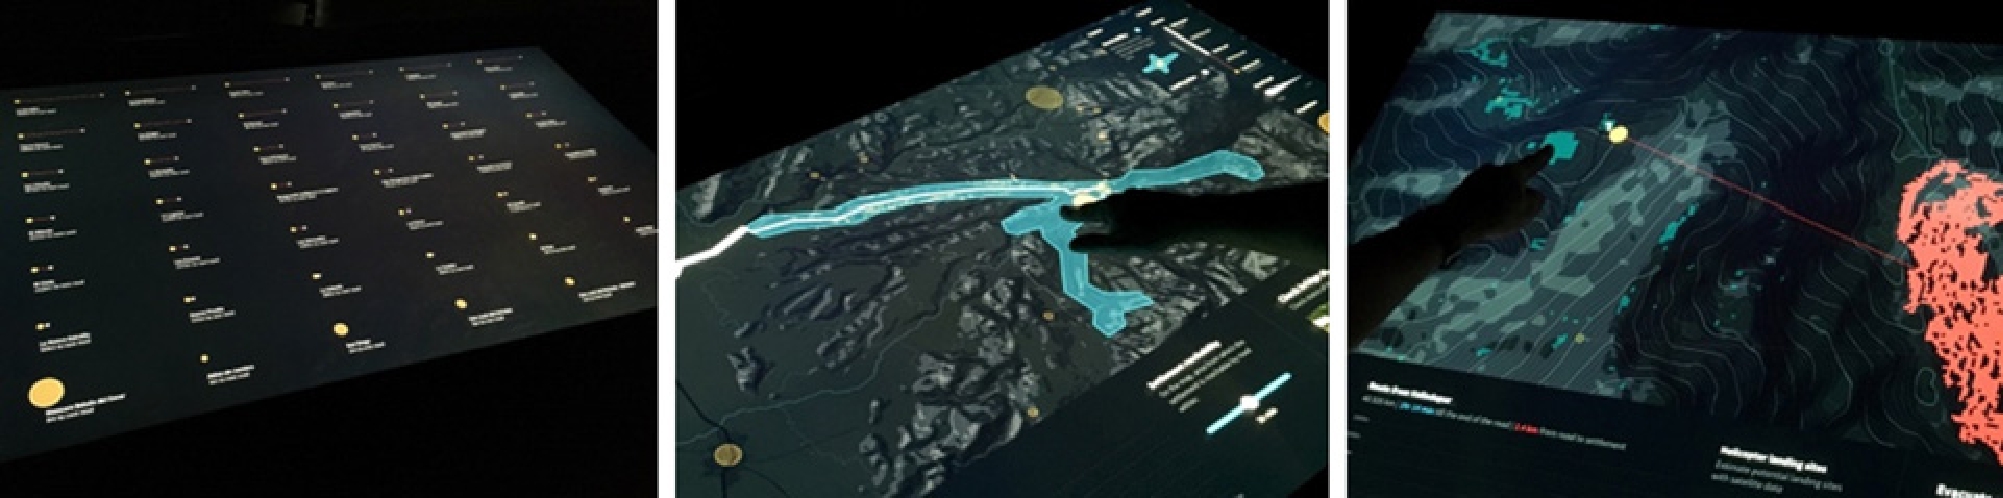
Multi-touch tabletop with (a) settlement to nearest road distance comparison, (b) reachability analysis with isochrones, and (c) analysis of landing sites near to a settlement.
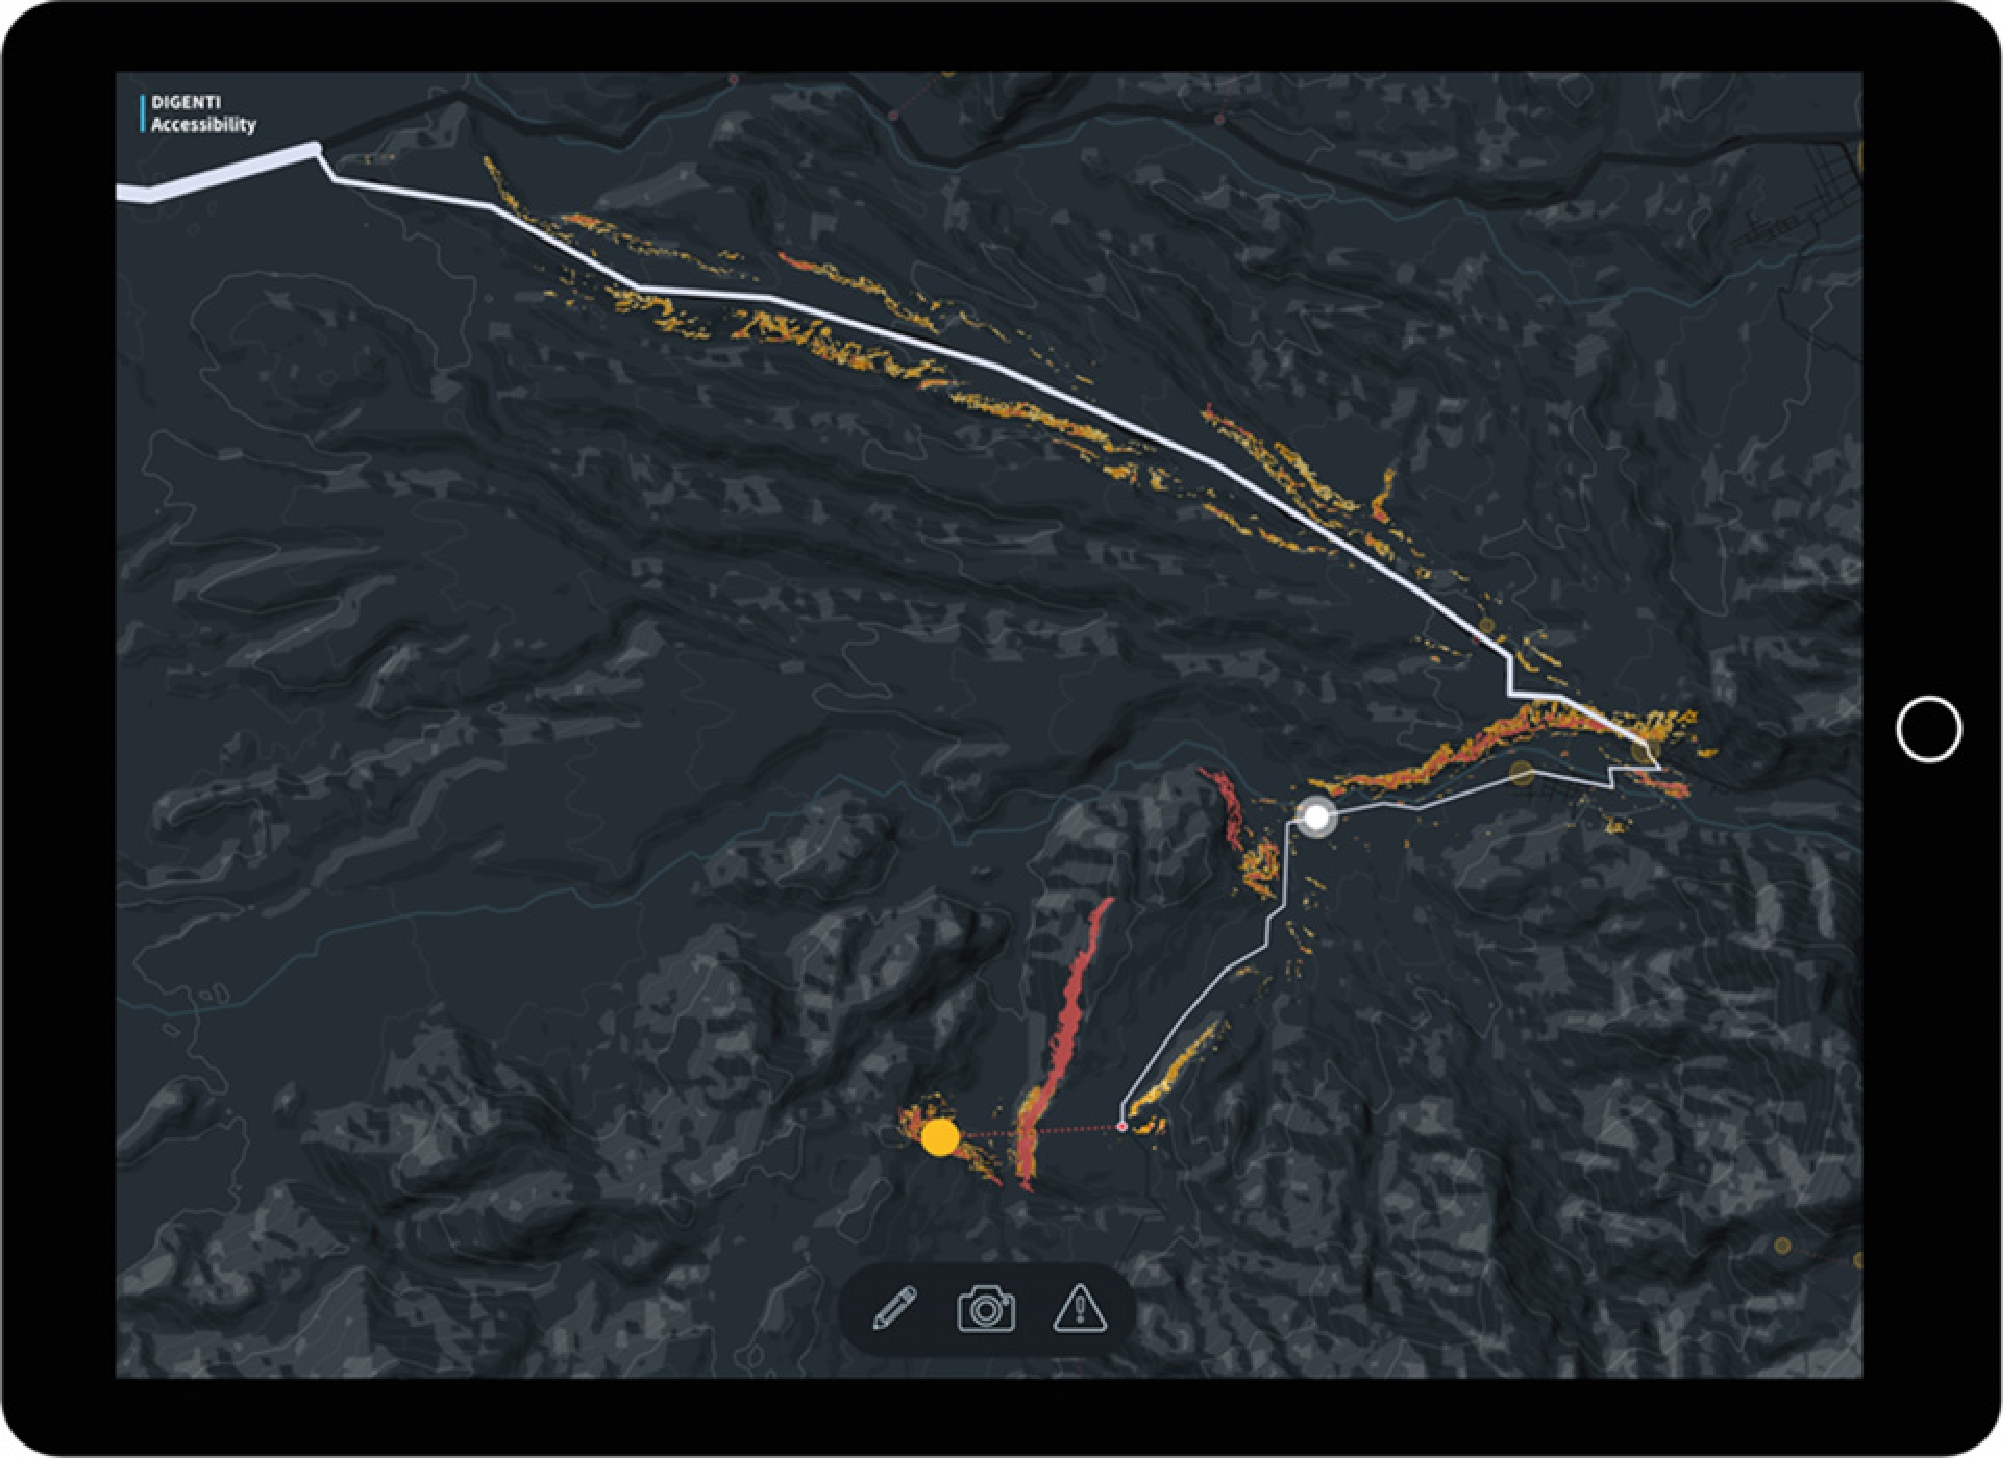
Second, an interface for tablets for stakeholders on the field (Figure 3). With it, they are able to calculate routes for training and validation purposes, accessing detailed information. Threat data is an estimation and thus uncertain; OpenStreetMap data may be incomplete and therefore routing results may be incorrect. With this interface, we want to allow stakeholders on the ground to validate and update data (e.g. roads, estimated road blockades), map further spatial data (e.g. points of interest, draw previously unmapped routes or off-road routes, draw affected or damaged areas, upload photos and videos, etc.).
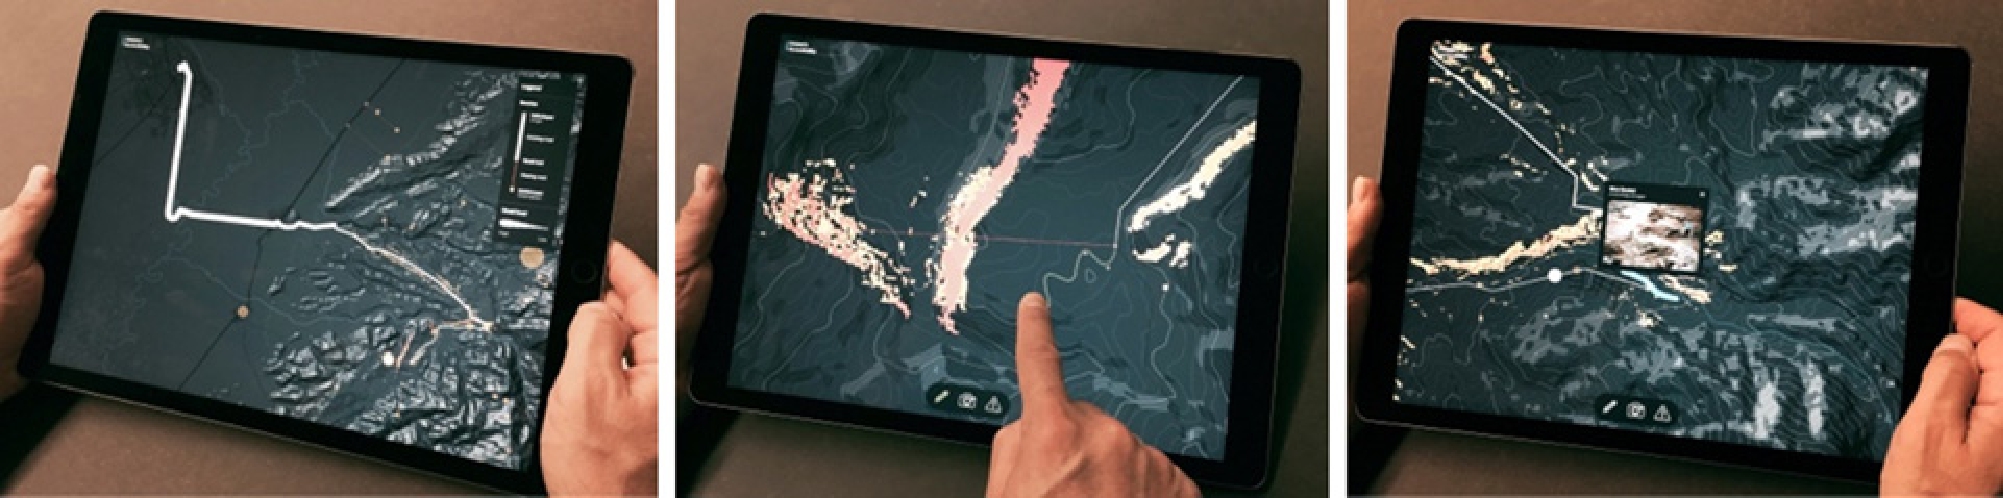
Tablet with (a) route detail, (b) user drawing an off-road route, and (c) user after mapping a flooded street and uploading a photo.
Furthermore, with the tabletop, interface users are able to assign tasks to field units (e.g. validate routes, check off-road access possibilities, etc.), whereas the tablet interface will allow field stakeholders to check these tasks and report further incidents or other relevant information (e.g. street segments in bad condition, landslides, susceptible bridges, etc.).
In the following section, we will describe our datasets and the visualizations and interactions patterns in the system, both for the tabletop and tablet interfaces.
5.1 Data
For our case study’s area of interest, we acquired a new suite of high-resolution landslide potential maps and an estimation of potential helicopter landing sites, both calculated by our partners of the Institute of Earth and Environmental Science of the University of Potsdam. We combined these datasets with OpenStreetMap data.
5.1.1 Landslide Threat Maps
Landslide threat maps are used to depict potential danger from landslides and visualize the possibility of future landsliding throughout a given area. These maps were calculated by Olen and Bookhagen [33], [50] by combining the 12×12-meter TanDEM-X WorldDEM [53] with other environmental data, to calculate the Factor of Safety (FOS, [47]). The resulting dataset estimates local hillslope instabilities and quantifies the probability that a hillslope is stable or not. The resulting areas are classified into the following classes: (1) very unstable, (2) unstable, (3) moderately unstable, (4) moderately stable, and (5) very stable. For instance, in an area with a FOS 1, where the ground is estimated as very unstable, the threat will be high. Otherwise, areas with FOS 4 or 5 are stable and will be safer. The figures used in this paper show only the areas classified with FOS 1 to 3 and these are color-coded with red (FOS 1), orange (FOS 2) and yellow (FOS 3), following established conventions used in hazard maps.
5.1.2 Potential Helicopter Landing Sites
Potential helicopter landing sites were also calculated using satellite data. Using information from the expert interviews we conducted, we assumed that helicopters are able to land in areas with a low slope gradient and free of dense vegetation (e.g. trees). Moreover, landing sites should not contain man-made constructions such as houses, and must be larger than a set minimum size. Our partners from the Institute of Earth and Environmental Science of the University of Potsdam calculated vegetation density and low slope regions in the area of interest. Vegetation density (NDVI) was calculated from Landsat-8 30-meter resolution images, and was classified into a 4-class raster with the following classes: (1) Low vegetation, (2) Low-Medium vegetation, (3) Medium-High vegetation, and (4) High vegetation. Hillslope gradient was calculated using the TanDEM-X WorldDEM and the resulting raster data was classified into 6 classes with values from 0 to 30 degrees (slope angles in degrees). By combining them, we can have first multiple estimations of potential landing sites.
5.1.3 Routing and Infrastructure Data
For routing, we used infrastructure data from the OpenStreetMap dataset, which includes roads, routes, streets, paths, etc. OpenStreetMap has become an important tool for relief and logistics teams during disasters, due to its constant updates of infrastructure status through collaborative mapping by the Humanitarian OSM Team and the mapping community [24], [37].
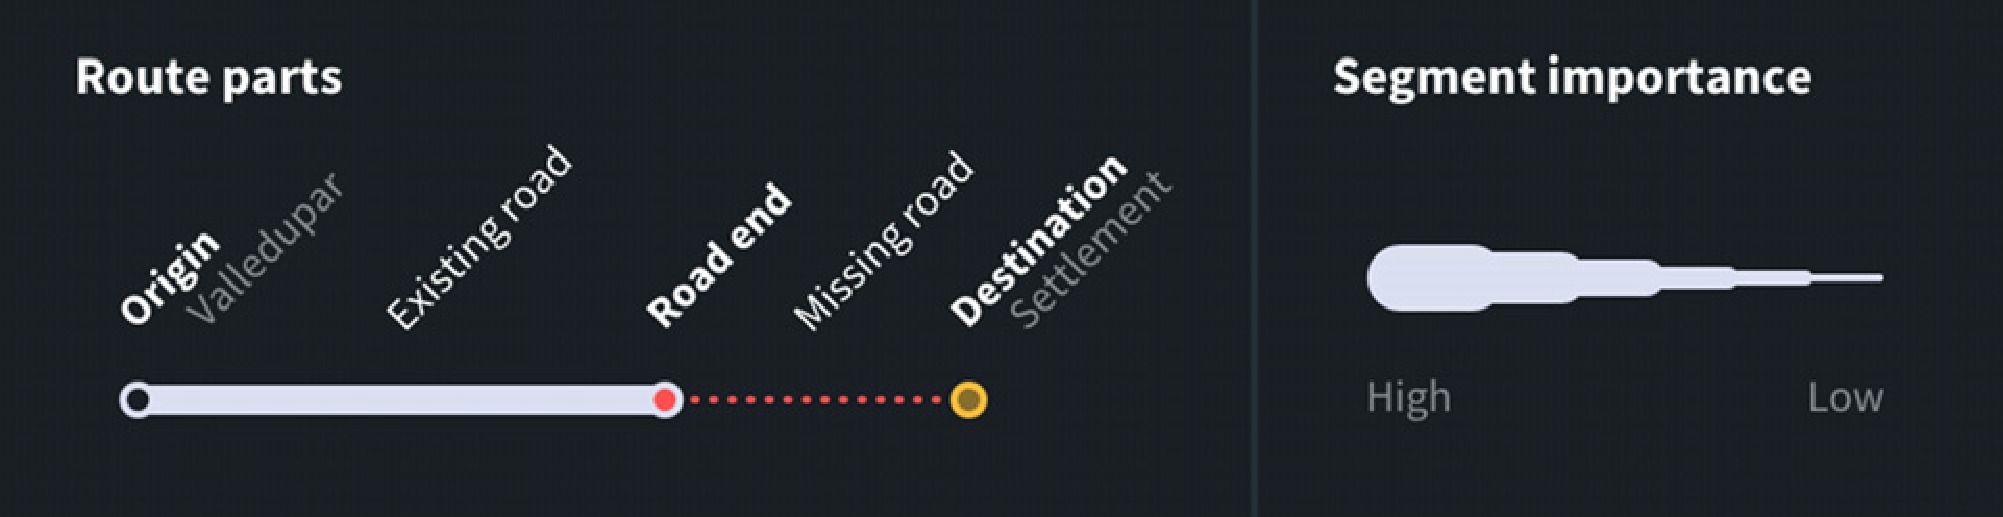
Encoding of routes with (a) route parts, and (b) road segment importance.
5.2 Visual Language
We aimed to create a simple and attractive visual language, in order to make complex data accessible and easy to understand by the domain users. We decided to work with a dark base map for varied reasons. First, we wanted to achieve a more appealing and pleasing design that attracts user’s attention [7]. Second, since the interface is intended as a work tool, a dark color scheme is easier on the eyes when used long periods of time, specially indoors on the big tabletop.
We designed a color scheme with a bright visualization over the dark base map to create a high light-dark contrast that makes the visualization – routes, threat areas, etc. – stand out [2], [6], [9]. We complement this with a minimalistic base map that reduces non-functional detail and keeps only relevant geographic features. With this, we want the base map to stay unobtrusive for the visualization, while still providing local context for orientation. Streets are faded in the base map streets, so active routes stay prominent in the visualization. Moreover, since the areas threatened by landslides have a variable topography, elevation contour lines stand out, specially in high zoom levels where a higher level of local detail is needed.
Due to the domain use, we allow users to switch between the designed map tile and a satellite map. For this, we optimized our color palette so the visualizations work well both over our dark base map and a satellite map.
5.3 Simple Fluid Interactions
We propose the use of simple and direct interactions to enable users to focus on the dataset. Users are able to interact with the map with established touch gestures: tap to select a settlement and basic 2-finger gestures for zooming and panning.
To keep the interaction model simple, we designed our system with only two interactive states: area overview and route detail. The area overview aims to create a fast situation overview, by giving insights on the general reachability of the entire study area. It consists of a map view and a small-multiples view. Detailed information on the reachability of a settlement can be accessed on demand [49]. Once a settlement is selected, the interface gives further insights on the reachability of that particular settlement.
The system implements smooth animations and transitions when switching between states and views. This provides fluidity and helps users to maintain a sense of orientation inside the interface [15]. Fluidity is enhanced by smooth transitions on the map tile when zooming and panning, as well as by immediate feedback on interaction.
5.4 Visualizing Access Routes
To visualize access routes, we encode the multiple route parts and route segments with different visual variables.
We consider the following route parts, which are encoded as follows (Figure 4a):
Existing road segments:white, solid lines. These segments depict the part of a route along an existing road or path.
Missing road segments:red dotted lines. These segments depict the distance from the end of the road to the destination, when the road is missing.
Off-road segments:light green dotted lines. The segments represent off-road routes that have been mapped manually by the users.
The thickness of the road segments (Figure 4b) depicts the importance that each segment has for the network, and is directly proportional to the number of settlements that are accessed through that particular segment. The higher the number of settlements are accessed using the segment, the higher is its importance for the road network, and the thicker the segment’s line is visualized. For example, if the exit road from Valledupar gets blocked or damaged, all settlements in the area will be inaccessible by road. That is the reason why the road segment is visualized with the thickest line. While in transit maps roads are styled by road type and their hierarchy, we decided to style the road segments by their importance for the road network for its relevance for assessing vulnerability. Nevertheless, we should provide users the functionality to switch to see the road type.
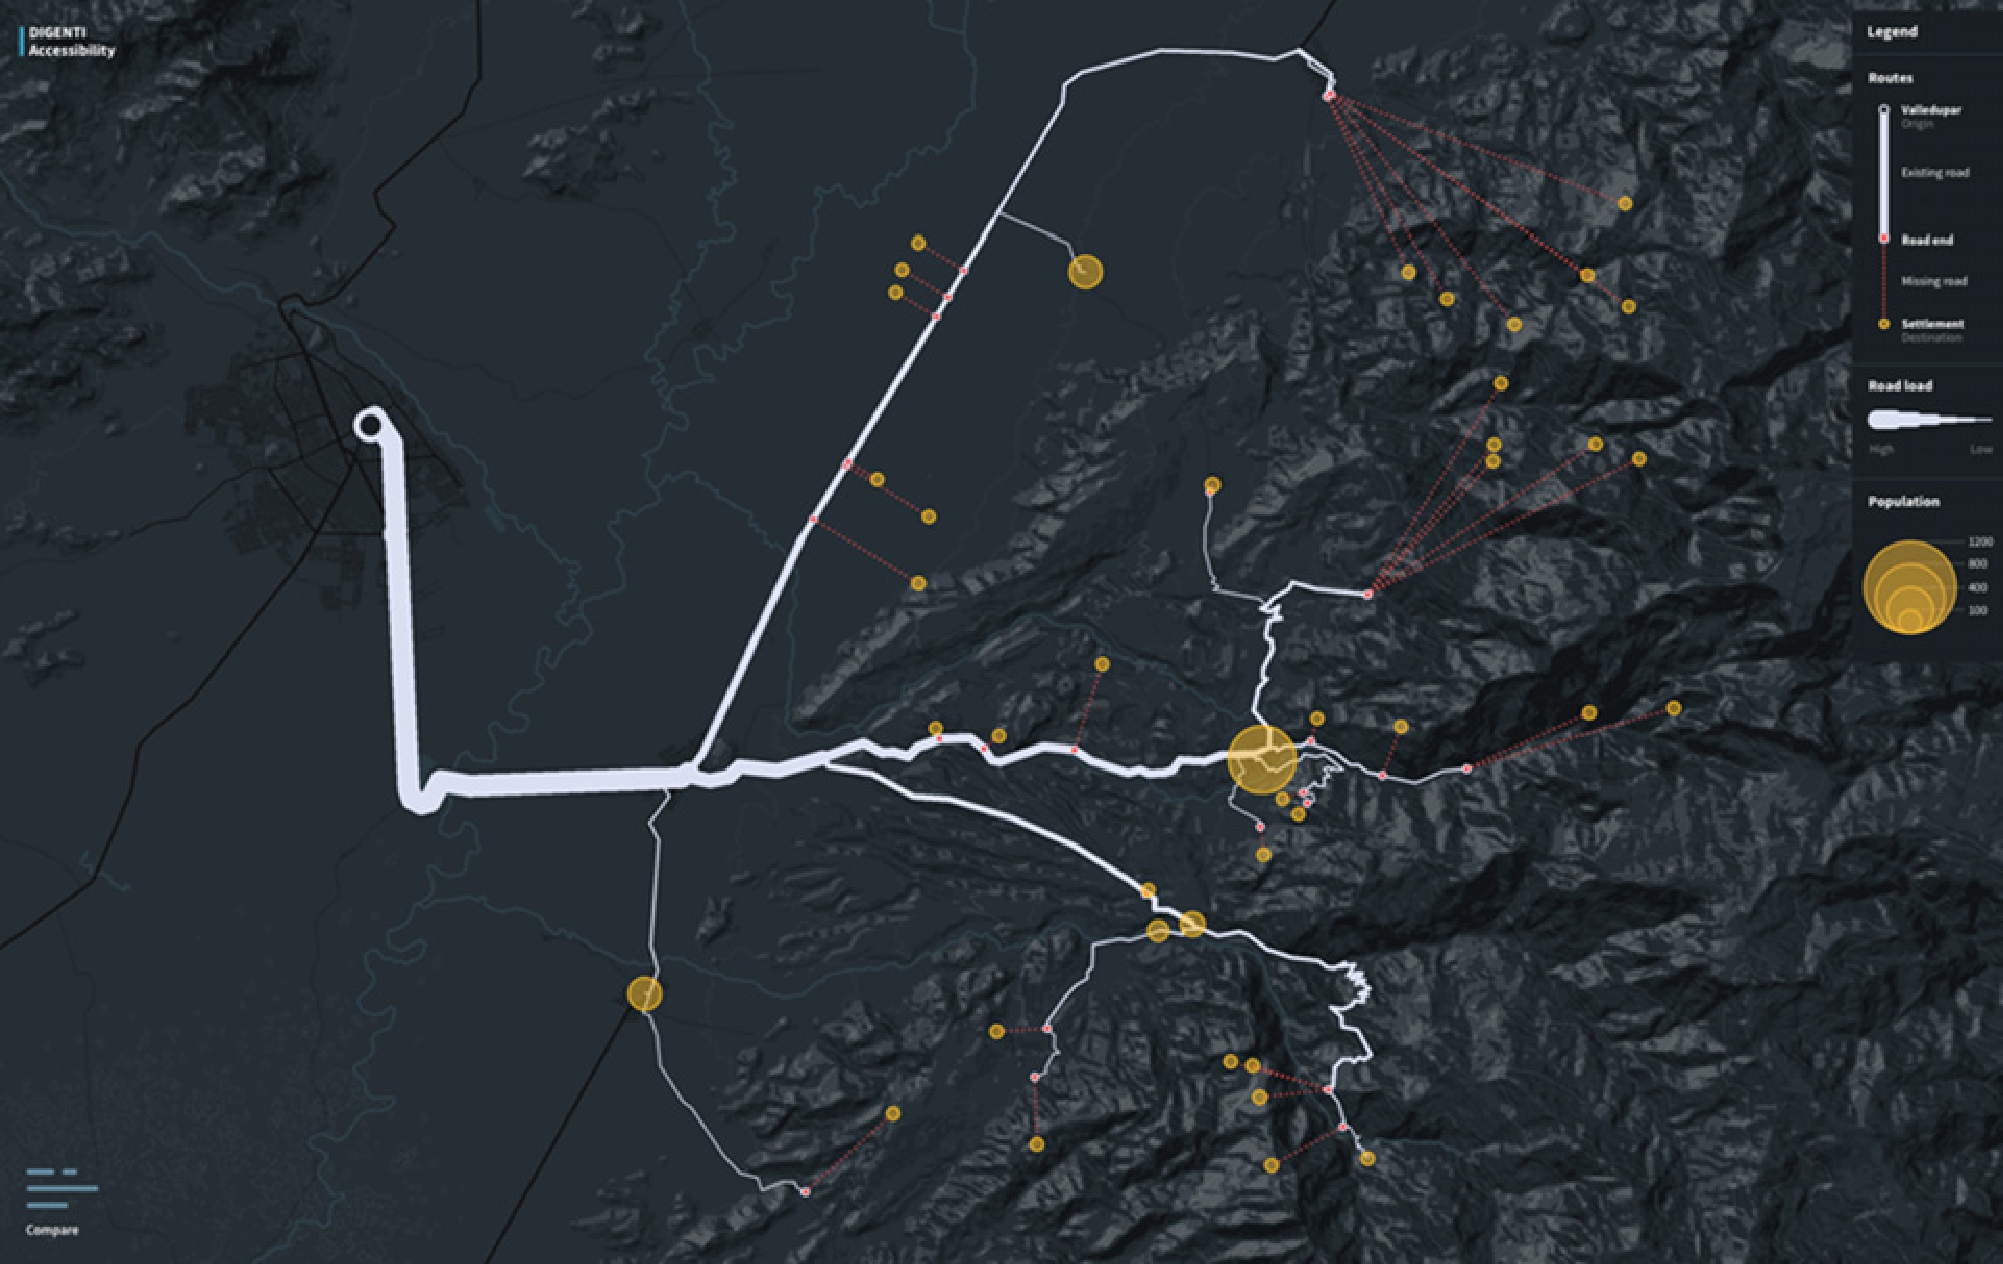
Area overview showing the connection routes from Valledupar (black circle, left on the map) to the settlements of the area of interest (yellow circles, spread over the area).
5.5 Area Overview
This view aims to give an overview of the areas’ overall reachability by road, by giving an understanding of:
what does the area’s road network look like?
which settlements are reachable by road?
which settlements are not reachable by road and thus are isolated from the road network?
which roads or road segments are of greater importance for the global reachability of the area?
This view intends to give insights about the vulnerability of the area’s road network at a glance. As shown in figure 5, the entire road network of the given study area is highlighted. The highlighted roads, in white, depict the existing roads that connect Valledupar and the settlements in the area. Valledupar is the main city in our study area where emergency teams are based, and is represented as a black circle with white border. The settlements are represented as yellow circles, whose size is proportional to their population. In case of emergency in the area, emergency vehicles would leave from Valledupar to the given affected locations.
5.5.1 Isolated Settlements
When a settlement is not reachable by road (e.g. indigenous reserves, farming facilities in the mountain range), a straight red dotted line represents the distance between the settlement and the nearest road. This visualization does not intend to represent an off-road route, but rather to approximately quantify and visualize how far (how isolated) a given settlement is from the road network. Moreover, these lines allow users to easily identify clusters of isolated settlements. With this representation, users are able to identify different insights at a glance:
Many settlements are far away from the road network and some of them form clear clusters.
The road network in our study area has a tree form. That means that if a road gets blocked, there is no alternative route by road to access the affected settlements.
5.5.2 Comparison View
The interface allows users to switch to an abstract comparison view built on the small multiples technique [51]. With it, users are able to compare settlements by different parameters, such as the length of their access routes or the distance from the settlements to their nearest road, as seen in figure 6.
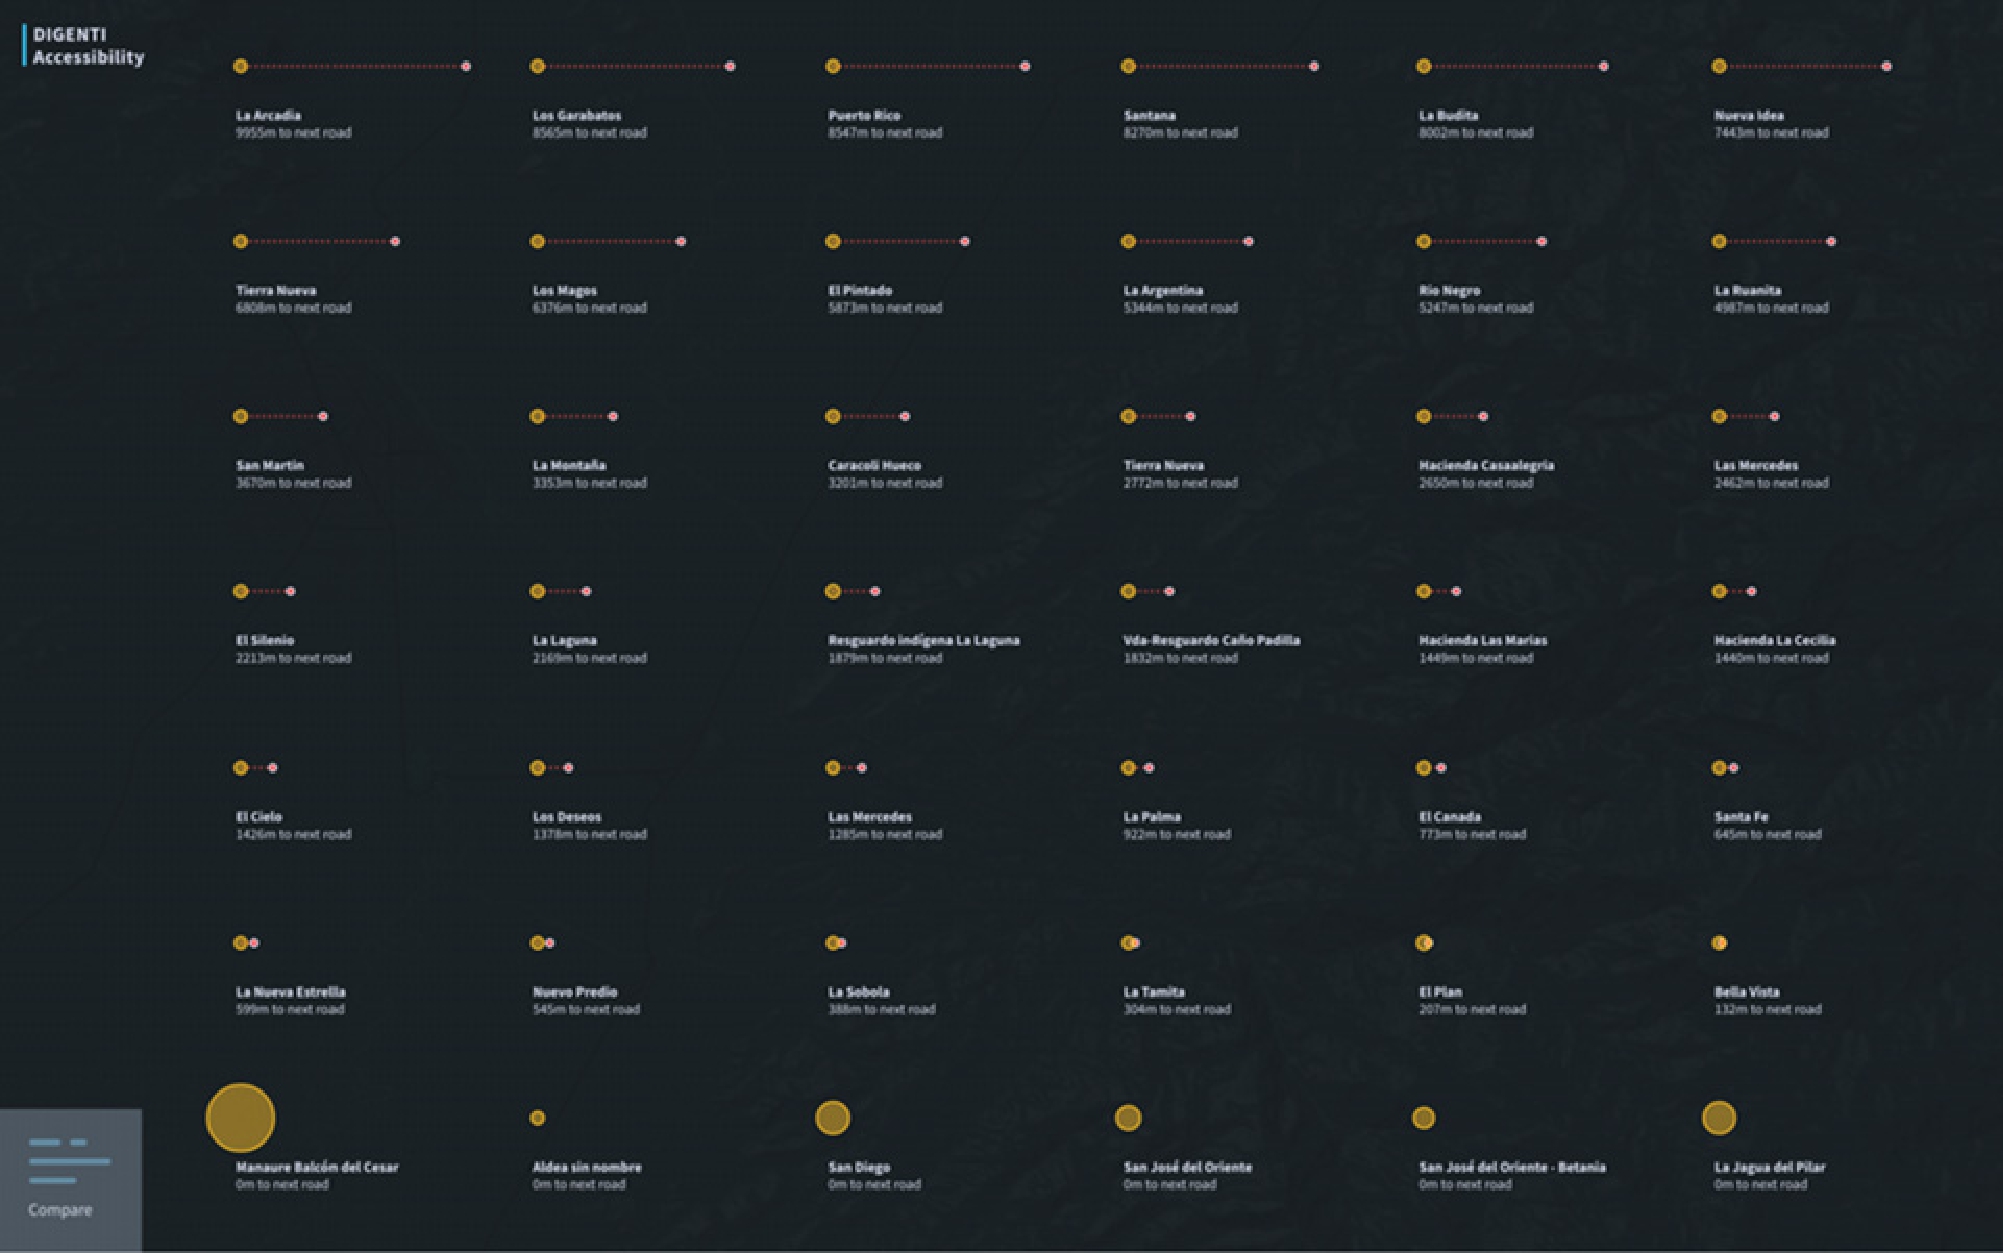
Comparing distances from settlements to their nearest roads using small multiples.
In order to help the users to maintain a sense of orientation within the system and not lose contextual information, the interface uses smooth animated transitions when switching between the map and the small multiples view. This will support fluid interaction, as proposed by Elmqvist [15].
5.6 Route Detail View
Detailed information on the access route to a settlement, a given task or a point of interest can be accessed on demand (Figure 7). For example, for accessing the details of the access route to a settlement, users can select the settlement with a simple tap touch gesture. In order to make the route to the selected settlement stand out, the system instantly fades out the other settlements, streets in the network and further irrelevant data. Moreover, the system fits the map to the bounds of the featured visualization. For these transitions, smooth animations are again used.
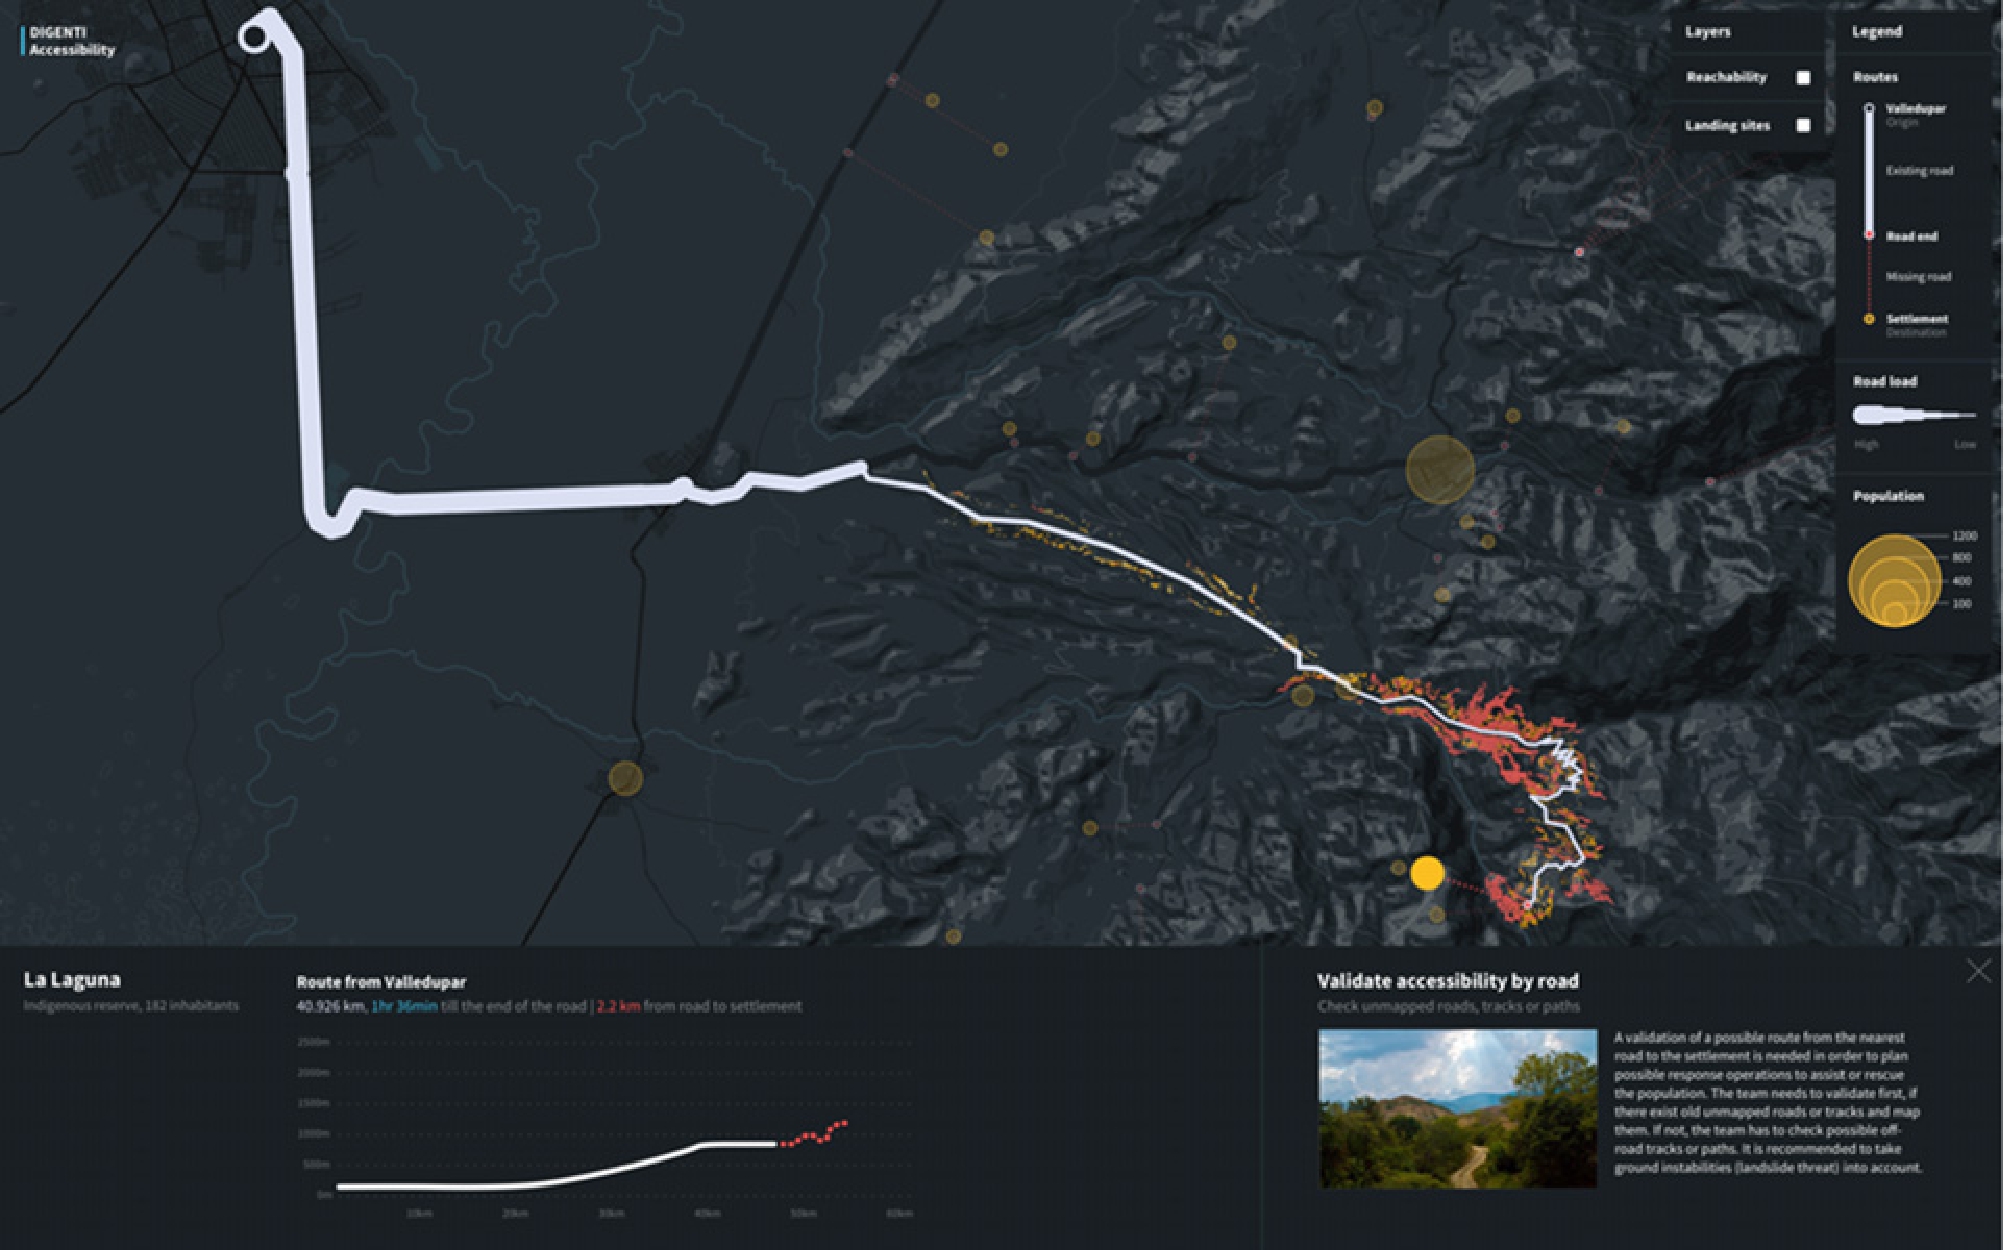
Route detail view. The system fades out other streets and settlements to make the featured route stand out.
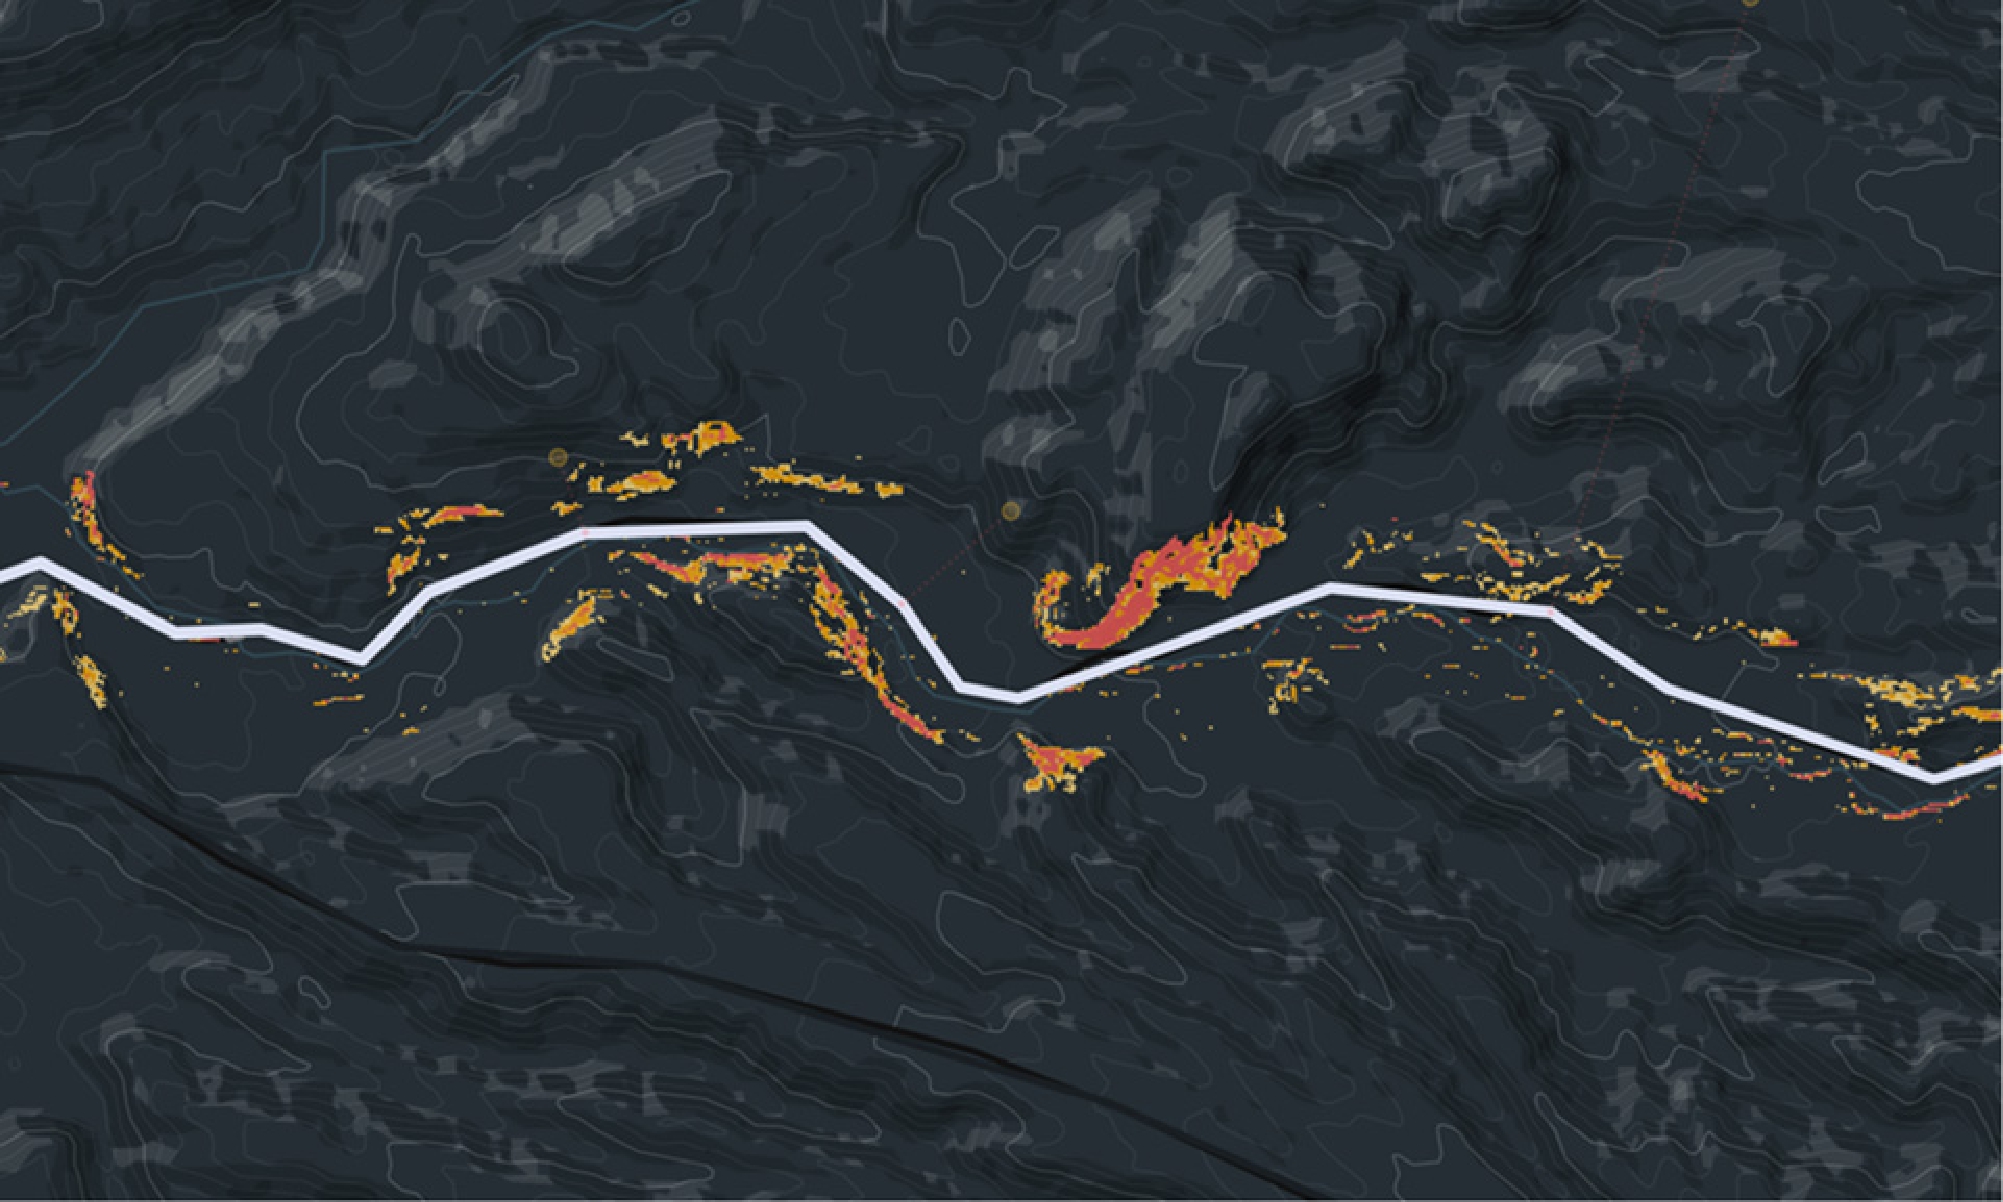
Detail of the unstable areas along the access route to a settlement.
5.6.1 Visualizing Threat Along Routes
The route detail view visualizes landslide threat along the featured route. Displaying the complete high-resolution raster dataset (e.g. threat data, potential landing sites) over the area clutters the map and is overwhelming for the viewer. Information density on the map is too high and it is difficult to distinguish which particular areas are particularly critical for a road. As introduced in previous research [50], we approach this by filtering the threat data along roads and routes, showing only the potentially critical areas that may signify a threat to the given road or route (Figure 8). With this we solve two problems at a time: we reduce data congestion, while emphasizing critical areas along the route in a simple way. This supports readability and allows users to visually evaluate the impact landslides could have on the road network.
To style threat data, we follow the established conventions used in hazard maps with which domain users are familiar. In landslide threat maps, ground instability is depicted by a progressive color scale: red (very unstable), orange (unstable) and yellow (moderately unstable), etc.
5.6.2 Bottom Bar
The route detail view opens a bottom bar with further information about the settlement and its access route (Figure 7). The bottom bar also includes a visualization of the route’s elevation profile (Figure 9).
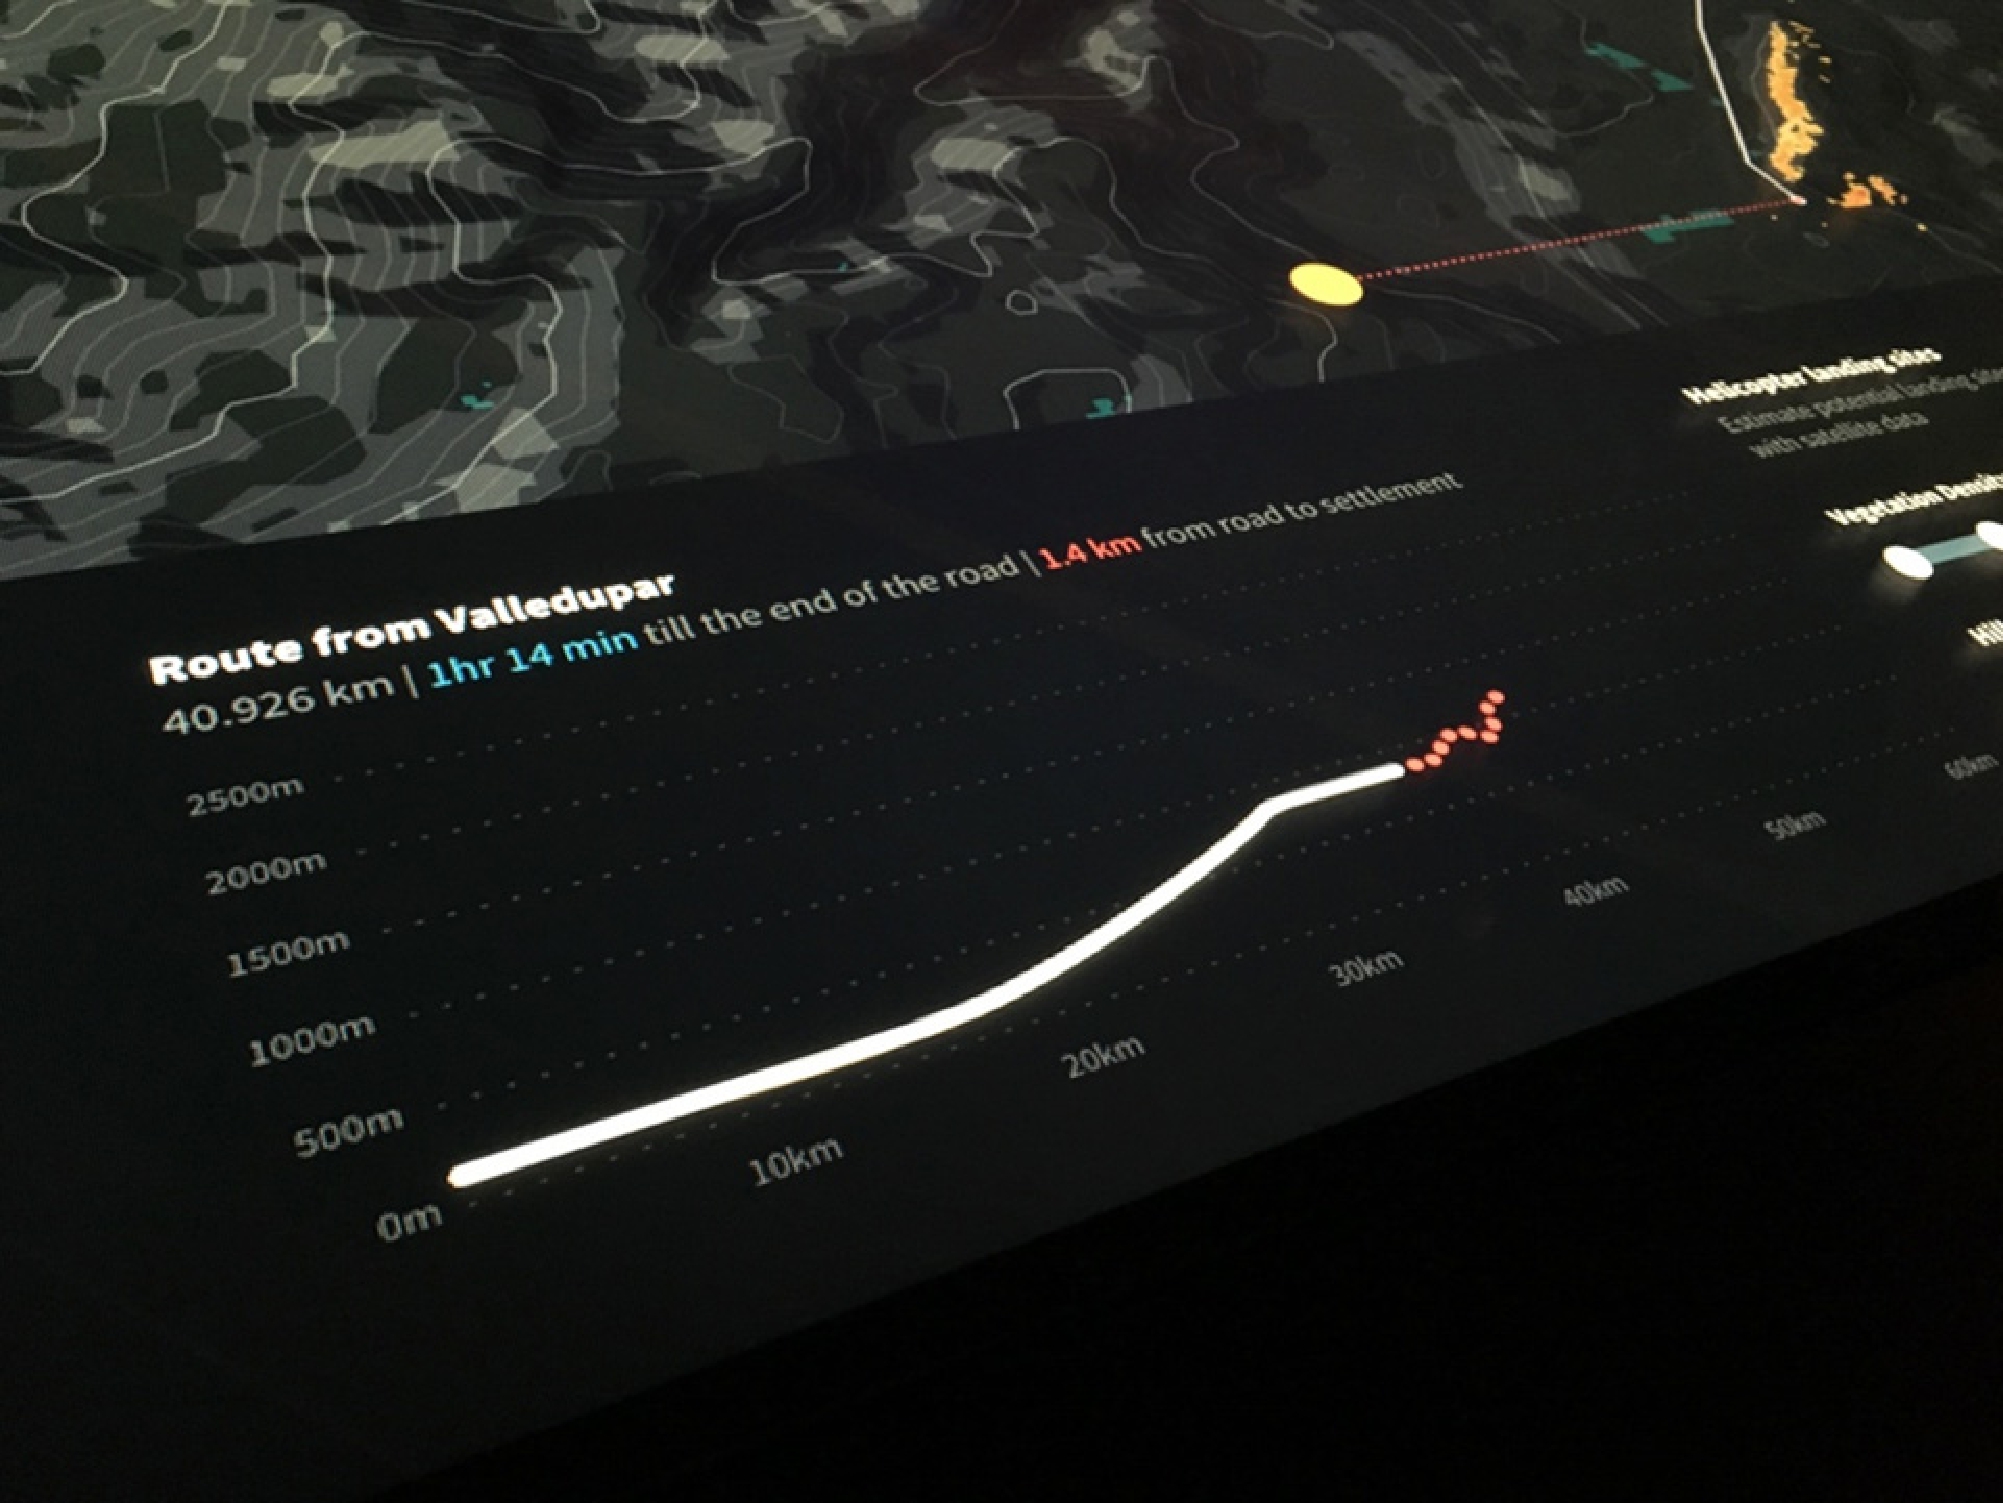
Route’s elevation profile containing the existing road (white) and missing (red, dotted) segments.
Moreover, the bottom bar also includes further user interface elements, as will be documented later in the paper.
5.7 Visualizing Temporal Reachability
Inside the route detail view, the interface allows users to analyze the temporal reachability of the settlements by using isochrones. Isochrones depict the points that can be reached from a specific start location within a given amount of time. This technique has been used in GIS and interactive maps to investigate accessibility and mobility [19], [30], [35].
In our interface, we use reverse isolines in car travel mode, which allow users to see all points from which a given destination (e.g. settlement) can be reached by car within a given travel time. With this, it is possible to quantify how reachable a settlement is. This is useful to determine which emergency vehicles on the field can get to the settlement within a given time.
We visualize isolines as translucent shapes in order to create a high contrast while still supporting the readability of the underlying route segments and background map. We use blue for encoding isochrone shapes, as well as other time-related information across the interface (e.g. estimated travel time in route details, as seen in Figure 9).
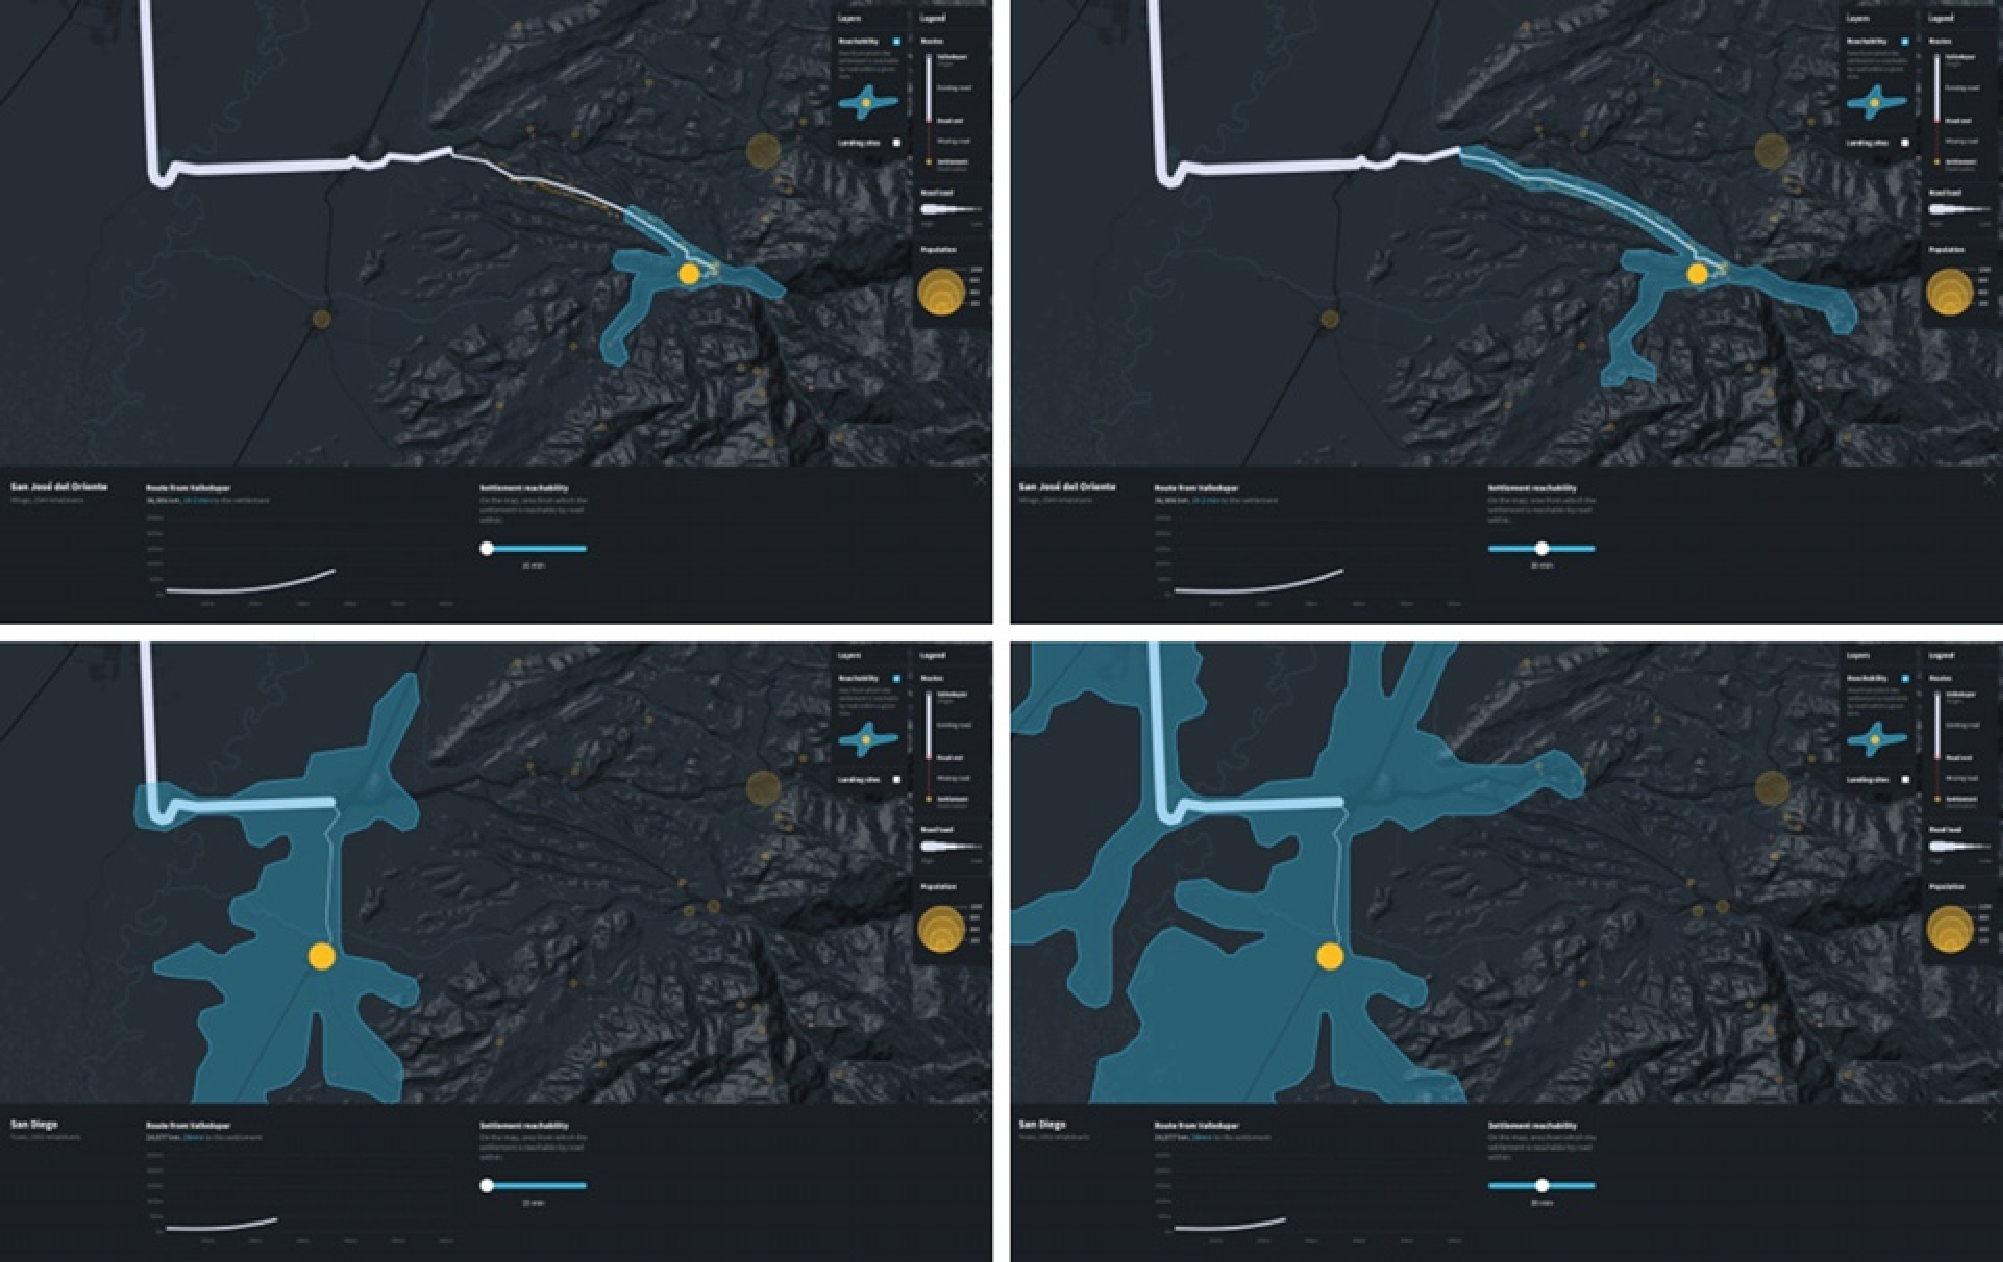
Reachability of two settlements within (left) 15 minutes, and (right) 30 minutes.
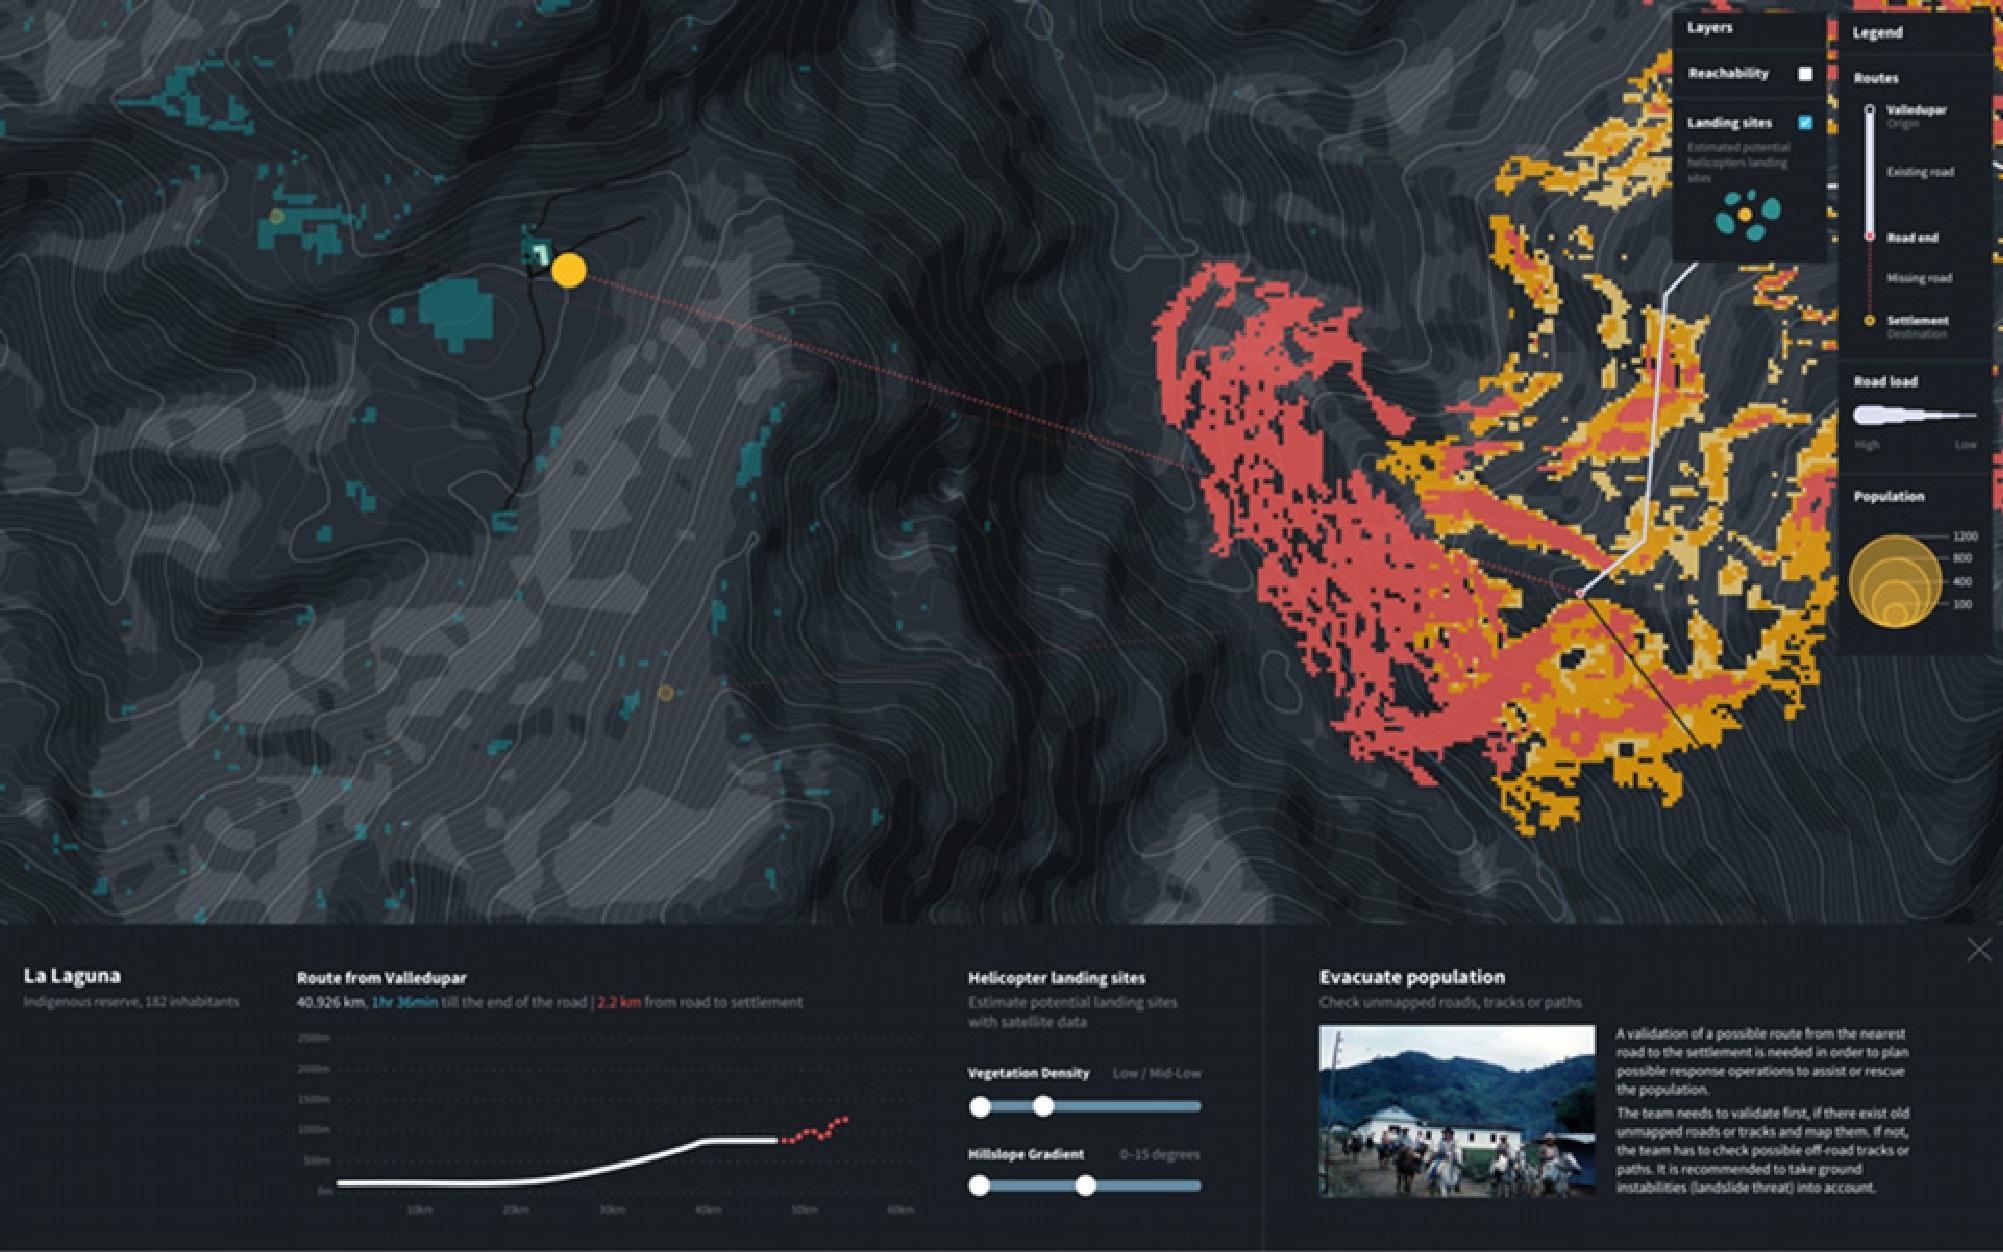
Estimated landing sites near the indigenous reserve “La Laguna”, situated 2,2km from the nearest road.
Isochrones can be toggled using the layers’ modal menu, and are only available for settlements that are directly accessible by road. When the isochrones are active, the view’s bottom bar shows a time range slider (Figure 10). With it, users can configure the isochrone travel time with values from 15 to 45 minutes. Figure 10 compares the reachability by car of two settlements within 15 minutes (Figure 10, left) and 30 minutes (Figure 10, right). In the figures we can see that the travel distance from where San Diego (Figure 10, bottom) can be reached is considerably larger than the distance for San José del Oriente (Figure 10, top) within same travel times. While San José del Oriente is in the middle of the mountains and is only accessible by one route, San Diego is closer to the highway and better accessible by multiple access routes.
5.8 Exploring Potential Landing Sites
The detail view offers users the possibility to analyze potential landing sites around the selected settlement. This is especially important for planning alternative accessibility to settlements that are not reachable by road or as preparation in case the settlement gets isolated due to a road blockade.
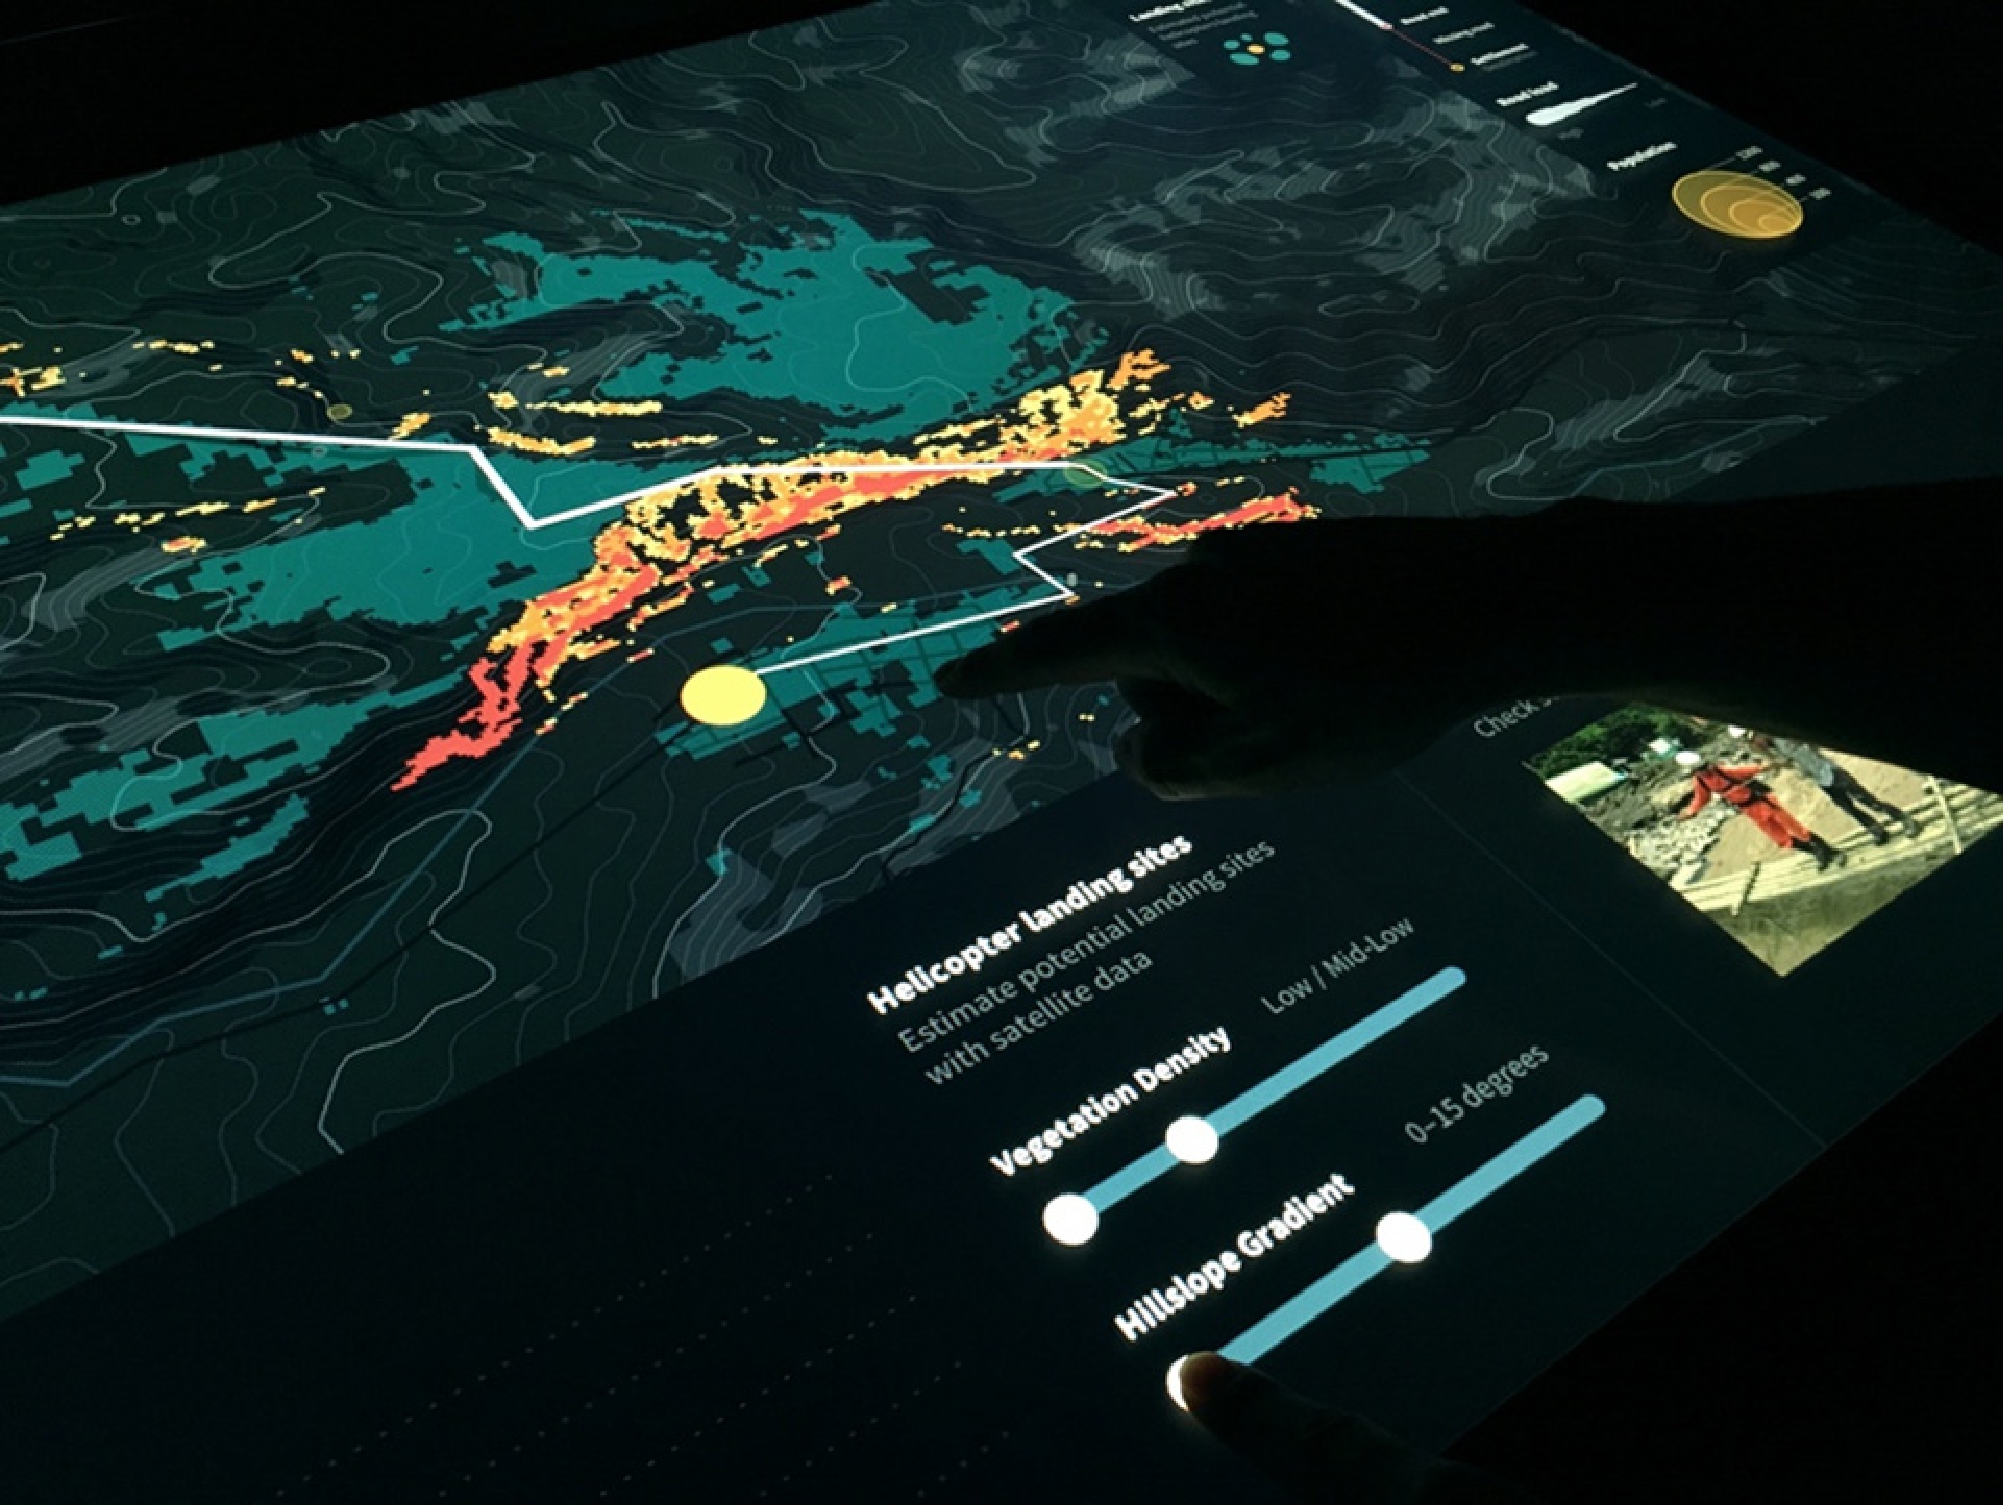
User configuring vegetation density and hillslope gradient values with the interface for estimating potential landing sites around a settlement.
Potential landing sites can be toggled using the layers’ modal menu and are displayed as green translucent polygons. We only show potential landing sites within a given radius, which is configurable by the user. We do this to avoid cluttering the map and make the rest of the data readable. Figure 11 shows the potential landing sites around La Laguna, an indigenous reserve with 182 inhabitants, whose nearest road is 2,2 km away.
The view’s bottom bar allows users to combine different vegetation density and hillslope gradient values with two sliders (Figure 12). Once new values are set, the system immediately updates the landing site estimation. With this, we want to support decision makers with an estimation calculated using remote sensing data, but still giving them room to check different possibilities and decide based on their area knowledge. Following our design goals, the system aims to inform users about the possibilities, without making a decision for them. We believe that this is a valuable first step that will help save time and optimize operation assessments.
5.9 Reporting and Validating from the Field
The tablet interface enables reporting from the field. This allows users to validate a road directly from the field, by marking segments in bad condition or mapping road blockades. Reporting is supported by a toolbar placed at the bottom center of the screen (Figure 13).
The mapping/reporting toolbar of the tablet interface, at the bottom center of the screen, with options for (a) toggling sketch-based mapping, (b) photo mapping and reporting, and (c) text reporting.
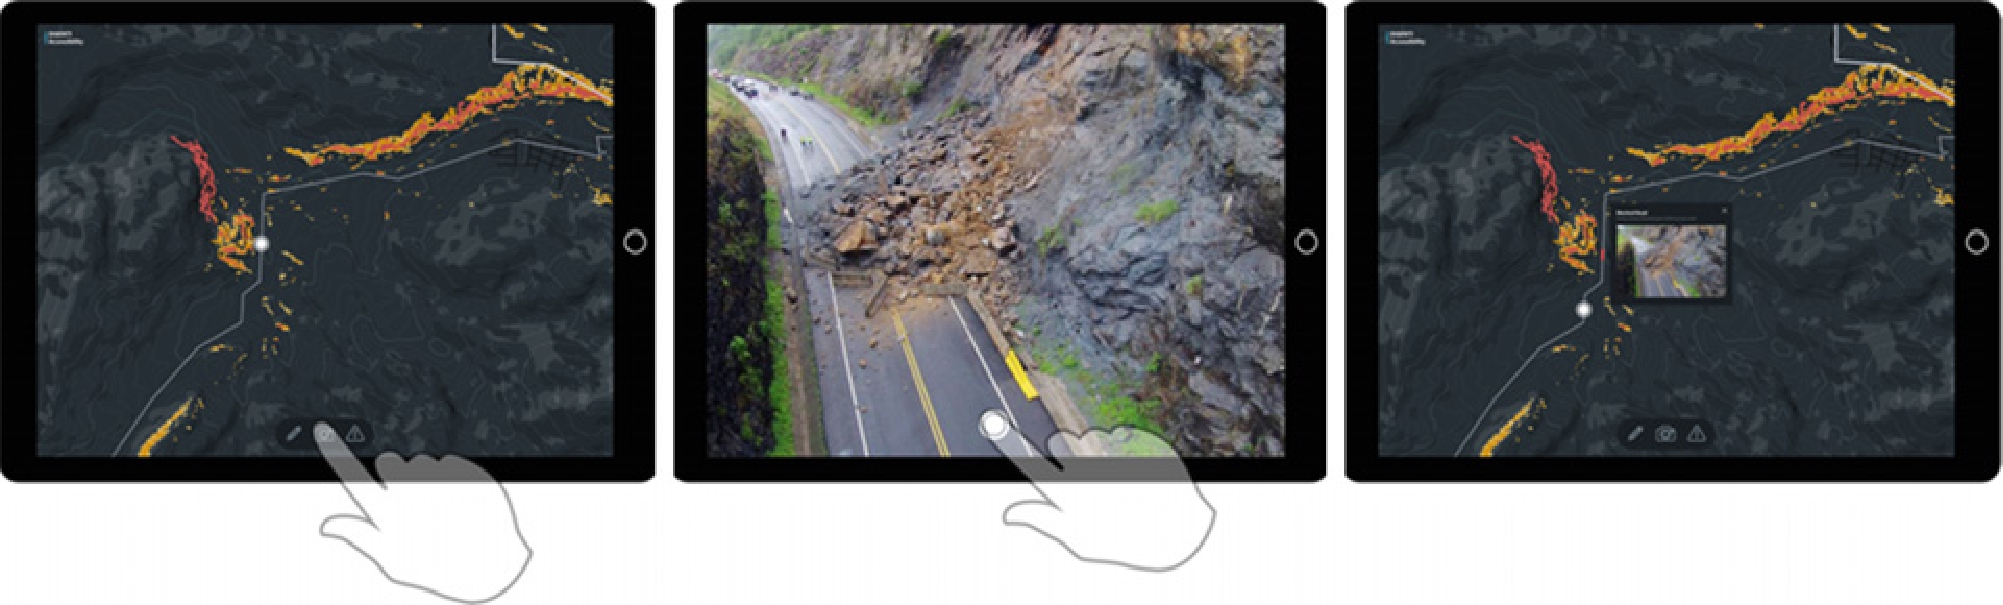
Validation and reporting from the field. (a) The user selects photo reporting with the interface menu, (b) the user makes a photo, and (c) the photo is automatically mapped in the user’s current geolocation.
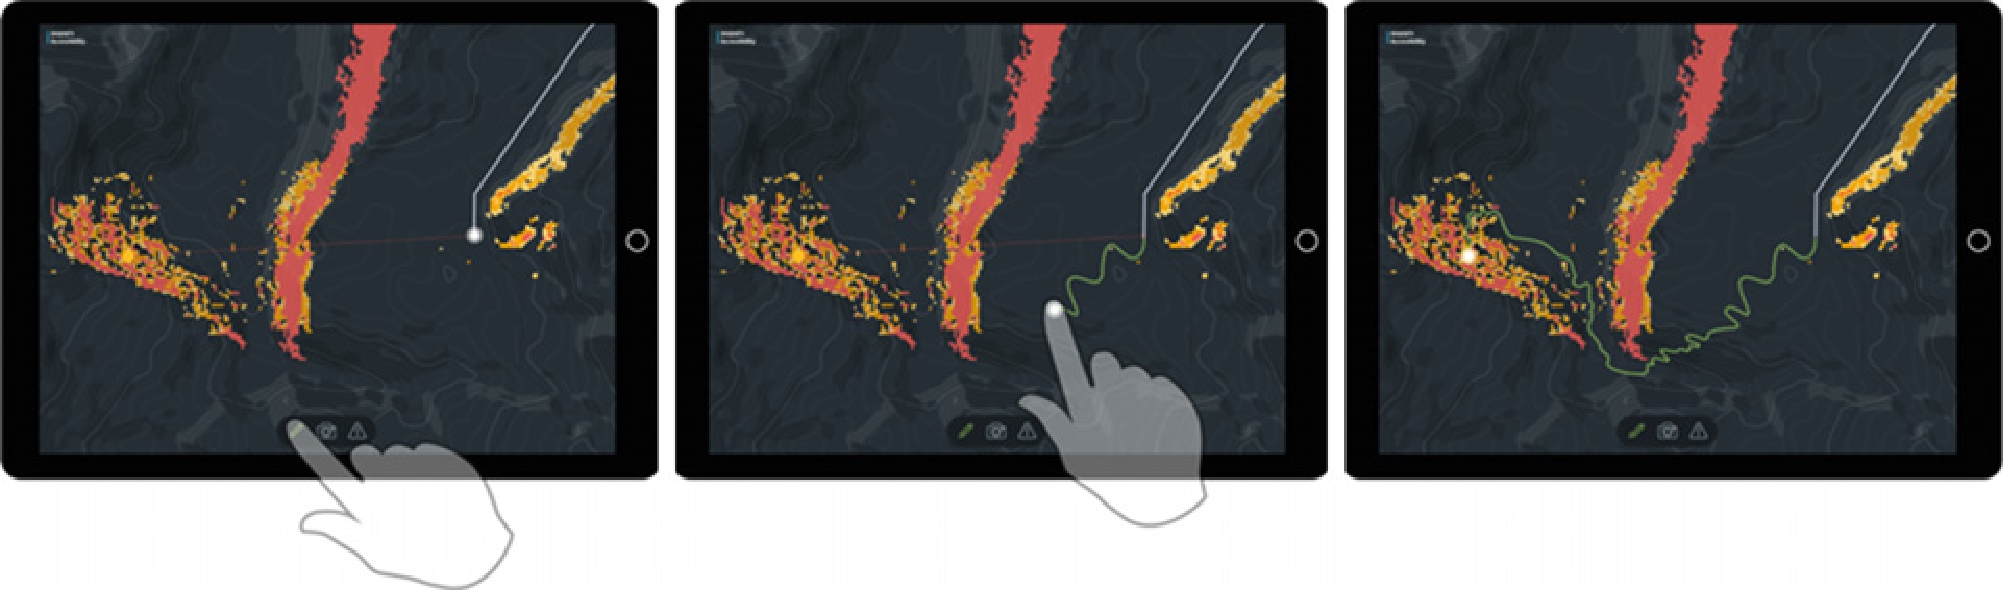
Manual mapping of an off-road path through free-form sketching. (a) User activates drawing mode, (b) user draws off-road path on the map, and (c) the route is updated in the system.
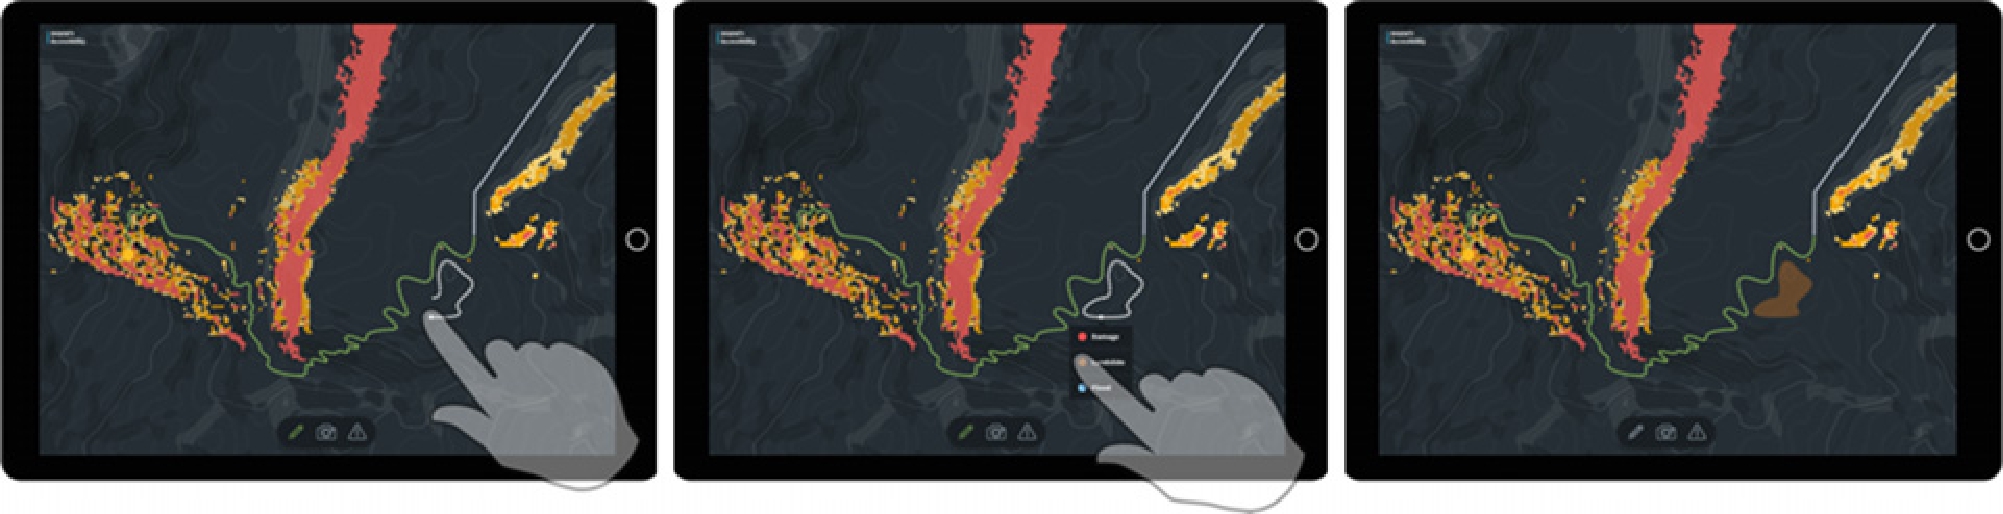
Manual mapping of a landslide through free-from sketching. (a) User draws the area, (b) after closing the shape user marks it as a landslide, and (c) the area is updated in the system.
Reports can be text-based (Figure 13c) or contain photos (Figure 13b), which users can take with the interface, and are automatically uploaded to the system. For geolocating the reports, the system takes the user’s current position, which is visualized on the map as a white dot with a blinking white translucent border. This style aims to give the marker a sense of activity, of being “in motion”.
Figure 14 illustrates how the reporting process works. First, the user selects on the toolbar the option to make a photo (Figure 14a). The camera application opens and allows the user to shoot a picture of the issue to report, in this example, a road blockade caused by a landslide (Figure 14b). Finally, the photo is uploaded and automatically mapped on the current geolocation of the user, and can be accessed anytime on demand in a tooltip (Figure 14c). With this simple and almost seamless process, our aim was to allow users to report with as few interactions as possible. Additionally, through the interface it is possible to add further metadata for the photo, such as categorizing the report (e.g. road blockade), or adding a brief description.
5.10 Mapping Through Sketch-Based Interaction
The interface allows users to map geographical features by drawing them directly over the map. These features can be polylines or polygons. While mapping through drawing is possible in both tabletop and tablet interfaces, this functionality is especially interesting in the tablet interface since it enables mapping directly on the field. This functionality enables operational units to validate routes by mapping passable off-road paths for accessing settlements that are not reachable by road, as well as roads or tracks that were not previously in the database.
The mapping process is simple. First, the user zooms and pans to the area (e.g. the area between a settlement and its nearest route), and activates the drawing mode by tapping over the pencil icon in the bottom toolbar (Figure 15a). The user draws the desired route holding the finger on the screen (Figure 15b). Once the drawing is finished, the route will be updated in the system (Figure 15c). In case that the route represents an off-road route for accessing an isolated settlement, the red dotted line will fade off. Manually mapped routes are visualized as light-green dotted lines.
Furthermore, the drawing mode also enables the manual mapping of polygons, such as landslides, damaged or flooded areas.
Users use a simple button to toggle the drawing mode (Figures 13a and 15a). While related research has explored the use of pen and touch interactions for a seamless mode switch between drawing and default interaction modes on multi-touch devices [20], we use a simple mode switch button to keep interactions as simple as possible and consistent between devices (tabletops, tablets or further devices such as desktop and laptop computers).
5.11 Collaboration Through Cross-Device Interoperability
All devices in the system are interconnected. Decision makers using the tabletop in the control room can assign tasks to specific units on the field, which, with support from the tablet interface, can receive and execute these tasks (Figure 17).
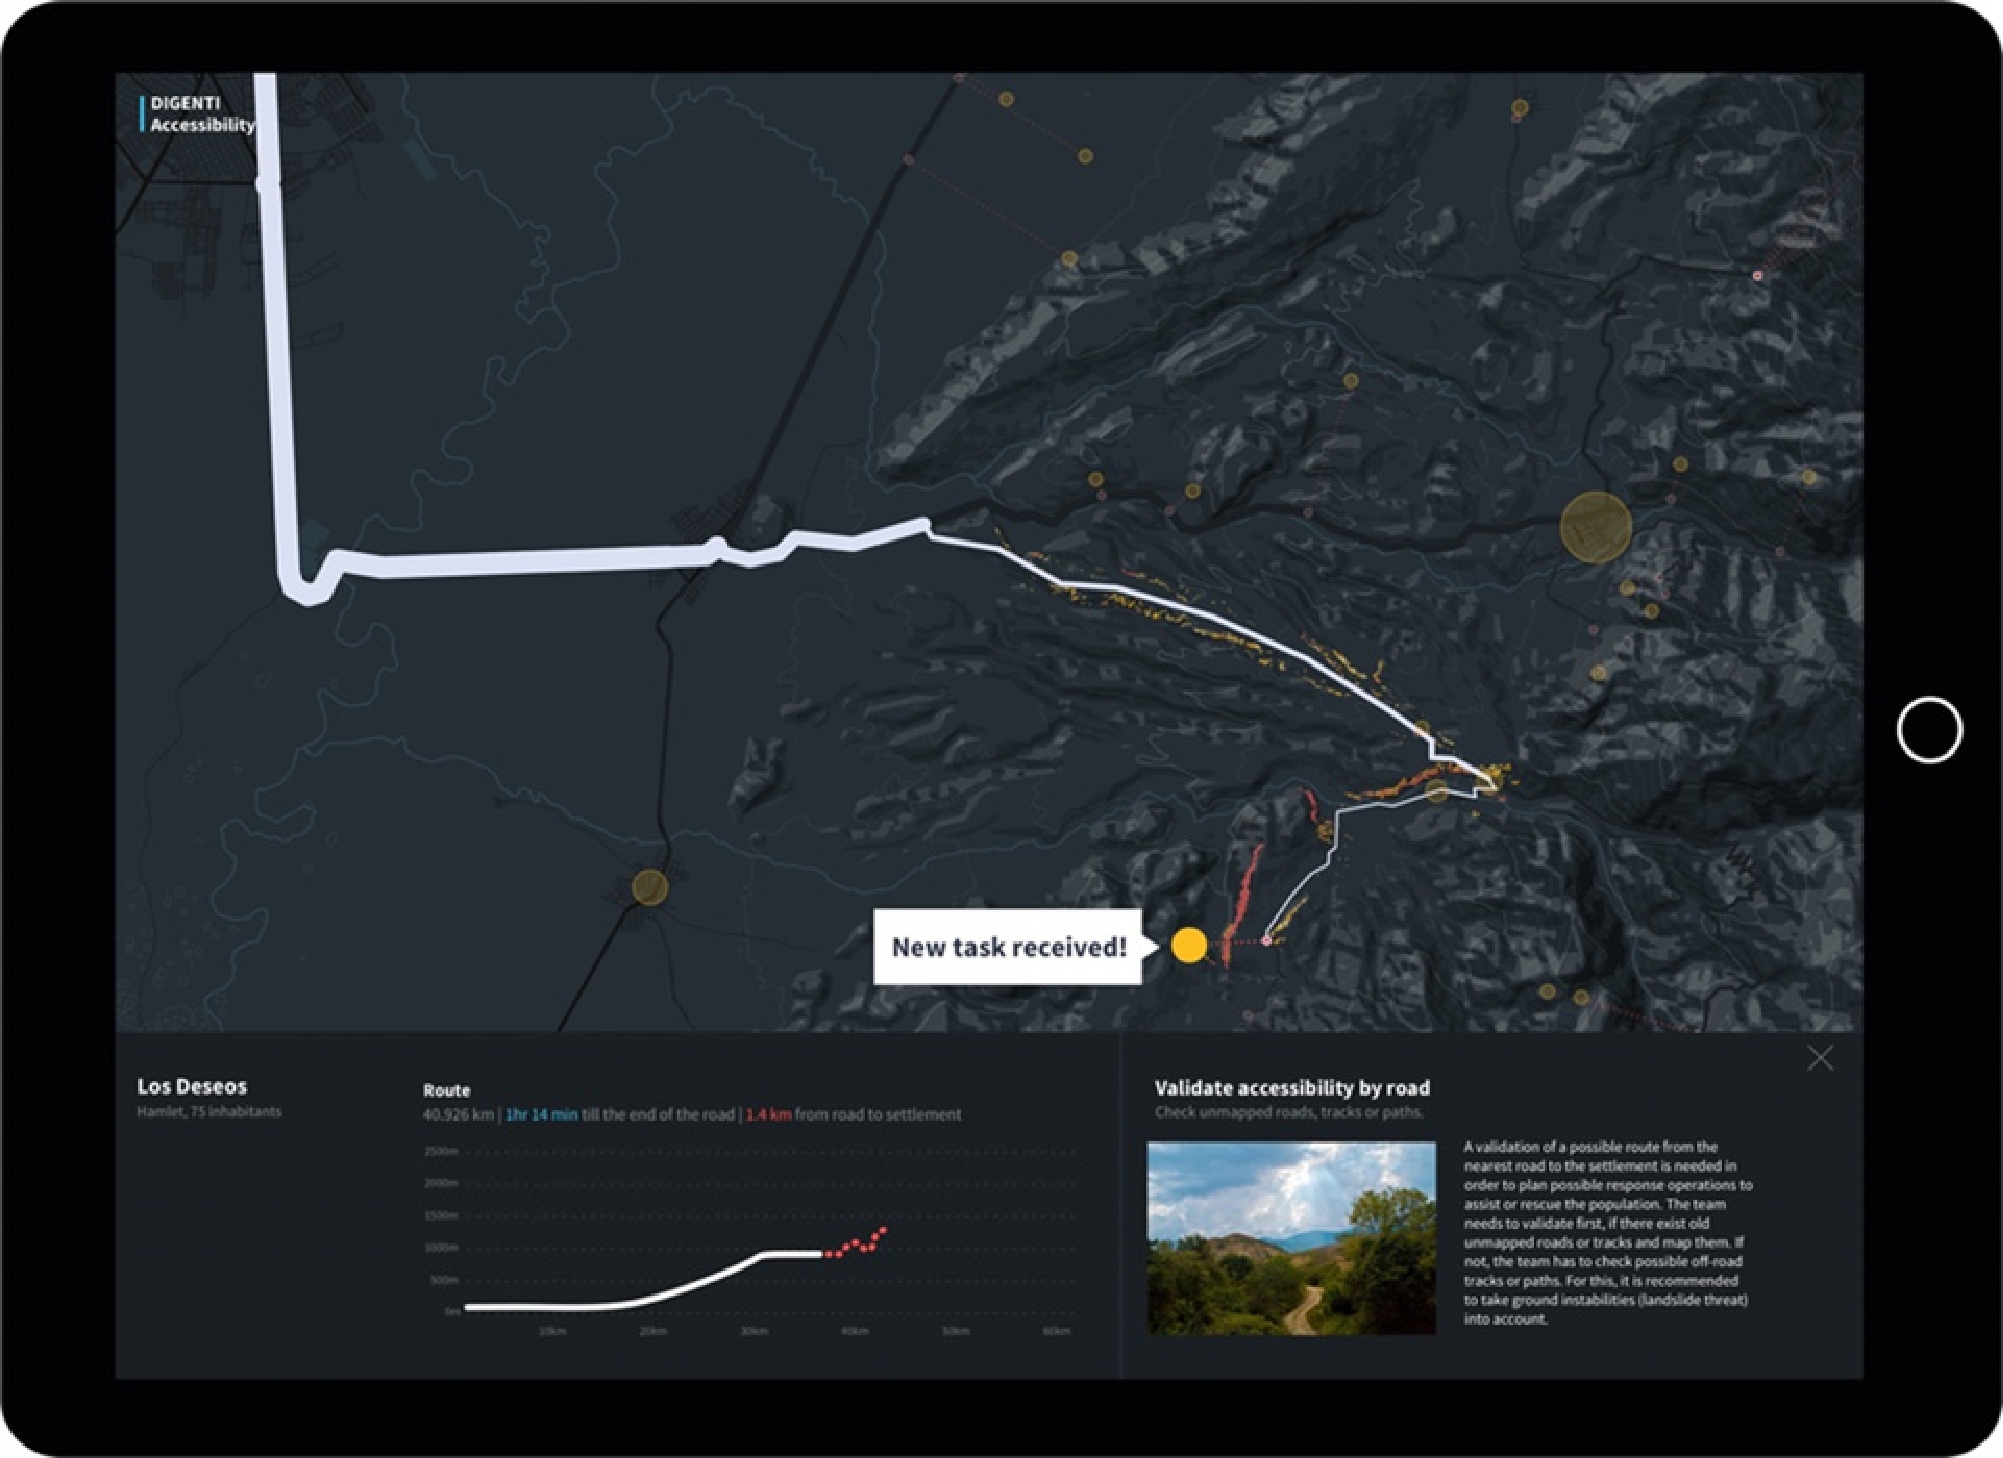
New task is received in the tablet interface.
Moreover, we have seen examples of how tablet users are able to:
map a partially-blocked road by adding a photo from the field (Figure 14)
map an off-road route on the map (Figure 15)
map a landslide (Figure 16)
Tabletop showing updates from the field. New reports are updated in real-time and updated in all devices.
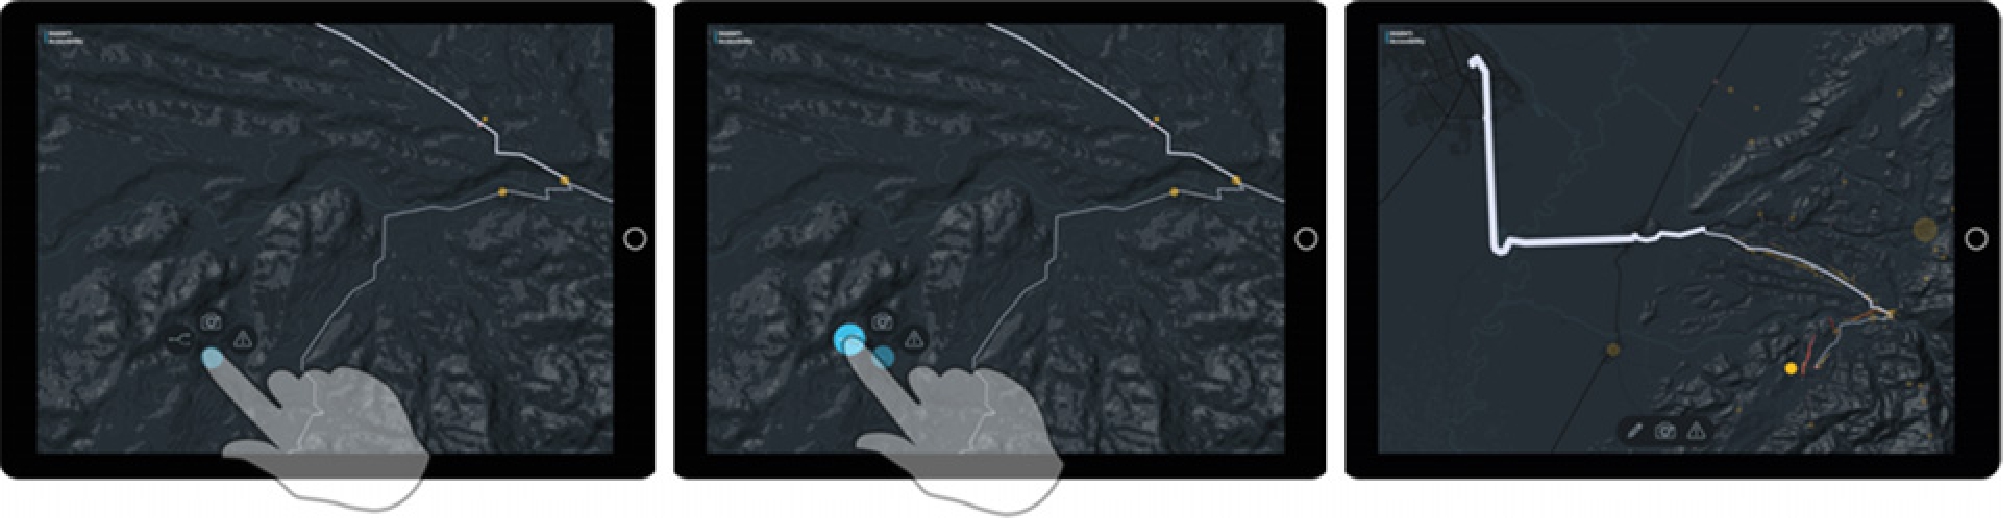
Tablet user calculates a route. (a) Select a location with touch and hold, (b) sweep to select the button for route calculation, and (c) the route to the selected destination is calculated and visualized with threat data in real-time.
5.12 Calculating Routes in Real-Time
The tablet interface allows users to calculate routes in real-time. Users can touch and hold the desired destination to open a modal menu (Figure 19a). This menu allows users to calculate the route to the selected destination, as well as geolocating a photo or report. Next, users can sweep their finger to the desired option (Figure 19b). When selecting the “calculate route” option, the route will be calculated and visualized together with threat data (Figure 19c).
6 Implementation
The architecture of the system is divided into server and client sides. The prototype was developed using free and open source web tools. The server implements a PostgreSQL database [41] with PostGIS [40] and handles data processing, which includes data aggregation and filtering, by combining raster data (threat data and potential landing sites) with OSM features and a real-time routing service. Technically, this approach consists on filtering raster data by point (e.g. POI) plus buffer, line (e.g. route) plus buffer, or polygon (e.g. area) (Figure 20). The frontend is connected to the server via a simple REST API, implemented in Node.js. The client side implements the user interfaces for tabletop and tablets, which were developed in Javascript and WebGL. We used Mapbox Studio [28] for designing our custom map tiles, and Mapbox GL JS [29] for interactive map rendering with WebGL, which provides smooth transitions when interacting with the map (e.g. zooming, panning) and on view change. Moreover, both abstract and geo-visualizations were implemented with d3.js [13]. The separation of map rendering and visualizations using Mapbox GL JS and d3.js allowed us to implement fluid animations between map and abstract representations. Although the system is originally designed for tabletop and tablet applications, the implementation using web tools in the client makes possible the use of the interface in other devices such as desktop or laptop computers, depending on the needs and resources of the domain users.
![Figure 20
REST API’S data calls by (a) point, (b) line, and (c) polygon [50].](/document/doi/10.1515/icom-2017-0027/asset/graphic/j_icom-2017-0027_fig_044.jpg)
REST API’S data calls by (a) point, (b) line, and (c) polygon [50].
7 Preliminary Evaluation and Discussion
We conducted a preliminary evaluation study with experts from different disaster management entities in Colombia. Due to the impossibility of bringing a tabletop to Colombia, we used a combination of a desktop demo and an explanation of the system architecture and functionalities. Two days before the session a debris flow hit the city of Mocoa in the south of the country and some of the participants had to depart for the area or to work at the National Crisis Room. The circumstances made it impossible to organize separate evaluation sessions and we designed a study in a single session to gather qualitative expert feedback. We analyzed how our system could support different user roles (control room and field work), how can it help to gather insights about reachability, and how can it improve performance in decision-making tasks.
The 12 participants were from three expert user groups: (1) experts on risk management at a decision-making level, (2) members of local authorities and operative entities, experts on field work, and (3) members of academic institutions experts in risk modelling and mapping. The session was based on a group discussion and built in four parts. The first part consisted in an introduction to the system and a walk-through throughout a desktop demo on a large screen. During this introduction, participants were asked to, alone, write down personal ideas and thoughts on Post-its. Second, we divided participants in small groups and asked them to group similar ideas and raise more thoughts and questions by reflecting on their own experience when possible. Third, we asked each group to present their results by putting the Post-its on a board and commenting on them in front of the group. Finally, we asked participants to group together similar post-its and the resulting groups were used to moderate the group discussion. We designed this methodology to avoid a situation where some participants are more dominant than others. By letting each participant to first put their personal thoughts on paper and present them individually to the audience, we aimed to give all participants the possibility to express their ideas and thoughts. Moreover, by grouping these ideas in the end, we could see similarities between the opinions of participants of different user groups, while still identifying small differences from their personal reflection and experience.
We gathered many insights from the session. All of them were reflected upon personal experience. Moreover, in the recent event in Mocoa, the city became isolated because of the collapse of a bridge on the only access road and forced authorities in the aftermath to decide an alternative access method. This situation prompted participants discuss and evaluate our system in relation to this real event. We have classified the gathered insights into the following categories and discuss them:
7.1 Visual Style and Usability
While some participants were skeptical about using digital tools, they rapidly felt interested on our visualizations. Experts were enthusiastic about the simplicity and attractiveness of the visual language, as well as about the responsiveness and smoothness of the system and wanted to use it. Thus, it was easy for users to understand the context and gather insights about reachability and landslide threat in the area. All this information is important for them for creating and identifying scenarios of risk and how to react to them. Another positive aspect was the fact that the system centralizes knowledge in a single tool, making it unnecessary to check different maps at the same time. Participants pointed out that this would reduce decision-making time and improve performance at work.
7.2 Area Overview Visualization
The area overview allowed participants to build a fast situation overview in one single visualization with which to detect preliminary risk scenarios. At a glance, participants could identify isolated settlements and build insights on the vulnerabilities of the road network, by detecting which access roads could cause the entire area to get isolated. This kind of visualization was nonexistent before and is a contribution of this paper. Nevertheless, participants also pointed out the need to support these insights by visualizing threat data already in the overview and not only on demand.
7.3 Threat and Isochrone Visualization
The methods used for visualizing route details and landslide threat were self-explanatory for participants. Participants were able to easily point out the most critical points along the routes, and could quickly build an overview of the best alternative methods for accessing settlements in case of inexistent access roads or road closures.
Experts underlined the relevance of using isochrone-based travel time visualizations and highlighted its importance for both managing emergency vehicles during response operations and planning evacuations. For supporting these use cases, we need to add more travel modes (e.g. walk), as well as the opportunity to analyze reachability at different times of the day. Furthermore, the visualization technique used for depicting travel times was confusing for the users in the beginning, and needed further clarifications from the moderators. First, the use of buffered polygons, which contain the roads but also their surroundings, made unclear whether the off-road areas surrounding the streets were also reachable within that travel time or not. A new method for visualizing isochrones that avoids buffered shapes is needed.
7.4 Data Quality and Uncertainty
Participants were concerned about the reliability of OpenStreetMap data in the area. The analysis presented in this paper relies on the available OpenStreetMap dataset, but this dataset may be incomplete or not up-to-date. Moreover, experts from the local authorities pointed out the need to validate the estimated travel times depicted by isochrones, remarking that roads in such mountainous areas are usually in bad condition and travel times are substantially higher in reality. Additionally, experts highlighted the need to incorporate real-time weather forecasts (e.g. rainfall) to the system in order to update threat maps with up-to-date data. These considerations present the need for new ways to deal with such uncertainties, both in the data collection and visualization.
7.5 Alternative Accessibility
One of the contributions of our research is the proposal of alternative ways to access settlements. Participants pointed out the relevance of pre-calculated helicopter landing sites for saving time during emergency response. A manual estimation process can take hours and in the end it is the helicopter pilot who decides. Our approach gives the possibility to save valuable time and provide the pilot with multiple landing alternatives. Moreover, experts evaluated the mapping on the field and mapping of off-road routes through drawing as a good way to add local knowledge to the interface during training exercises. In order to provide a better sense of orientation when mapping, participants suggested increasing the contrast of the terrain shading in the background map, as well as adding more contextual information (e.g. buildings, hospitals, schools). Nevertheless, this last point will require an improvement of the OpenStreetMap dataset in the area.
7.6 Validation and Reporting with Tablets
Both the validation of road status (e.g. road blockade mapping) and the ability to create reports were evaluated as real-life needs. For example, stakeholders on the field usually share photos using social applications (e.g. WhatsApp, etc.). Our system allows this functionality and additionally georeferences the photo for its use by all users in the system. Participants also shared the importance of having photos of the same place in different points in time, in order to track changes. This requires new ways of visualizing photos on the map, as well as to explore the photo timeline of a given place.
7.7 Further User-Centered Applications
The discussion provoked thoughts about further uses for our system with different target users. While the general use case for evaluating and validating reachability to settlements in an area of interest for preparedness and mitigation was received with enthusiasm, experts highlighted the importance of applying the same visualization techniques for supporting other tasks, such as the planning of evacuations. Moreover, experts saw our system as the basic framework for designing a multi-device environment for managing emergency response in the aftermath of events.
8 Conclusion
In this paper, we presented an approach for supporting expert insight formation through visual analysis on a tabletop and tablet interfaces. We built our research on a case study from the disaster management domain, using complex data from different sources. Through this use case, we discussed challenges such as engagement of domain users to use new tools, collaboration, reduction of data complexity through visualization, and interaction. We presented a set of visualization and interaction techniques explored with a prototype and presented a preliminary evaluation and discussion about its use and utility in the expert domain.
The main contribution of the paper is the design of a simple language to depict the reachability of an area, by highlighting accessibility vulnerabilities and the impact that landslides may have on the road network. The results of our preliminary evaluation showed that participants were able to gather insights and confirmed our hypothesis that using a simple and attractive language, both in the aesthetic and usability, would engage users to use the system. Moreover, our system showed the benefits that depicting alternative accessibility offers to real-world applications. Examples proposed in this paper are the visualization and configuration of estimated helicopter landing sites, and the manual mapping of off-road routes.
Furthermore, while the designed interfaces for tabletop and tablets build on similar visualization and interaction patterns, the presented system shows the potential of multi-device ecologies for collaboration between different user groups, mapping, and validation of uncertain data. In the future, we will address multi-device interaction with further methods for cross-device interoperability, data exchange and collaboration between devices.
While data quality was beyond of the scope of our research, we believe it is an important issue to address in the future in order to provide the reliability and trust that the disaster management domain requires. Our research also raised new questions on how to apply similar visualization techniques to support specific tasks in the preparation and execution of emergency responses, such as the planning of evacuation routes and management of emergency vehicles on the field.
This paper has shown the potential of analytical tools for supporting expert insight formation and decision making. Although our research built on a specific case study, we believe that the lessons learned can be applied to other case studies and domains. We hope that our approach encourages a productive discussion in the research community and inspires further research at the intersection between visualization, HCI and disaster management.
Funding statement: The project DIGENTI is funded by the German Federal Ministry for Economic Affairs and Energy (BMWi) within the INNOspace initiative of the German Aerospace Center (DLR). We are grateful for this support.
About the authors

Jordi Tost is since 2015 a research associate at the Interaction Design Lab (IDL) of the University of Applied Sciences Potsdam. He received a bachelor’s degree in Audiovisual Systems Engineering from the Technical University of Catalonia and a Master’s degree in Interface Design from the University of Applied Sciences Potsdam. His research focuses on Human-Computer Interaction (HCI), Information Visualization and User-Centered Design.

Dr. Frank Heidmann is a professor of human-computer interaction and head of the Interaction Design Lab (IDL) at FH;P (Potsdam University of Applied Sciences). He teaches user experience and human-computer interaction, and conducts research on geographic visualization and natural user interfaces for smart environments, smart cities, and ubiquitous computing.
Acknowledgment
The landslide threat maps and potential helicopter landing sites datasets were calculated by Stephanie M. Olen and Bodo Bookhagen from the Institute of Earth and Environmental Science of the University of Potsdam. We want to thank them for the productive cooperation, expert feedback and knowledge exchange. We want to thank Swann Nowak, Fabian Ehmel and Edmundo Galindo for their work on the project and our colleague Sebastian Meier for his support, valuable ideas and continuous feedback. We are also grateful to Verónica Torres Acosta for the coordination and co-organization of the workshop at the UNGRD in Colombia. We also thank the UNGRD and all interview, workshop and preliminary evaluation participants for their fruitful comments, feedback and expertise. We also appreciate the contributions by Juliane Kummerlöwe, Ralf Puchert and Rolf Lessing from Delphi IMM on the server and database part.
References
[1] Anwar, A., Nagel, T., & Ratti, C. (2014, March). Traffic origins: A Simple Visualization Technique to Support Traffic Incident Analysis. In Visualization Symposium (PacificVis), 2014 IEEE Pacific (pp. 316–319). IEEE.10.1109/PacificVis.2014.35Search in Google Scholar
[2] Bláha, J. D., & Štěrba, Z. (2014). Colour contrast in cartographic works using the principles of Johannes Itten. The Cartographic Journal, 51(3), 203–213.10.1179/1743277414Y.0000000084Search in Google Scholar
[3] Bortolaso, C., Oskamp, M., Graham, T. C., & Brown, D. (2013, October). OrMiS: a tabletop interface for simulation-based training. In Proceedings of the 2013 ACM international conference on Interactive tabletops and surfaces (pp. 145–154). ACM.10.1145/2512349.2512792Search in Google Scholar
[4] Borzo, J. (2004). Get the picture: In the age of information overload, visualization software promises to cut through the clutter. The Wall Street Journal.Search in Google Scholar
[5] Bresciani, S., & Eppler, M. J. (2009). The benefits of synchronous collaborative information visualization: Evidence from an experimental evaluation. IEEE transactions on visualization and computer graphics, 15(6).10.1109/TVCG.2009.188Search in Google Scholar PubMed
[6] Buard, E., & Ruas, A. (2007, August). Evaluation of colour contrasts by means of expert knowledge for on-demand mapping. In 23rd ICA conference (pp. 4–10).Search in Google Scholar
[7] Cawthon, N., & Vande Moere, A. (2007, July). The effect of aesthetic on the usability of data visualization. In Information Visualization, 2007. IV’07. 11th International Conference (pp. 637–648). IEEE.10.1109/IV.2007.147Search in Google Scholar
[8] Chen, C. (2010). Information visualization. Wiley Interdisciplinary Reviews: Computational Statistics, 2(4), 387–403.10.1002/wics.89Search in Google Scholar
[9] Chesneau, E., Ruas, A., & Bonin, O. (2005). Colour Contrasts Analysis For A Better Legibility Of Graphic Signs For Risk Maps. In Proc. of the International Cartographic Conference: Mapping Approaches Into A Changing World, A Coruna.Search in Google Scholar
[10] Chokshi, A., Seyed, T., Marinho Rodrigues, F., & Maurer, F. (2014, November). ePlan multi-surface: A multi-surface environment for emergency response planning exercises. In Proceedings of the Ninth ACM International Conference on Interactive Tabletops and Surfaces (pp. 219–228). ACM.10.1145/2669485.2669520Search in Google Scholar
[11] Coulibaly, I., Spiric, N., Sghaier, M. O., Manzo-Vargas, W., Lepage, R., & St-Jacques, M. (2014, July). Road extraction from high resolution remote sensing image using multiresolution in case of major disaster. In Geoscience and Remote Sensing Symposium (IGARSS), 2014 IEEE International (pp. 2712–2715). IEEE.10.1109/IGARSS.2014.6947035Search in Google Scholar
[12] Coury, B. G., & Boulette, M. D. (1992). Time stress and the processing of visual displays. Human factors, 34(6), 707–725.10.1177/001872089203400605Search in Google Scholar PubMed
[13] d3.js. https://d3js.org/. Accessed: 19 September 2017.Search in Google Scholar
[14] Doeweling, S., Tahiri, T., Sowinski, P., Schmidt, B., & Khalilbeigi, M. (2013, October). Support for collaborative situation analysis and planning in crisis management teams using interactive tabletops. In Proceedings of the 2013 ACM international conference on Interactive tabletops and surfaces (pp. 273–282). ACM.10.1145/2512349.2512823Search in Google Scholar
[15] Elmqvist, N., Vande Moere, A., Jetter, H. C., Cernea, D., Reiterer, H., & Jankun-Kelly, T. J. (2011). Fluid interaction for information visualization. Information Visualization, 10(4), 327–340.10.1177/1473871611413180Search in Google Scholar
[16] Faturechi, R., & Miller-Hooks, E. (2014). Measuring the performance of transportation infrastructure systems in disasters: A comprehensive review. Journal of infrastructure systems, 21(1), 04014025.10.1061/(ASCE)IS.1943-555X.0000212Search in Google Scholar
[17] Fuhrmann, S., & Pike, W. (2005). User-centered design of collaborative geovisualization tools. In Exploring geovisualization; Dykes, J., MacEachren, A. M., Kraak, M. J., Eds.; Elsevier Science: Amsterdam, The Netherlands, 2005; (pp. 591–610).10.1016/B978-008044531-1/50449-8Search in Google Scholar
[18] Garschagen, M., Hagenlocher, M., Comes, M., Dubbert, M., Sabelfeld, R., Lee, Y. J., … & Pott, S. (2016). World Risk Report 2016. Bündnis Entwicklung Hilft and United Nations University–Institute for Environment and Human Security (UNU-EHS).Search in Google Scholar
[19] Gortana, F., Kaim, S., von Lupin, M., & Nagel, T. (2014) Isoscope – Visualizing temporal mobility variance with isochrone maps. In Poster Abstracts of IEEE VIS 2014.Search in Google Scholar
[20] Hinckley, K., Yatani, K., Pahud, M., Coddington, N., Rodenhouse, J., Wilson, A., Benko, H & Buxton, B. (2010, October). Pen+ touch= new tools. In Proceedings of the 23nd annual ACM symposium on User interface software and technology (pp. 27–36). ACM.10.1145/1866029.1866036Search in Google Scholar
[21] Holderness, T., & Turpin, E. (2015). White paper—PetaJakarta.org: Assessing the role of social media for civic co-management during monsoon flooding in Jakarta, Indonesia. University of Wollongong, Wollongong.Search in Google Scholar
[22] Houben, S., Marquardt, N., Vermeulen, J., Klokmose, C., Schöning, J., Reiterer, H., & Holz, C. (2017). Opportunities and challenges for cross-device interactions in the wild. Interactions, 24(5), 58–63.10.1145/3121348Search in Google Scholar
[23] Hurter, C., Lesbordes, R., Letondal, C., Vinot, J. L., & Conversy, S. (2012, May). Strip’TIC: exploring augmented paper strips for air traffic controllers. In Proceedings of the International Working Conference on Advanced Visual Interfaces (pp. 225–232). ACM.10.1145/2254556.2254598Search in Google Scholar
[24] HOT-OSM. Humanitarian OpenStreetMap Team (2017). https://www.hotosm.org/. Accessed 07 August 2017.Search in Google Scholar
[25] Isenberg, P., Isenberg, T., Hesselmann, T., Lee, B., Von Zadow, U., & Tang, A. (2013). Data visualization on interactive surfaces: A research agenda. IEEE Computer Graphics and Applications, 33(2), 16–24.10.1109/MCG.2013.24Search in Google Scholar PubMed
[26] Kunz, A., Alavi, A., Landgren, J., Yantaç, A. E., Woźniak, P., Sárosi, Z., & Fjeld, M. (2013, June). Tangible tabletops for emergency response: an exploratory study. In Proceedings of the International Conference on Multimedia, Interaction, Design and Innovation (p. 10). ACM.10.1145/2500342.2500352Search in Google Scholar
[27] LogCluster (2016). Nepal Lessons Learned Report. http://www.logcluster.org/sites/default/files/logistics_cluster_nepal_lessons_learned_report_160121.pdf. Accessed: 03 August 2017.Search in Google Scholar
[28] Mapbox Studio. https://www.mapbox.com/mapbox-studio. Accessed: 19 September 2017.Search in Google Scholar
[29] Mapbox GL JS. https://www.mapbox.com/mapbox-gl-js/api/. Accessed: 19 September 2017.Search in Google Scholar
[30] Mapnificient. http://www.mapnificent.net/. Accessed: 19 September 2017.Search in Google Scholar
[31] Nagel, T., Maitan, M., Duval, E., Vande Moere, A., Klerkx, J., Kloeckl, K., & Ratti, C. (2014, May). Touching Transport – A Case Study on Visualizing Metropolitan Public Transit on Interactive Tabletops. In Proceedings of the 2014 International Working Conference on Advanced Visual Interfaces (pp. 281–288). ACM.10.1145/2598153.2598180Search in Google Scholar
[32] Neis, P., Singler, P., & Zipf, A. (2010). Collaborative mapping and emergency routing for disaster logistics–case studies from the Haiti earthquake and the UN Portal for Afrika (pp. 1–6).Search in Google Scholar
[33] Olen, S. M., & B. Bookhagen (2016). Assessing hillslope instability and natural hazard with the World DEM and TerraSAR-X SAR data in Northeast Colombia. In TerraSAR-X/TanDEM-X Science Team Meeting 2016, edited.Search in Google Scholar
[34] OpenStreetMap (2017). http://www.openstreetmap.org/. Accessed: 19 September 2017.Search in Google Scholar
[35] O’Sullivan, D., Morrison, A., & Shearer, J. (2000). Using desktop GIS for the investigation of accessibility by public transport: an isochrone approach. International Journal of Geographical Information Science, 14(1), 85–104.10.1080/136588100240976Search in Google Scholar
[36] Paelke, V., Nebe, K., Geiger, C., Klompmaker, F., & Fischer, H. (2012). Multi-modal, multi-touch interaction with maps in disaster management applications. ISPRS-international archives of the photogrammetry, remote sensing and spatial information sciences, 39, 55–60.10.5194/isprsarchives-XXXIX-B8-55-2012Search in Google Scholar
[37] Palen, L., Soden, R., Anderson, T. J., & Barrenechea, M. (2015, April). Success & scale in a data-producing organization: The sociotechnical evolution of OpenStreetMap in response to humanitarian events. In Proceedings of the 33rd annual ACM conference on human factors in computing systems (pp. 4113–4122). ACM.10.1145/2702123.2702294Search in Google Scholar
[38] Pellicani, R., Argentiero, I., & Spilotro, G. (2017). GIS-based predictive models for regional-scale landslide susceptibility assessment and risk mapping along road corridors. Geomatics, Natural Hazards and Risk, 1–22.10.1080/19475705.2017.1292411Search in Google Scholar
[39] Poiani, T. H., dos Santos Rocha, R., Degrossi, L. C., & de Albuquerque, J. P. (2016, January). Potential of collaborative mapping for disaster relief: A case study of OpenStreetMap in the Nepal Earthquake 2015. In System Sciences (HICSS), 2016 49th Hawaii International Conference on (pp. 188–197). IEEE.10.1109/HICSS.2016.31Search in Google Scholar
[40] PostGIS. http://postgis.net/. Accessed: 19 September 2017.Search in Google Scholar
[41] PostgreSQL. https://www.postgresql.org/. Accessed: 19 September 2017.Search in Google Scholar
[42] Qin, Y., Liu, J., Wu, C., & Shi, Y. (2012, November). uEmergency: a collaborative system for emergency management on very large tabletop. In Proceedings of the 2012 ACM international conference on Interactive tabletops and surfaces (pp. 399–402). ACM.10.1145/2396636.2396710Search in Google Scholar
[43] Roth, R. E., Ross, K. S., Finch, B. G., Luo, W., & MacEachren, A. M. (2010, September). A user-centered approach for designing and developing spatiotemporal crime analysis tools. In Proceedings of GIScience (Vol. 15).Search in Google Scholar
[44] Roth, R. E., Ross, K. S., & MacEachren, A. M. (2015). User-centered design for interactive maps: A case study in crime analysis. ISPRS International Journal of Geo-Information, 4(1), 262–301.10.3390/ijgi4010262Search in Google Scholar
[45] Schick, A. G., Gordon, L. A., & Haka, S. (1990). Information overload: A temporal approach. Accounting, Organizations and Society, 15(3), 199–220.10.1016/0361-3682(90)90005-FSearch in Google Scholar
[46] Schnebele, E., & Waters, N. (2014). Road assessment after flood events using non-authoritative data. Natural Hazards and Earth System Sciences, 14(4), 1007.10.5194/nhess-14-1007-2014Search in Google Scholar
[47] Selby, M. J. (1974). Dominant geomorphic events in landform evolution. Bulletin of the International Association of Engineering Geology – Bulletin de l’Association Internationale de Géologie de l’Ingénieur, 9(1), 85–89.10.1007/BF02635309Search in Google Scholar
[48] Shakeri Hossein Abad, Z., Anslow, C., & Maurer, F. (2014, November). Multi surface interactions with geospatial data: A systematic review. In Proceedings of the Ninth ACM International Conference on Interactive Tabletops and Surfaces (pp. 69–78). ACM.10.1145/2669485.2669505Search in Google Scholar
[49] Shneiderman, B. (1996). The eyes have it: A task by data type taxonomy for information visualizations. In Visual Languages, 1996. Proceedings., IEEE Symposium on (pp. 336–343). IEEE.10.1109/VL.1996.545307Search in Google Scholar
[50] Tost, J., Ehmel, F., Heidmann, F., Olen, S. M., & Bookhagen, B. (2017). Hazards and Accessibility: Combining and Visualizing Threat and Open Infrastructure Data for Disaster Management. In Proceedings of the International Cartographic Conference 2017.10.5194/ica-proc-1-115-2018Search in Google Scholar
[51] Tufte, E. R. (1990). Envisioning information. Graphics Press.Search in Google Scholar
[52] Voigt, S., Giulio-Tonolo, F., Lyons, J., Kucčera, J., Jones, B., Schneiderhan, T., et al.(2016). Global trends in satellite-based emergency mapping. Science, 353(6296), 247–252.10.1126/science.aad8728Search in Google Scholar PubMed
[53] WorldDEM (2017). WorldDEMTM: Airbus Defence and Space. http://www.intelligence-airbusds.com/worlddem/. Accessed: 07 September 2017.Search in Google Scholar
[54] Zook, M., Graham, M., Shelton, T., & Gorman, S. (2010). Volunteered geographic information and crowdsourcing disaster relief: a case study of the Haitian earthquake. World Medical & Health Policy, 2(2), 7–33.10.2202/1948-4682.1069Search in Google Scholar
© 2017 Walter de Gruyter GmbH, Berlin/Boston
Articles in the same Issue
- Frontmatter
- Editorial
- Human-Computer Interaction in Geovisualization
- Special Issue – Research Articles
- Perceptual Rules for Building Enhancements in 3D Virtual Worlds
- The Robinson House in the AR-Based Manassas Battlefield National Park Experience
- Visualization and Interaction with Multiple Devices. A Case Study on Reachability of Remote Areas for Emergency Management
- The Individual in the Data — the Aspect of Personal Relevance in Designing Casual Data Visualisations
- Research Article
- Common Challenges in Ethical Practice when Testing Technology with Human Participants: Analyzing the Experiences of a Local Ethics Committee
- News
- Tagungsbericht Mensch und Computer 2017, Regensburg
- Brief Report
- Exploring the Social Media Impact of Voting Advice Apps: A Case Study on the Representation of the Wahl-O-Mat on Twitter
- Corrigendum
- Corrigendum to: Designing a Holistic Behavior Change Support System for Healthy Aging