Research on Soft Reduction Amount Distribution to Eliminate Typical Inter-dendritic Crack in Continuous Casting Slab of X70 Pipeline Steel by Numerical Model
-
Ke Liu
 ,
Chang Wang
,
Chang Wang

Abstract
To investigate the formation of one kind of typical inter-dendritic crack around triple point region in continuous casting(CC) slab during the operation of soft reduction, fully coupled 3D thermo-mechanical finite element models was developed, also plant trials were carried out in a domestic continuous casting machine. Three possible types of soft reduction amount distribution (SRAD) in the soft reduction region were analyzed. The relationship between the typical inter-dendritic cracks and soft reduction conditions is presented and demonstrated in production practice. Considering the critical strain of internal crack formation, a critical tolerance for the soft reduction amount distribution and related casing parameters have been proposed for better contribution of soft reduction to the internal quality of slabs. The typical inter-dendritic crack around the triple point region had been eliminated effectively through the application of proposed suggestions for continuous casting of X70 pipeline steel in industrial practice.
Introductions
The continuous casting process has been adopted by many steel industries owing to its inherent advantages of low cast, high yield, flexibility of operation and the ability to produce high quality cast product. Applying soft reduction technology upon the solidification crater end is presently a dominant practice for new building slab or bloom continuous casters and has been proved to be one of the best ways to enhance the internal soundness or homogeneity of castings through the mechanical operation of the roll containment.
However, during the implementation of soft reduction, the local roll gaps are possibly variable due to the deformation of the frame of the operational segments and their bearing pedestals, or poor calibration to the displacement sensors in advance. If the deviation of the actual roll gap to the aim value is beyond a threshold, internal cracks may be induced in the solidified shell due to an excessive deformation from the soft reduction operation. As shown in Figure 1, a typical inter-dendritic crack, indicated by red color, was found around the slab triangular zone of X70 pipeline steel grade produced by a domestic steel plant. The defect grade and occurrence rate of this typical inter-dendritic crack was given in Figure 2. The sulfur segregation was found around the crack, as given in Figure 3.

The typical inter-dendritic crack around triple point region of slab.

Defect grade and occurrence rate of the typical inter-dendritic crack.

Sulfur segregation around the typical inter-dendritic crack.
It has been made clear by many researchers that all cracks in continuously casting steels originate and propagate along the interdendrites in the mushy zone. Especially, internal cracks tend to occur in the brittle temperature range,
Besides the bulging strain [4, 5] induced by ferrostatic pressure and/or the mechanical stress [6–9] imposed by the roll containment, distribution of total soft reduction amount in the soft reduction region could be another underlying mechanical cause, for the presence of high internal strain in the mush zone and the typical inter-dendritic crack around the triangular zone of slab.
Soft reduction has been proved to be the most promising way to minimize center segregation together with the strand center porosity elimination in billet [10], slab [11], bloom [12], even for the round bloom caster [13].The idea of SR(soft reduction) is to reduce the negative pressure and therefore the flow of the remaining liquid steel by applying a defined deformation from outside. Accordingly, both the porosity and centerline segregation can be alleviated to minimizing level, because the primary cause of the occurrence of macro segregation is the suction flow during solidification shrinkage.
In the past three decades, almost all soft reduction parameters, such as soft reduction zone, total soft reduction amount and soft reduction rate, were determined by laboratory experiments or plant trials, nevertheless the theoretical researches were limited. Recently, M. H. Wu [14, 15] and et al. developed a two-phase columnar solidification model to describe the effect of shell deformation, melt flow, dendrite growth on the macro-segregation behavior, and revealed more detailed mechanism and principles of SR, without quantitative analysis of SR parameters. Basing on the principle of solidification shrinkage compensation and the consideration of solidified shell deformation behavior by thermo-mechanical FEM analysis, Ke Liu [16] et al. quantify the optimum total SR amounts for bloom continuous casting with promising results concerning of center segregation improvement. Cheng Ji [12] also analyze the SR amounts of bloom caster with positive results under the consideration of volume shrinkage at the solidification crater end.
The formation of internal cracks in the billet and the blooms with soft reduction are also investigated by finite element methods [17]. Also, the methods to prevent internal cracks in the process of applying soft reduction were investigated by C. H. Moon [18] et al. and Peng Hu [19] et al. Using the convex roll or adopting corner chamfered billet were proposed to reduce center segregation and possibility of inter crack occurrence.
Zhang et al. [20]. have made a coupled thermo-mechanical analysis for the thermal process and mechanical deformation of slab casting upon an ideal operation of soft reduction without considering the effect of soft reduction amount distribution on the internal strain status around the solidification front.
As an important parameter of soft reduction for slab caster, the distribution of soft reduction amount upon the soft reduction region is mainly affected by total soft reduction amount and relative position of solidification end over the positions of the position-controlled clamping cylinders at the segments exit/entrance for VAI slab casters. Due to the variation of casting speed or any other casting parameters, the redistribution of soft reduction amount may magnify the soft reduction amount differences of related segments in the soft reduction region, inducing the rise of internal strain or possible internal cracks at the solidification front of mushy zone.
The objective of this study is to detect the reason for the typical kind of inter-dendritic crack around triple point region of slab under the operation of soft reduction technology and to give an exact explanation for principals of the soft reduction distribution during continuous casting to prevent the presence of such typical inter-dendritic crack. For this purpose, 3D coupled thermo-mechanical finite element models were developed to calculate the temperature, stress and strain in the slab during the application of soft reduction. Here, three possible types of soft reduction amount distribution in the soft reduction region, related to the internal strain status, have been presented. With these calculations the correlation between the typical inter-dendritic crack and deformation of the slab in the mushy zone was determined.
Soft reduction technology
Soft reduction of strand in the final stage of solidification, a method successfully used for suppressing center segregation and porosity, offers a possible alternative for producing materials with a low segregation level by designing different soft reduction units. For the billet or bloom caster, the units applying soft reduction are the pulling and withdrawing machines with clamping cylinders to control the roll gap of single couple of rolls. For the slab casters, the units applying soft reduction are the segments with clamping cylinder at the exit and entrance, to control the aimed soft reduction rate in the related segments upon the solidification crater end.
The basic idea of the application of soft reduction technology is to suppress the formation of macro-segregation by compensation of volume shrinkage occurring during the final stage of solidification and interrupt the suction flow of the residual enriched melt, as shown in Figure 4.
![Figure 4: Influence of the soft-reduction process on the solidification process (acc. to Suzuki et al. [21].)](/document/doi/10.1515/htmp-2016-0160/asset/graphic/htmp-2016-0160_figure4.gif)
Influence of the soft-reduction process on the solidification process (acc. to Suzuki et al. [21].)
Optimum results concerning homogeneity enhancement and risk decline of internal cracks possibility are obtained if the casting conditions are adjusted in such a way that the solid fraction at the center of the partially solidified strand was between 0.3 and 0.78 [22], 0.6 and 0.85 [23], 0.4 and 0.9 [24] when the slab passes through the soft reduction region. Figure 5 gives the illustration of aimed soft reduction region

Illustration of the aimed soft reduction region.
Mathematical model
Calculate domain and mesh details
In the present work, a two-strand straight arc type slab continuous casting machine is chosen as a specific research objective. Its schematic and calculated domain enclosed by the dashed line were shown in Figure 6 and Table 1. The aimed calculated domain consists of two slab segments applying soft reduction and a slab of 2000 mm in length.
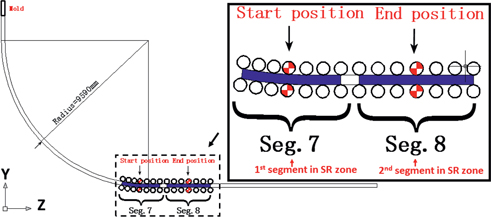
Calculate domain of the finite element model.
Distance from segments applying soft reduction to the meniscus.
| Segment number | Distance from the meniscus, m | |
|---|---|---|
| Entrances | Exits | |
| No.6 | 13.9 | 15.5 |
| No.7 | 15.8 | 17.9 |
| No.8 | 18.2 | 20.2 |
In the model, the slab moved from the start position to the end position under given casting speed and specific static roll gap taper and soft reduction rate.
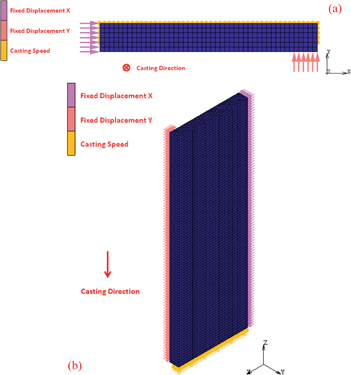
As shown in Figure 7, due to the symmetry of slabs deformation behavior in the soft reduction process, one quarter of the slab is modeled. The mesh details are also illustrated in Figure 7.

Mesh details of the finite element model.
In the 3D thermo-mechanical model, mesh size is evenly 0.02 m from slab surface to the center. Time step size changes from 0.001 s to 0.01 s It takes approximately 48 hours to complete a single simulation with around 40,000 steps on a dual Intel Core i3 CPU computer with 6.00 GB RAM running Windows XP OS.
Initial conditions
To analyze thermal status, stress /strain in the slab during the process applying soft reduction technology, fully coupled thermo-mechanical finite element models have been developed using commercial FEM code MSC.MARC. Firstly, the temperature developments in the computational domain of slab were calculated with a 2-D finite element model. The temperature field of the one quarter slice in the soft reduction region was shown in Figure 8. Then the calculated 2D temperature field was transferred to the 3-D soft reduction model and created using MSC.MARC, as the initial temperature fields by subroutine USINC.F for further calculation of the coupled thermo-mechanical analysis. The section temperature distribution along the Z direction evenly in the 3D model, as shown in Figure 8.

Initial conditions of the finite element model.
Boundary conditions
In the present work, containment effect of segments on the solidified shell and the operation of soft reduction technology is modeled through the displacement boundary conditions of the rolls and slabs in the aimed soft reduction region.
Symmetry boundaries were applied at the symmetry faces of the slab in the width (X) and thickness (Y) direction by adopting fixed displacement boundaries. Fixed displacement boundary in X direction was applied in the symmetry face of the slab in width (X) direction. And fixed displacement boundary in Y direction was applied in the symmetry face of the slab in thickness (Y) direction, only for the fully solidified parts according to the calculated 2D temperature field. The movement of the 2000 mm slab in the model was achieved through displacement boundary condition as a function of time at the end of slab, as shown in Figure 9.
Boundary conditions of the finite element model.
Figure 9(a) gives the boundary conditions from the cross section view of slab and Figure 9(b) gives the boundary conditions from another point of view.
Ferrostatic pressure
As known, the ferrostatic pressure distribute along the solidification front. The values of the ferrostatic pressure is calculated by
where
The ferrostatic pressure is treated as a homogeneous external load that pushes the shell outward. How the ferrostatic pressure of the local shell is applied under different temperature distribution conditions in a single eight-node, isoparametric and arbitrary hexahedral element could be referenced from [25].
Materials properties
In the present work, a kind of pipeline steel, X70, was chosen as specific research steel grade. The volume fractions of each phase are calculated by a micro-segregation model [26] for the X70 pipeline steel (0.04–0.16 Wt Pct C, 0.15–0.0.45 Wt Pct Si, 1.40–1.70 Wt Pct Mn, ≤0.025 Wt Pct P, ≤0.020Wt Pct S, 0.02–0.06 Wt Pct Nb, 0.02–0.1 Wt Pct V, 0.01–0.06 Wt Pct Ti) with the results shown in Figure 10.

Phase fractions of X70 pipeline steel at various temperatures.
According to the calculation results from the micro-segregation model, the liquidus temperature, solidus temperature or zero ductility temperature(ZDT), zero strength temperature(ZST), and liquid impenetrable temperature (LIT) are 1520, 1480, 1510, and 1495℃, respectively.
An important part of the constitutive model is the elastic modulus at high temperatures of interest. The true value of elastic modulus of as–cast steel still exists uncertainty at high temperatures. This is partly because of creep occurring during the test, which leads to smaller estimates of the elastic modulus. In the present work, the following relation, based on experimental data from Mizukami et al. [27] under continuous casting conditions, was used to calculate E:
Where, E is the elastic modulus, Pa.
T is the temperature of interest in ℃. This relation applies to temperature between 900℃ and liquidus temperature.
While the relation applies to temperature between 500 and 900 °C is listed as follows:
The other thermo-physical properties of the slabs in the soft reduction calculation coupled with temperature change, such as thermal conductivity, specific heat capacity, thermal expansion coefficient, change with temperatures and are taken from Ref. 26.
Constitutive equations
An important step for the accurate mathematical analysis of the mechanical phenomenon during casting process is to find and evaluate materials constitutive equations. The proper constitutive equations should reasonably describe the complex relationship between stress, strain, and time at elevated temperatures. These equations should be able to characterize mechanical behavior of the strand under the condition encountered during the soft reduction operation process. Choices in previous works include time-independent elasto-plastic relationships, elasto-plastic models with creep, unified models with evolving internal state variables, and elasto-viscoplastic models. Each of these models has both merits and problems in accuracy and numerical stability.
To model the mechanical behavior of carbon steels under continuous casting conditions, Kozlowski [28] et al. developed simple constitutive equations defining inelastic strain rate as functions of several variables such as stress, temperature, inelastic strain, and time, as follows:
Where, σ(MPa) and
To simulate the
where
The relationship between strain and stress for different temperatures at the solidification strain rates are given in Figure 11 for the ferrite phase of steels. This constitutive equation is applied in solidified shell whenever the volume fraction of ferrite is more than 10 %. Otherwise, eq. (5) is applied.

Relationship between strain and stress for different temperatures in strain rates of 1.4×10⁻⁴s−1 for
Critical strain for internal crack formation
The cracks have a relation with the strength and ductility in the mushy zone. Figure 12 shows the schematic presentation of mechanical properties of steel at high temperature.
![Figure 12: Schematic diagram of mechanical properties near the melting point during the continuous casting of steels (acc. to Y. M. Won et al. [35].)](/document/doi/10.1515/htmp-2016-0160/asset/graphic/htmp-2016-0160_figure12.gif)
Schematic diagram of mechanical properties near the melting point during the continuous casting of steels (acc. to Y. M. Won et al. [35].)
Zero strength temperature (ZST), above which the steel has no strength and no ductility and behaves as a liquid. Zero ductility temperature(ZDT) is the critical temperature below which the solidified dendritic could bear applied tensile strain.
Schmidtman [30] and Shin [31] measured ZDT and ZST of two carbon steels as a function of carbon content. The calculated complete solidification temperatures by K. H. Kim [1] are in good agreement with the ZDTs measured by Schmidtman, which can lead to the conclusion that hot tears mainly depend on the presence of the interdendritic liquid films due to the microsegregation of solute elements. When the steel is fully solidified, the interdendritic liquid film is removed and hence the possibility of cracking is reduced. Accordingly, ZDT can be defined as the temperature at which the solid fraction reaches unity (fs=1, ZDT≈Tsol). The measured ZSTs agree with the temperature at which the solid fraction becomes the critical solid fraction of about 0.7.
In the temperature between ZDT and ZST, as be known as brittle temperature range, the solidifying steel behaving like a solid, but the steel is very susceptible to crack due to the presence of the interdendritic liquid films caused by the micro-segregation of solute elements
Clyne [32] et al. proposed the CSC(crack susceptibility coefficient) to estimate the cracking tendency in continuously cast steel. They divided the mushy zone into the mass and liquid feeding zone and the cracking zone. Cracks formed in the mass and liquid feeding zone are refilled with surrounding liquid, whereas cracks formed in the cracking zone can not be refilled with the liquid because the dendrite arms are compact enough to resist feeding of the liquid. They proposed the solid fraction in the boundary between the two zones to be 0.9. Davies and Shin [33] also used the same value. Matsumiya [34] et al. used 0.85 as the solid fraction in the boundary. The temperature at the boundary is defined as liquid impenetrable temperature (LIT).
In order to estimate and predict the critical strain of internal crack formation during continuous casting, many studies have been carried out to develop the testing method and the prediction equation.
Yamanaka [36] et al. reported that internal crack initiated when the accumulated strain between ZST and ZDT exceeded the critical strain, and the critical strain decreased with increasing strain rate and proposed that ZST is the temperature at which fs=0.8 and ZDT is the temperature at which fs=0.99. Hayashi [37] et al. reported that the critical strain decreased with increasing carbon, sulfur and phosphorus content. Kim [38] et al. reported that the critical strain decreased with increasing solute elements content, because brittle temperature range between LIT and ZDT increases with increasing solute elements content.
Y. M. Won [35] et al. take into account the brittle temperature range and strain rate as follows:
Where
In order to estimate the possibility of cracks formation during the application of soft reduction technology in continuous casting slab, we used the same equation and parameters with Y. M. Won et al. to predict the critical strain of internal cracks.
In out paper, the brittle temperature range was also expressed as follows:
Machine data
The main data of a domestic two-strand slab caster supplied by VAI company and relevant casting conditions are given in Table 2. For the casting conditions, the soft reduction zone is about 2.5 m under a steady casting speed of 1.20 m/min. Under this situation, the soft reduction was applied by two successive segments No.7 and No.8.
Slab caster main data.
| Item | Value | Item | Value |
|---|---|---|---|
| Capacity | 2.5Mt/a | Tundish capacity | 70t |
| Heat size | 200t | Number of segments | 14 |
| Number of strands | 2 | Casting speed | 0.02 m/s(1.2 m/min) |
| Radius | 9.59 | Active segments | No.6 and No.7 |
| Metallurgical length(max.) | 34.5 | Length of aimed SR zone | 2.5 m |
| Mold length | 0.8 | Secondary cooling intensity | 0.6~0.9, L/kg |
| Slab section | 230×1800mm2 | Static roll gap taper | 0.2×10⁻³ m/m |
Calculated cases
This paper focusing on the casting conditions that soft reduction technology were applied through two successive related segments upon the solidification crater end.
For a single segment applying soft reduction technology, the soft reduction amount upon the first segment (SRA1) in soft reduction region could be calculated by the difference between the gaps at the entrance and exit of the segment and predefined static roll gap taper determined by the actual thermal shrinkage in the slab thickness direction, which were controlled through the clamping cylinders mounted on the segment frame, as shown in Figure 13 and eq. (8).
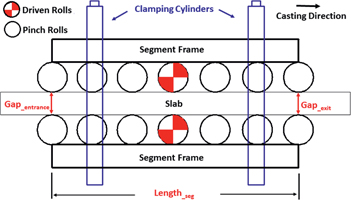
Schematic picture of the segment in slab caster.
Where,
Total soft reduction amount(TSRA) is the sum of the soft reduction amounts in all the segments of SR zone. For the casting condition in this paper:
For given total soft reduction amount (TSRA), the distribution of soft reduction amount upon the soft reduction region could be classified in three type, as shown in Table 3. For the type A of soft reduction amount distribution, the SRA1 (soft reduction amount in the first segment of soft reduction region) is equal to SRA2 (soft reduction amount in the second segment of soft reduction region). For the type B of soft reduction amount distribution, the SRA1 is smaller than the SRA2. For the type C of soft reduction amount distribution, the SRA1 is larger than the SRA2
Types of soft reduction amount distribution in the soft reduction region.
| Case No. | Type | SRA1/SRA2 | |
|---|---|---|---|
| 1 | A | SRA1/SRA2=1 | 1.00(TSRA:3.2 mm) |
| 2 | B | SRA1/SRA2<1 | 0.46 (TSRA:3.8 mm) |
| 3 | 0.53 (TSRA:2.6 mm) | ||
| 4 | C | SRA1/SRA2>1 | 3.60 (TSRA:3.2 mm) |
Results and discussion
2D temperature field and model validation
The 2D solidification model was verified by plant measured surface temperature. The surface temperature was measured by a thermal infrared camera. The relative error between the predicted and the measured temperature is about 1 %, as given in Figure 14.
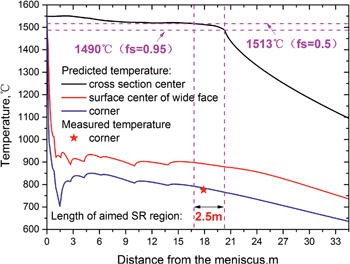
Aimed soft reduction region under given casting condition and model validation.
Figure 15 gives the solidification front in the soft reduction zone basing on the assumption that the temperature distribute evenly in the casting direction. The colored line in Figure 15 denotes the brittle temperature region around solidification front, in which ‘A’ pointed by the red arrow is the most popular position where the triple-point cracks take place. Although the slab temperature decreases gradually in the soft reduction zone depending on the cooling intensity, which is slightly different with the assumption of temperature distribution in casting direction, our thermo-mechanical model could give rational discussion on the effect of soft reduction amount distribution in SR zone on the strain status around solidification front and thus the occurrence possibility of the typical inter-dendritic cracks around triple point region.
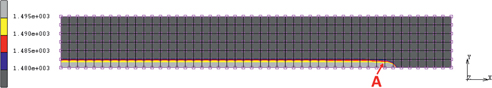
2D temperature field at the entrance of soft reduction region.
As the temperature along the focused path around triple point region from Node A to Node B in the 3D model, as given in Figure 16, is the same with that at the ‘A’ position in the 2D solidification analysis model, we could easily match up the stress results with the aimed temperature status.

Local position of the focused path around triple point region.
Internal strain status around solidification front
Taking calculated results of case No.1 as an example, the internal strain status around the solidification front in the computational domain, with the same soft reduction rate in the two successive segments, was shown in Figure 17. As only the tensile strain status could induce internal crack, in the following results and discussion sections, we choose the maximal principal strain as the variate to indicate whether the casting condition will result in the increasing of crack risk. In cloud picture of maximal principal strain, the red color indicated heavy internal tensile strain status. It could be concluded from the cloud picture that there is a peak area of maximal principal strain around the triangular zone. Although the color of peak area of maximal principal strain looks similar because of different scale was adopted, the maximal principal strain actually increased when the slab passing through the soft reduction region from the 1st segment to 2nd segment.

Internal stain status in the solidification front.
To quantitatively analyze the internal strain status around the peak area of maximal principal strain around triangular zone, a focused path around triple point region from Node A to Node B, as given in Figure 16, was selected to compare the maximal principal strain and local critical strain and to judge whether the relevant casting condition will increase of internal crack risk.
Quantitatively analysis of internal strain along focused path
As shown in Figure 18, the maximal principal strain, strain rate and related local critical strain varied with the local position in the soft reduction region under the soft reduction condition of case No.1. In this figure, the relationship between maximal principal strain and time was exported by postprocessing of the simulated results. Further, the strain rate could be obtained by the differential calculus of maximal principal strain. Then, the local critical strain was calculated through the equation mentioned above.

Maximal principal strain along the focused line around triangular zone under the soft reduction condition of case No.1 (left: in the 1st segment; right: 2nd segment).
The left figure indicates the relationship between maximal principal, local strain rate and related local critical strain when the slab located in the 1st segment of soft reduction region, and the right figure gives the relationship when the slab located in the 2nd segment of soft reduction region. From the figure, we know that the local strain rate around solidification front varied when the pinch rolls periodically contact with the slab, inducing the fluctuation of local critical strain. As the slab passing to the end of soft reduction region, the peak value of maximal principal strain gradually increased. However, the critical strain gradually decreased because of local high strain rate, which will result in the increasing of crack risk around the triangular zone while the slab located around the end of soft reduction region. From the calculated result for case No.1, the continuous casting slab is relatively safe for the occurrence of typical inter-dendritic crack because only a few part of local maximal principal strain data was higher than the local critical data.
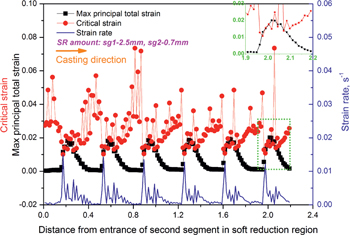
From the variation of maximal principal strain, local strain rate and local critical strain in the soft reduction region, it could be concluded that the later part of soft reduction region affected a lot on the internal strain susceptibility. The internal strain status along the focused path under soft reduction condition of case No.2, No.3 and No.4 were shown in Figures 19~21. It is easier to found that the maximal principal strain exceed the local critical strain a lot when slab located the later part of 2nd segment if the soft reduction was applied under the distribution of type B with a TSA of 3.8 mm, from Figure 19.

Maximal principal strain along the focused line around triangular zone in the 2nd segment under the soft reduction condition of case No.2.
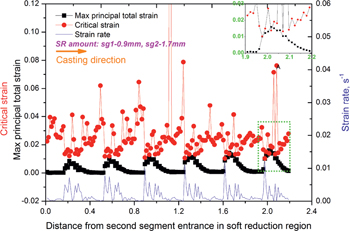
From Figure 20, we know that the maximal principal strain could be lowered below the local critical strain under the same soft reduction amount distribution of type B if TSA decreased to 2.6 mm.
Maximal principal strain along the focused line around triangular zone in the 2nd segment under the soft reduction condition of case No.3.
Meanwhile, if the soft reduction was applied under a different type of soft reduction amount distribution, type C, the internal strain status could be controlled in a safe range with a similar soft reduction amount of 3.2 mm, from Figure 21.
Maximal principal strain along the focused line around triangular zone in the 2nd segment under the soft reduction condition of case No.4.
Application results
To eliminate the typical inter-dendritic crack defect around triple point region, lots of industry trials were conducted basing on the concluded results from the numerical simulation and the slab samples were taken from both two strands in the caster, including casting speed, cooling intensity and soft reduction parameters adjustment. In order to assess the effect of soft reduction conditions on the internal quality of the as-cast strand, all the samples were macro etched to evaluate the defect grade of the typical crack basing on the standard diagram for macrostructure and defect in continuous casting slabs. The details information of the relevant trials were listed in Table 4.
Information of the casting parameters adjustment trials in details.
| Serial number | Casting Speed | Secondary cooling intensity | SR amount | Segments applying SR | SR rates in SR region(1st seg. 2nd seg.) | Cracks defect evaluation | ||
|---|---|---|---|---|---|---|---|---|
| defect grade | number | Total samples number | ||||||
| 1 | 1.0 | 0.6~0.8 | 2.5 | No.6, No.7 | 1.3 mm/m, 0.50 mm/m | 0.5 | 1 | 4 |
| 1.0 | 2 | |||||||
| 2.0 | 1 | |||||||
| 2 | 1.1 | 0.6~0.8 | 4.0 | No.7, No.8 | 0.58 mm/m, 1.52 mm/m | 1.0 | 5 | 9 |
| 1.5 | 3 | |||||||
| 2.0 | 1 | |||||||
| 3 | 1.1 | 0.6~0.8 | 3.5 | No.7, No.8 | 0.70 mm/m, 1.20 mm/m | 0 | 8 | 10 |
| 0.5 | 2 | |||||||
| 4 | 1.2 | 0.6~0.8 | 2.5 | No.8,No.9 | 0.90 mm/m, 0.60 mm/m | 0 | 3 | 3 |
To validate our calculated results, we summarized the relationship between midway crack index and the related soft reduction condition, as shown in Figure 22, in which the Midway Crack Index was the weighted average of detected grade of the typical inter-dendritic crack around triple point zone. It could be concluded that the occurrence rate and severity extent of inter-dendritic crack increased a lot while the soft reduction rate of single segment exceed 1.0 mm/m, which agreed with the calculated result of case No.2 and No.3.
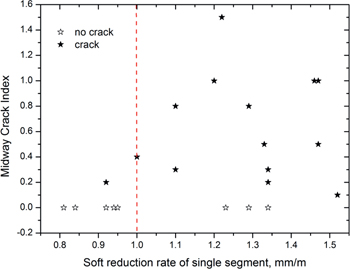
The relationship between soft reduction rate of single segment and the inter-dendritic crack index.
Optimum soft reduction region
Decisive for the success of the soft reduction process is that the position of the crater end or the area with an optimum solid fraction in the strand center is exactly determined for the regarded steel grade among all casting conditions, and the reduction of the strand thickness is controlled with great precision. As mentioned in above section, focusing on the optimum solid fraction region in the strand center, different researchers got different results basing on the varied plants, steel grades, casting conditions. The different suggestions focusing on the solid fraction region that suitable for the application of soft reduction were mainly induced by their different initial destinations of the soft reduction technology. Some of them proposed the optimum soft reduction region basing on the consideration of center segregation improvement, others may proposed the optimum soft reduction region to reduce the occurrence possibility of squeezing cracks.
For VAI slab casters, the application of soft reduction in the suggested range of a center fraction from 0.5~0.95 is more effective in suppressing the formation of core segregation. However, in actual slab SR process, the slab thickness reduction is usually executed by several segments in the solidification end region with clamping cylinders mounted on the entrance/exit of each segment. The length of a single segment is about 2.0 m. The last segment in the soft reduction region may cover the fully solidified shell. For this situation, the soft reduction amount in the last segment should be predefined carefully to diminish the typical inter-dendritic cracks according to the simulated and trials results because the interdendritic liquid film is isolated to resist feeding of surrounding liquid through the dendrite arms in the last stage of solidification.
To investigate the principles of optimum soft reduction region for slab casters, the variation of temperature in casting direction should not be neglected in the 3D model, which will be discussed in the forthcoming paper.
Conclusions
Aiming at clarification of the effect of soft reduction amount distribution in the segments of soft reduction region on the inter-dendritic crack around triangular zone, a thermo-mechanical coupled FEM model were developed to investigate the strain status around the solidification front. The following conclusions can be drawn out:
Soft reduction
Soft reduction amount distribution in the segments of soft reduction region contributes a lot to the strain status around solidification front. For the soft reduction amount distribution of type A and type C, less inter-dendritic crack would be induced by the operation of soft reduction technology with SRA of 3.2 mm under the condition of ideal roll gap status.
For the soft reduction amount distribution of type B under certain solidification status of slab, the soft reduction amount should be decreased to eliminate the inter-dendritic crack around triangular zone. The maximum soft reduction rate of single segment in the soft reduction region should be limited to 1.0 mm/m through production practice and the simulation results.
To avoid the typical inter-dendritic crack around the triangular zone in the slab, the total soft reduction amount and distribution of soft reduction amount among the aimed soft reduction region should be given carefully. It has been proved by production practice that the typical inter-dendritic crack around triangular zone could be eliminated by optimization of soft reduction distribution in the soft reduction region.
References
[1] K.H. Kim, T.J. Yeo, K.H. Oh and D.N. Lee, ISIJ Int., 36 (1996) 284–28910.2355/isijinternational.36.284Search in Google Scholar
[2] H.G. Suzuki, S. Nishimura and S. Yamaguchi, Tetsu-to-Hagane, 65 (1979) 2038.10.2355/tetsutohagane1955.65.14_2038Search in Google Scholar
[3] B.G. Thomas, ISIJ Int., 35 (1995) 737.10.2355/isijinternational.35.737Search in Google Scholar
[4] K. Okamura and H. Kawashima, ISIJ Int., 29 (1989) 666–672.10.2355/isijinternational.29.666Search in Google Scholar
[5] A. Grill and K. Schwerdtfeger, Ironmaking Steelmaking, 6 (1979) 131–135.Search in Google Scholar
[6] B. Barber, B.M. Leckenby and B.A. Lewis, Ironmaking Steelmaking, 12 (1985) 171–175.Search in Google Scholar
[7] B. Barber and A. Perkins, Ironmaking Steelmaking, 16 (1989) 406–411.Search in Google Scholar
[8] M. Deisinger and K.H. Tacke, Ironmaking Steelmaking, 24 (1997) 321–327.Search in Google Scholar
[9] M. Uehara, I.V. Samarasekera and J.K. Brimacombe, Ironmaking Steelmaking, 13 (1986) 138–153.Search in Google Scholar
[10] R. Thome and K. Harste, ISIJ Int., 46 (2006) 1839–1844.10.2355/isijinternational.46.1839Search in Google Scholar
[11] C.H. Yim, J.K. Park, B.D. You and S.M. Yang, ISIJ Int., 36 (1996) S231-S234.10.2355/isijinternational.36.Suppl_S231Search in Google Scholar
[12] C. Ji, S. Luo and M.Y. Zhu, ISIJ Int., 54 (2014) 504–510.10.2355/isijinternational.54.504Search in Google Scholar
[13] W. Rauter, J. Reiter, K. Srienc, et al., BHM, 159 (2014) 454–460.Search in Google Scholar
[14] M.H. Wu, J. Domitner and A. Ludwig, Metall. Mater. Trans. A, 43A (2012) 945.10.1007/s11661-011-0940-4Search in Google Scholar
[15] F. Mayer, M. Wu and A. Ludwig, Steel Res. Int., 81 (2010) 660.10.1002/srin.201000122Search in Google Scholar
[16] K. Liu, Q.S. Sun, J.Q. Zhang and C. Wang, Metall. Res. Technol., 113 (2016) 504–518.10.1051/metal/2016012Search in Google Scholar
[17] W.J. Wang, L.X. Ning, R. Bulte and W. Blech, J. Univ. Sci. Technol. Beijing, 15 (2008) 14–119.Search in Google Scholar
[18] C.H. Moon, K.S. Oh, J.D. Lee, S.J. Lee and Y.S. Lee, ISIJ Int., 52 (2012) 1266–1272.10.2355/isijinternational.52.1266Search in Google Scholar
[19] P. Hu, H. Zhang, X.Z. Zhang and M.Y. Zhu, ISIJ Int., 54 (2012) 2283–2287.10.2355/isijinternational.54.2283Search in Google Scholar
[20] Z.W. Lu, K.K. Cai and J.Q. Zhang, Metall. Mater. Trans. B, 32B (2001) 459–464.10.1007/s11663-001-0031-9Search in Google Scholar
[21] M. Suzuki, K. Kimura, A. Kawami, et al., Metall. Res. Technol., 89 (1992) 83–92.Search in Google Scholar
[22] K.S. Oh, 78th Steelmaking Conference Proceedings, April 2–5, 1995, Iron and Steel Society, Nashville TN, Warrendale, PA (1995), pp. 301–308.Search in Google Scholar
[23] L.X. Cui, Doctor dissertation, University of Science & Technology Beijing, Beijing (2005).Search in Google Scholar
[24] G.X. Wang, Z.G. Han, J.Q. Zhang, et al. Proceedings of the 4th International Conference on Continuous Casting of Steel in Developing Countries, November 4–7, Beijing (2008), pp. 346–352.Search in Google Scholar
[25] K. Liu, Y.H. Chang, Z.G. Han and J.Q. Zhang, J. Iron. Steel Res. Int., 20 (2013) 38–50.10.1016/S1006-706X(13)60054-0Search in Google Scholar
[26] H.Z. Qian, L.X. Cui and J.Q. Zhang, Special Steel, 2 (2010) 25–28 (in Chinese).Search in Google Scholar
[27] H. Mizukami, K. Murakami and Y. Miyashita, Iron Steel, 146 (1977) S652.Search in Google Scholar
[28] P.F. Kozlowski, B.G. Thomas, J.A. Azzi, et al., Metall. Mater. Trans. A, 23A(1992) 903–918.10.1007/BF02675567Search in Google Scholar
[29] H. Zhu, Coupled Thermal-Mechanical Finite Element Model with Application to Initial Solidification, University of Illinois, Illinois (1996).Search in Google Scholar
[30] E. Schmidtman and F. Rakoski, Arch. Eisenhuttenwes., 54 (1983) 357.10.1002/srin.198305255Search in Google Scholar
[31] G. Shin, T. Kajitani, T. Suzuki and T. Umeda, Tetsu-to-Hagane, 78 (1992) 587–593.10.2355/tetsutohagane1955.78.4_587Search in Google Scholar
[32] T.W. Clyne, M. Wolf and W. Kurz, Metall. Trans., 13B (1982) 259.10.1007/BF02664583Search in Google Scholar
[33] G.J. Davies and Y.K. Shin, The Metal Society, London (1979), 517.10.1144/GSL.SP.1979.008.01.62Search in Google Scholar
[34] T. Matsumiya, T. Saeki, J. Tanaka and T. Ariyoshi, Tetsu-to-Hagane, 68 (1982) 1782–1971.Search in Google Scholar
[35] Y.M. Won, H.N. Han, T.J. Yeo and K.H. Oh, ISIJ Int., 40 (2000) 129–136.10.2355/isijinternational.40.129Search in Google Scholar
[36] A. Yamanaka, K. Nakajima and K. Okamura, Ironmaking Steelmaking, 22 (1995) 508–512.Search in Google Scholar
[37] H. Hayashi, C. Yu, H. Shibata, et al., Bulleting I-AMP Tohoku Univ. Sendai Japan, 52 (1996) 39–44.Search in Google Scholar
[38] K. Kim, T. Yeo, K.H. Oh, et al., Iron Steel Inst. Jpn. Int., 36 (1996) 284–289.10.2355/isijinternational.36.284Search in Google Scholar
© 2017 Walter de Gruyter GmbH, Berlin/Boston
This article is distributed under the terms of the Creative Commons Attribution Non-Commercial License, which permits unrestricted non-commercial use, distribution, and reproduction in any medium, provided the original work is properly cited.
Articles in the same Issue
- Frontmatter
- Editorial
- Preface to the Special Issue on “Cutting Edge of Computer Simulation of Solidification, Casting and Refining”
- Review Article
- Recent Aspects on the Effect of Inclusion Characteristics on the Intragranular Ferrite Formation in Low Alloy Steels: A Review
- Research Articles
- Numerical Simulation and Experimental Casting of Nickel-Based Single-Crystal Superalloys by HRS and LMC Directional Solidification Processes
- Dendrite Growth Characteristics and Segregation Control of Bearing Steel Billet with Rotational Electromagnetic Stirring
- Deformation and Structure Difference of Steel Droplets during Initial Solidification
- Research on Soft Reduction Amount Distribution to Eliminate Typical Inter-dendritic Crack in Continuous Casting Slab of X70 Pipeline Steel by Numerical Model
- Effect of Composition, High Magnetic Field and Solidification Parameters on Eutectic Morphology in Cu-Ag Alloys
- Processing and Microstructure Characteristics of As-Cast A356 Alloys Manufactured via Ultrasonic Cavitation during Solidification
- Mathematical Modeling on Deformation Behavior of Solidified Shell in Continuous Slab Casting with Soft Reduction
- Effect of Construction Manner of Mould Cluster on Stray Grain Formation in Dummy Blade of DD6 Superalloy
- Review Article
- Application of Mathematical Models for Different Electroslag Remelting Processes
- Research Articles
- Numerical Modeling of Fluid Flow, Heat Transfer and Arc–Melt Interaction in Tungsten Inert Gas Welding
- Analysis of Power Supply Heating Effect during High Temperature Experiments Based on the Electromagnetic Steel Teeming Technology