Chromizing of Additively Manufactured Maraging Steel; Microstructural Evolution and Corrosion Performance
-
C. V. Funch
 ,
K. V. Dahl
,
K. V. Dahl

Abstract
While maraging steels are excellent candidates for additive manufacturing of high-strength materials, most of them provide little to no corrosion resistance. In this study, the surface of additively manufactured maraging steel is augmented with diffusion-based chromizing. The diffusion of chromium into the surface results in the formation of α-Cr, σ-phase and austenite depending on the chromium content at the respective distance from the surface. The bulk consists of a ductile bcc martensite hardened by precipitation of intermetallics during a low temperature ageing treatment. The σ-case provides a very high hardness, while the austenite phase is rather soft and unaffected by the ageing treatment. The chromizing treatment significantly reduced the corrosion rate of the maraging steel up to a factor of 14. Decomposition of the σ-case into a uniform case of austenite (austenitic stainless steel) further improved the corrosion resistance almost 24 times. This showed the strong potential of the chromizing treatment on a highstrength material to obtain a combination of their beneficial properties.
Kurzfassung
Martensitaushärtende Stähle sind zwar hervorragende Kandidaten für die additive Fertigung hochfester Werkstoffe, bieten aber meist nur eine geringe oder gar keine Korrosionsbeständigkeit. In dieser Studie wird die Oberfläche von additiv hergestelltem, martensitaushärtendem Stahl durch eine Chromierung auf Diffusionsbasis veredelt. Die Diffusion von Chrom in die Oberfläche führt zur Bildung von α-Cr, σ-Phase und Austenit in Abhängigkeit vom Chromgehalt im jeweiligen Abstand von der Oberfläche. Das Grundmaterial besteht aus duktilem bcc-Martensit, der durch Ausscheidung von intermetallen Phasen während einer Niedrigtemperatur-Auslagerungsbehandlung gehärtet wird. Die σ-Schicht sorgt für eine sehr hohe Härte, während die Austenitphase eher weich ist und durch die Auslagerungsbehandlung nicht beeinträchtigt wird. Durch die Chromierungsbehandlung wurde die Korrosionsrate des martensitaushärtenden Stahls um bis zu einem Faktor von 14 verringert. Die Zersetzung der σ-Phase in eine einheitliche Austenitphase (austenitischer, nichtrostender Stahl) verbesserte die Korrosionsbeständigkeit um fast das 24-fache. Dies zeigt das große Potenzial der Chromierungsbehandlung in Verbindung mit einem hochfesten Werkstoff, um eine Kombination von vorteilhaften Eigenschaften zu erzielen.
1 Einleitung
Die additive Fertigung von Metallen (AM) nähert sich dem Status einer praktikablen Produktionsmethode für eine Vielzahl von Anwendungen in der Luft- und Raumfahrt, der Medizin-, Dental-, Energie- und Automobilindustrie [1]. Zu den Hauptvorteilen der additiven Fertigung gegenüber konventionellen Herstellungsverfahren gehören kurze Vorlaufzeiten, volle geometrische Freiheit, geringerer Bedarf an teuren Werkzeugen und Bearbeitungsvorgängen sowie die Möglichkeit der Produktion von Kleinserien oder der vollständigen Anpassung an Kundenwünsche [1, 2]. Bei der Metall-AM sind pulverbasierte Verfahren am weitesten verbreitet, wobei das Laser-Pulverbett-Verfahren (L-PBF) eine herausragende Stellung bei der Verarbeitung der meisten AM-Metalle einnimmt [2, 3]. Beim L-PBF-Verfahren wird ein Hochenergielaser über ein Metallpulverbett gerastert, wodurch das Pulver an den gewünschten Stellen selektiv geschmolzen und verfestigt wird. Anschließend wird die Bauplattform abgesenkt, eine neue Pulverschicht verteilt und der Laser tastet die nächste Schicht ab. Der Prozess wird so lange wiederholt, bis die endgültige Bauteilgeometrie erreicht ist. Die schnelle Werkzeugherstellung und die Fertigung von Werkzeugen mit einzigartigen Geometrien haben den Einsatz von Werkzeugstählen in der Metall-AM-Prozesskette vorangetrieben. Herkömmliche kohlenstoffhaltige Werkzeugstähle wie H13 lassen sich zwar im L-PBF-Verfahren verarbeiten, stellen jedoch aufgrund der (lokal) schnellen Abkühlungsraten, die zu einer ungleichmäßigen Martensitbildung und Rissbildung führen, eine Herausforderung dar [3, 4]. Martensitaushärtende Stähle bieten eine gute Alternative zu kohlenstoffhaltigen Werkzeugstählen. Hier ist der entstehende Lattenmartensit im Wesentlichen kohlenstofffrei und deutlich weicher und duktiler als der Platten-/Lentikularmartensit, der sich in kohlenstoffhaltigen Werkzeugstählen bildet. Martensitische Stähle erhalten ihre Festigkeit und Härte durch die Bildung von intermetallischen Phasen, die sich bei einer anschließenden Auslagerungsbehandlung ausscheiden. Diese Stähle zeichnen sich durch eine hervorragende Kombination von Festigkeit und Duktilität aus [3, 5]. Während verschiedene martensitaushärtende Stähle durch Metall-AM bearbeitet wurden [6, 7], ist die Legierung 18Ni-300 oder M300 Gegenstand umfangreicher Forschungen [8, 9, 10, 11, 12, 13]. Während der L-PBF erstarren M300-Stähle als Austenit. In der Regel sind diese primären Austenitkörner in Richtung des größten Wärmestroms, d. h. in Aufbaurichtung, gestreckt und weisen eine innere Zellstruktur auf. Beim Abkühlen bilden sich innerhalb dieser länglichen Austenitkörner weiche Martensitlamellen [2, 10, 14].
Umfangreiche Forschungsarbeiten haben sich mit der Optimierung der Auslagerung von additiv gefertigten martensitischen Stählen im Bereich von 450–520 °C befasst [9, 11]; eine Auslagerung über 525–550 °C führte zu einer Überalterung des Materials [15, 16]. Die Überalterung verringert sowohl die Härte als auch die Festigkeit des Werkstoffs infolge der Vergröberung von Ausscheidungen [5,9]. Wie die meisten in L-PBF hergestellten Metalle weist auch M300 eine gewisse mechanische Anisotropie auf, die eine Lösungsglühung erfordert, um isotrope Eigenschaften zu erzielen [11, 15, 17]. Der Härtungseffekt während der Auslagerung von M300 ist das Ergebnis der Ausscheidung von Ni3Ti, Ni3Mo und/oder Fe2Mo [8, 10, 18]. Die M300-Legierung ist ein chromfreier martensitaushärtender Werkzeugstahl und weist daher eine geringe bis keine Korrosionsbeständigkeit auf. Suryawanshi et al. verglichen den martensitaushärtenden Stahl L-PBF mit seinem konventionellen Gegenstück und stellten minderwertige Eigenschaften fest, die auf das Vorhandensein von Porositäten zurückgeführt wurden [19]. Es wurde auch festgestellt, dass die Auslagerungsbehandlung die Korrosionsbeständigkeit des Werkstoffs aufgrund der galvanischen Kopplung in Verbindung mit der Ausscheidung intermetallischer Phasen verschlechtert [20, 21]. Anoop et al. stellten fest, dass das aus L-PBF hergestellte M300 aufgrund einer hohen Porosität sehr anfällig für Spannungsrisskorrosion ist, was durch heißisostatisches Pressen (HIP) verringert werden konnte [12]. Soweit den Autoren bekannt ist, wurde bisher keine Untersuchung veröffentlicht, in der eine spezielle Oberflächenbehandlung zur Verbesserung der Korrosionseigenschaften von L-PBF M300 in Betracht gezogen wurde.
Das Hinzufügen von Chrom zur Stahloberfläche durch Chromatieren ist ein recht gut dokumentiertes Verfahren und wird üblicherweise durch Packungszementierung durchgeführt. Dabei wird ein Bauteil in ein chromhaltiges Pulver gepackt und im Temperaturbereich von 900–1100 °C geglüht, wobei durch Festkörperdiffusion die Oberfläche des Bauteils mit Cr angereichert wird. Die Wechselwirkung zwischen Chrom und dem Stahlbauteil hängt von der Zusammensetzung des Werkstoffs ab. Traditionell führt das Chromatieren von kohlenstoffhaltigen Stählen zur Entwicklung einer sehr harten und spröden Oberflächenschicht aus Chromkarbid. Obwohl Chromkarbid eine gewisse Verbesserung der Korrosionsbeständigkeit bewirkt, werden vor allem die Härte und die Verschleißfestigkeit verbessert. Bei relativ niedrigen Kohlenstoffgehalten wird Cr hauptsächlich im Mischkristall gelöst, und bei Temperaturen im Bereich von 700‒800 °C kann sich an der Oberfläche eine σ-Phase entwickeln, die neben einer gewissen Verbesserung der Korrosionsbeständigkeit auch ein besseres Verschleißverhalten bewirkt. Soweit den Autoren bekannt ist, wurden bisher keine Versuche unternommen, martensitaushärtende Werkzeugstähle zu chromatieren, die durch additive Fertigung oder konventionelle Fertigung hergestellt wurden.
Diese Studie befasst sich mit dem Chromatieren von additiv hergestelltem martensitaushärtendem M300-Stahl, seiner Oberflächenhärtung und seinen Auswirkungen auf die Korrosionsbeständigkeit des Materials.
2 Materialien und Methoden
Proben aus der martensitaushärtenden Legierung M300 wurden auf einem SLM280 HL-Doppellaserdrucker L-PBF hergestellt. Die quaderförmigen Proben wurden für die Charakterisierung der Mikrostruktur hergestellt, während die zylindrischen Proben für Korrosionsmessungen verwendet wurden. Das Pulver für diese Studie wurde von SLM Solutions geliefert und die Zusammensetzung der M300-Legierung ist in Tabelle 1 angegeben. Das Pulver hatte einen mittleren Durchmesser von 32 μm. Die wichtigsten Herstellungsparameter sind in Tabelle 2 aufgeführt. Die Herstellung erfolgte in einer Stickstoff-Schutzatmosphäre.
Es wurden drei verschiedene proprietäre Chromierungsbehandlungen mit den in Tabelle 3 angegebenen Parametern durchgeführt: zwei Temperaturstufen (niedrig und hoch) und zwei Zeitstufen (kurz und lang). Alle Proben wurden vor der Behandlung auf einer Seite mit Schleifpapier der Körnung 4000 geschliffen, um eine reproduzierbare Oberflächenbeschaffenheit zu gewährleisten.
Standardzusammensetzung von M300, geliefert von SLM Solutions
Table 1. Standard composition of M300 as supplied by SLM Solutions
| Fe | Ni | Co | Mo | Ti | Al | Mn | Si | P | S | C | |
|---|---|---|---|---|---|---|---|---|---|---|---|
| Min [wt%] | Balance | 18.00 | 8.50 | 4.70 | 0.50 | 0.05 | – | – | – | – | – |
| Max [wt%] | Balance | 19.00 | 9.50 | 5.20 | 0.80 | 0.15 | 0.10 | 0.10 | 0.01 | 0.01 | 0.03 |
Parameter für die Massenherstellung von L-PBF M300
Table 2. Bulk manufacturing parameters for L-PBF M300
| Layer height [μm] | Laser Power [W] | Scan speed [mm/s] | Hatch spacing [μm] | Platform temperature [°C] | Scan strategy | |
|---|---|---|---|---|---|---|
| Bulk | 50 | 400 | 805 | 100 | 100 | Stripes |
Eigene Parameter für die Chromierungsbehandlung
Table 3. Proprietary chromizing treatment parameters
| Temperature | Time | |
|---|---|---|
| Cr1 | High | Long |
| Cr2 | High | Short |
| Cr3 | Low | Short |
Bestimmte Proben wurden einer Nachwärmebehandlung unterzogen. Hochtemperaturlösungsbehandlungen wurden bei 940 °C in einem Hochvakuumofen bei einem Druck von 10‒6 mbar für 1 Stunde durchgeführt. Die Auslagerung bei niedriger Temperatur wurde bei 500 °C für 6 Stunden durchgeführt, entsprechend der Empfehlung des Pulverlieferanten. Die Auslagerung erfolgte unter Hochvakuumbedingungen (wie oben beschrieben). Die Zersetzung der gehärteten Oberflächenschicht wurde bei 1080 °C für 1 Stunde durchgeführt, gefolgt von einer Auslagerung unter Hochvakuum. Der mit Hochtemperaturlösung behandelte und ausgelagerten Zustand wird mit SA bezeichnet, der ausgelagerten Zustand mit A. Der zersetzte Zustand wird mit D bezeichnet.
Die mikrostrukturelle Charakterisierung erfolgte nach der standardmäßigen metallographischen Präparation. Zum Ätzen wurde Vilellas Reagenz mit einem 2-minütigen Abstrich verwendet. Mikrohärteeindrücke wurden an polierten Proben auf einem FutureTech FM-700 mit einer Last von 5 g und einer Verweilzeit von 10 s durchgeführt. Alle dargestellten Härteprofile wurden über zwei getrennte Profile gemittelt; die Härtewerte für das Grundmaterial wurden über 10 Eindrücke gemittelt. Alle Eindrücke hatten einen Abstand von mindestens dem dreifachen Durchmesser des Eindrucks. Die Phasenanalyse wurde mit einem Bruker D8 Discovery Diffraktometer durchgeführt, das mit Cr Kα-Strahlung ausgestattet war und ein symmetrisch gekoppeltes θ–2θ-Fokussierungsprinzip verwendete. Diffraktogramme wurden mit einer Schrittweite von 0,03 °2θ und einer Messzeit von 6 s pro Schritt im Bereich von 30– 160 °2θ aufgenommen. Die Lichtmikroskopie (LOM) wurde an den geätzten Proben mit einem Zeiss Axio Vert.A1 Inver Lichtmikroskop durchgeführt. Rasterelektronenmikroskopie (SEM) und energiedispersive Spektroskopie (EDS) wurden mit einem Zeiss Supra FEGSEM durchgeführt, das mit einem Silizium-Drift-EDS-Detektor ausgestattet ist. Die Rückstreuelektronenbeugung (EBSD) wurde mit der EDS gekoppelt und mit einem Zeiss Sigma FEGSEM gemessen.
Die Korrosionsbeständigkeit wurde für die lösungsbehandelten und ausgelagerten sowie für die chromierten und nach der Wärmebehandlung zersetzten Proben bewertet. Zyklische potentiodynamische Polarisationstests (CPP) wurden in einer 3,5 Gew.-%igen natürlich belüfteten NaCl-Lösung in entmineralisiertem Wasser durchgeführt. Die Prüfung wurde bei Raumtemperatur mit einem ACM-Potentiostat durchgeführt. Die der Lösung ausgesetzte Fläche wurde vor jedem Test erfasst. Das Leerlaufpotential (OCP) wurde vor den Polarisationsmessungen 600 slang gemessen. Das CPP wurde mit einem zyklischen Sweep mit einer Abtastrate von 0,5 mV/s von –300 mV bis 1200 mV in Bezug auf den Ort des OCP ermittelt. Die korrodierte Oberfläche wurde mithilfe eines Keyence VHX-6000 Digitalmikroskops untersucht.
3 Ergebnisse und Interpretationen
3.1 Röntgenbeugung
Die Röntgenbeugung wurde eingesetzt, um die Phasen zu identifizieren, die sich während der L-PBF von M300 und während der Chromierung nach dem Bau gebildet haben. Bild 1 zeigt, dass der Ausgangszustand vollständig aus einer bcc-Phase besteht, d. h. aus dem bereits erwähnten bcc-Martensit. Die Lösungsbehandlung und die Auslagerung führen ebenfalls zu einem überwiegend bcc-Mikrogefüge, wobei ein kleiner 111-Peak aus fcc-Austenit sichtbar ist. Dies deutet darauf hin, dass die Auslagerungsbehandlung aufgrund der Instabilität des bcc-Martensits zur Bildung von Reversionsaustenit geführt hat, ein bekanntes Phänomen bei der Auslagerung von martensit aushärtend Stählen [5, 6, 10, 22]. Die bcc-Peaks im eingebauten Zustand scheinen bei niedrigeren Streuwinkeln aufzutreten als im lösungsbehandelten und ausgelagerten Zustand, was auf das Vorhandensein von Druckeigenspannungen im eingebauten Zustand hindeutet. Die intermetallischen Phasen, die sich während der Auslagerung ausscheiden, sind im Diffraktogramm für den lösungsbehandelten und den ausgelagerten Zustand nicht zu erkennen, da sie sehr fein sind.
Das Diffraktogramm für den chromierten Zustand scheint hauptsächlich aus der bcc-Phase und der intermetallischen σ-Phase zu bestehen. Die bcc-Peaks sind zu kleineren Beugungswinkeln verschoben, was entweder auf eine andere Zusammensetzung oder einen anderen Spannungszustand hinweist. Es ist nicht möglich, das Vorhandensein von Austenit auszuschließen, da die drei fcc-Peaks, die bei Chromstrahlung zu beobachten wären, mit den Peaks der σ-Phase zusammenfallen. Lösungsbehandlung und Auslagerung scheinen keine Auswirkungen auf das Diffraktogramm der chromierten Probe zu haben. Die Chromierung scheint zu schmaleren α-Peaks zu führen als der lösungsbehandelte und ausgelagerten Zustand.
3.2 Charakterisierung des Mikrogefüges
Das LOM zeigt deutliche Unterschiede zwischen dem Ausgangszustand und dem lösungsbehandelten und ausgelagerten Zustand (siehe Bild 2). Der Ausgangszustand weist deutliche Merkmale des L-PBF-Prozesses auf. Die länglichen früheren Austenitkörner spiegeln die Richtung des größten Wärmestroms und die epitaktische Keimbildung auf dem zuvor erstarrten Material wider. Bei stärkerer Vergrößerung, siehe Bild 2b, ist die zelluläre Subkornstruktur des L-PBF-Materials im Inneren der Martensitlamellen zu erkennen. Ein gewisses Maß an Porosität ist ein inhärentes Merkmal der durch L-PBF hergestellten Werkstoffe.
Diese zellulären Strukturen können in den Rückstreuelektronenbildern (BSE) in Bild 3 genauer beobachtet werden. Das Erscheinungsbild der zellulären Struktur ist bei den verschiedenen Körnern unterschiedlich, da sie säulenförmig sind. Je nachdem, wie sie geschnitten werden, können sie gleichachsig, elliptisch oder als parallele Linien erscheinen. Das Mikrogefüge des lösungsbehandelten und ausgelagerten Zustands weist keine Reste des L-PBF-Ursprungs mehr auf. Das Mikrogefüge besteht vollständig aus Lattenmartensit (Bild 2b und d), ähnlich wie bei konventionell hergestelltem M300. Porositäten sind sowohl im Ausgangszustand als auch im lösungsbehandelten und ausgelagerten Zustand zu finden (Bild 2a und c). Die länglichen Porositäten sind so ausgerichtet, dass ihr Scheitelpunkt senkrecht zur Baurichtung liegt. Diese Porositäten entstehen als Folge unzureichender Laserleistung, sogenannte Lack-of-Fusion-Porositäten. Kleinere und kugelförmige Porositäten entstehen durch Gaseinschlüsse aus dem L-PBF-Prozess.
Die Gefüge im chromierten Zustand sind in Bild 4 für die verschiedenen Behandlungsbedingungen dargestellt. Die Dicke der σ-Schicht hängt von der Behandlungstemperatur und -zeit ab. Cr1 und Cr2 unterscheiden sich in der Behandlungszeit, während Cr2 und Cr3 sich nur in der Temperatur unterscheiden. Die längere Behandlungszeit von Cr1 führte bei weitem zur dicksten Schicht der σ-Phase. Ein charakteristisches Merkmal nach dem Chromatieren von dem martensitaushärtenden Stahl M300 ist die Bildung von Rissen senkrecht zur Oberfläche in der σ-Phasenschicht. Die Ausrichtung der Risse deutet darauf hin, dass sie von Zugspannungen herrühren; höchstwahrscheinlich entstehen diese Risse an der Grenzfläche zwischen der σ-Phase und dem Grundmaterial. Die Risse werden durch die Kombination einer unterschiedlichen thermischen Schrumpfung von Substrat und Schicht während der Abkühlung und insbesondere durch die mit der Martensitbildung verbundene Volumenausdehnung im Substrat verursacht. Interessanterweise hat sich während der Cr1-Behandlung eine Schicht auf der σ-Phase entwickelt, in der die Risse zum Stillstand kommen. Unter der σ-Phase ist eine helle Schicht sichtbar, insbesondere bei Cr2 (Bild 2d). Das Grundmaterial spiegelt den Einfluss der Chromierungstemperatur wider. Cr3 wird bei einer niedrigeren Temperatur als Cr1/Cr2 durchgeführt, und es ist ein längliches Korngefüge vorhanden, das dem Ausgangszustand ähnelt (vgl. gestrichelte Linien in Bild 2a und 4e).
Die Proben aus den Cr2- und Cr3-Behandlungen wurden direkt nach der Chromierung ausgelagerten (siehe Bild 5). Es sind geringfügige Unterschiede zwischen dem chromierten und dem chromierten und ausgelagerten Zustand festzustellen. Insbesondere bei höheren Vergrößerungen scheint es, dass die Martensitlamellen deutlicher ausgeprägt sind als im verchromten Zustand, was möglicherweise auf die Ausscheidung intermetallischer Phasen an den Lamellengrenzflächen oder die Austenitumwandlung an dieser Stelle zurückzuführen ist. Außerdem hat sich unterhalb der σ-Phasenschicht eine unregelmäßige Zone entwickelt (siehe insbesondere Bild 5b); in dieser Zwischenzone setzen sich die Risse nicht fort.
Die Veränderungen im Gefüge infolge der Lösungsbehandlung und der Auslagerung nach dem Chromieren sind in Bild 6 dargestellt. Es sind keine wesentlichen Unterschiede im Grundmaterial festzustellen, da die Lösungsbehandlung das Gefüge in Austenit zurückverwandelt und sich beim Abkühlen wieder Martensit bildet. Die Lösungsbehandlung hat zur Entwicklung eines ausgeprägten weißen Bereichs zwischen der σ-Phase und dem Martensit geführt, der als Ergebnis der Interdiffusion zwischen der σ-Phase und dem Grundmaterial während der Hochtemperatur-Lösungsbehandlung interpretiert wird. In Bild 6c befindet sich in der Nähe der Oberfläche eine große Porosität, die mit der Chromierungsatmosphäre in Verbindung gestanden haben muss, da die Oberfläche dieser Porosität ebenfalls chromatiert ist.
Der Oberflächenbereich des Cr1-Zustands nach Lösungsbehandlung und Auslagerung wird in Bild 7 mittels REM genauer betrachtet. Der schichtweise Aufbau der Oberfläche ist deutlich zu erkennen. Die ursprüngliche Oberfläche ist durch eine Reihe schwarzer Vertiefungen gekennzeichnet, wobei die σ-Schicht leicht nach innen, aber größtenteils von der ursprünglichen Oberfläche nach außen wächst. Unter der σ-Schicht befindet sich ein ungleichmäßiger Bereich mit einer dunklen Phase, gefolgt von einem Übergangsbereich und dem bbc-martensitischen Grundmaterial. Die äußerste Schicht unterscheidet sich von der σ-Schicht und ist meist gleichmäßig über die Oberfläche verteilt. Der vertikale Riss durchdringt die gesamte σ-Schicht, scheint aber durch die gleichmäßige dunkle Schicht unter der σ-Schicht und durch die dünne äußerste Schicht eingeengt zu werden.
3.3 Mikrohärteprofile
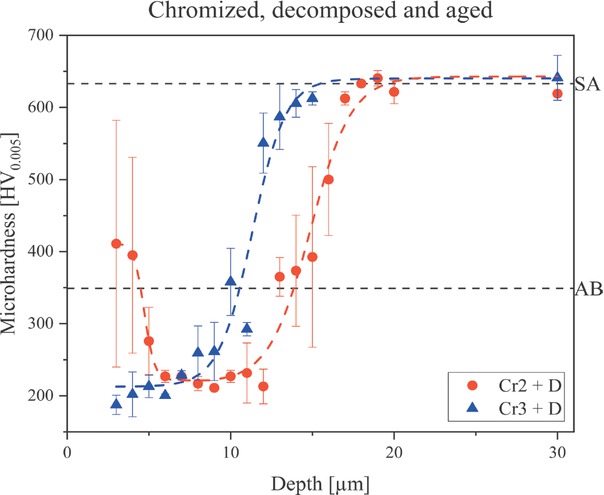
Die Mikrohärteprofile für die verschiedenen Chromierungs- und Glühbedingungen sind in Bild 8 dargestellt. Im Vergleich zu den Chromierungen im unbehandelten Zustand führt Cr1 zu einer höheren Oberflächenhärte und einer höheren Härtetiefe. Die Härte des Grundmaterials ist bei allen Behandlungen ähnlich, wenn auch etwas niedriger als die Härte im eingebauten Zustand (durch die gestrichelte Linie AB gekennzeichnet). Die Verringerung der Substrathärte erklärt sich aus dem Verschwinden der feinen Zellstruktur (siehe Bild 3) und der damit verbundenen Verfestigungswirkung. Bei der Cr1-Behandlung wird ab einer Tiefe von 15 μm eine Zone von ~5 μm beobachtet, in der die Härte unter des Grundmaterials liegt.
Die Auslagerung von Cr2 und Cr3 direkt nach dem Chromieren härtet das Grundmaterial auf das gleiche Niveau wie der lösungsbehandelte und ausgelagerten Zustand (angezeigt durch die gestrichelte Linie SA). Die Oberflächenhärte ist für den chromierten und den chromierten und nachträglich ausgelagerten Zustand vergleichbar. Die geringfügigen Unterschiede in der maximalen Härte für den Zustand Cr3 vor und nach der Auslagerung sind nicht auf mikrostrukturelle Unterschiede zurückzuführen, sondern auf die sehr dünne σ-Phasenschicht, die genaue Härteeindruckmessungen am Querschnitt erschwert. Sowohl bei Cr2 als auch bei Cr3 ist die Masse durch die Auslagerungsbehandlung nicht gleichmäßig gehärtet. Beide Proben weisen eine dünne Zone auf, in der die Härte viel niedriger ist als in der Oberfläche und im Hauptteil. Diese Zone entspricht dem unregelmäßig geformten hellen Bereich in Bild 5b.
Die Mikrohärteprofile nach zusätzlicher Lösungsbehandlung und Auslagerung nach dem Chromatieren zeigen einen Bereich, in dem das Material während der Auslagerung nicht gehärtet wird. Diese Zone ist bei der Cr1-Behandlung am breitesten, gefolgt von Cr2 und Cr3. Der Bereich mit geringer Härte entspricht der ungleichmäßigen Zone unterhalb die σ-Schicht (Bild 7). Die Härte im weichen Bereich von Cr1+SA ist sogar niedriger als im eingebauten Zustand und identisch mit dem weichen Bereich von Cr1 im chromierten Zustand. Die Härtewerte in den weichen Bereichen von Cr2+SA und Cr3+SA sind etwas niedriger als im direkt ausgelagerten Zustand. Dies wird auf das Wachstum der Zone unterhalb die σ-Schicht durch fortgesetzte Diffusion während der Lösungsbehandlung zurückgeführt, sodass die Härteeindrücke in diesen Zonen weniger durch das Vorhandensein benachbarter Phasen mit höherer Härte beeinflusst werden. Daraus wird gefolgert, dass die Zusammensetzung dieser Zone die Ausscheidung von verstärkenden intermetallischen Verbindungen, die in M300 während der Auslagerung verwendet werden, nicht zulässt.
3.4 Zusammensetzung und Phasenanalyse
An der Cr1+SA-Probe wurde eine EBSD-Phasenidentifizierung durchgeführt, um die verschiedenen Phasen zu unterscheiden, die sich während der Chromierungsbehandlung und als Ergebnis der nachfolgenden Glühbehandlungen gebildet haben (siehe Bild 9). Die σ-Schicht wurde als tetragonale FeCr-Verbindung identifiziert, die zur Raumgruppe P42/mnm gehört. Die σ-Körner scheinen säulenförmig und senkrecht zur Oberfläche des Materials ausgerichtet zu sein, ohne dass eine starke Präferenz für die kristallografische Ausrichtung besteht. Die fcc-Phase unterhalb der σ-Schicht ist nicht einheitlich, sondern scheint auf die Diffusion von Chrom entlang Korngrenzen angewiesen zu sein. Die Austenitkörner sind größer als die neu gebildeten Körner in der σ-Schicht. Die Grundmasse und die äußerste Schicht werden beide als dieselbe bcc-Phase identifiziert, bei der es sich wahrscheinlich um bcc-α-Cr (mit einem gewissen Fe-Anteil) an der Oberfläche und bcc-Martensit in der Masse handelt, da die Kikuchi-Muster zwischen den beiden Phasen nicht unterschieden werden konnten. Dies wird durch die mittels EDS beobachteten Unterschiede in der Zusammensetzung bestätigt. Jede Martensitlamelle hat eine bestimmte Ausrichtung, enthält jedoch eine Verteilung von Korngrenzen mit niedrigem Winkel, die von den Korngrenzen der Lamellen mit hohem Winkel umgeben sind.
Die EDS-Kartierung wurde durchgeführt, um einen Einblick in die Elementverteilung nach dem Chromieren, der Lösungsbehandlung und der Auslagerung zu erhalten. Die EDS-Karte der gehärteten Schicht der Cr1+SA-Probe ist in Bild 9 dargestellt. Es sind vier verschiedene Zonen zu erkennen, die mit den REM- und Mikrohärteprofilen in Bild 6 bzw. 8 übereinstimmen. Die äußerste Schicht ist ausschließlich mit Chrom angereichert und an anderen Legierungselementen verarmt. Die Schicht der σ-Schicht enthält hauptsächlich Cr, Mound Fe, mit einer deutlichen Verarmung an Ni und Co. Die unmittelbar an die σ-Phasenschicht angrenzenden Bereiche sind an Mo verarmt. Die Austenitzone hat einen geringeren Chromgehalt und eine Verarmung an anderen Legierungselementen in geringerem Maße als die σ-Phase. Titan scheint entlang der ursprünglichen Oberfläche konzentriert zu sein, d. h. zwischen dem Teil der σ-Schicht, der in das Material hineingewachsen ist, und dem Teil, der nach außen gewachsen ist, was mit der Lage der Gruben in Bild 7 übereinstimmt. Außerdem tritt eine deutliche Konzentration von Titan entlang der Korngrenzen in der Austenitzone auf. Ti hat im Allgemeinen eine geringe Löslichkeit in Austenit.
Die EDS-Zusammensetzungsprofile werden in Bild 10 für die drei verschiedenen Chromierungsbedingungen nach Lösungs- und Auslagerungsbehandlung verglichen. Die α-Cr-Schicht über der σ-Phase des Cr1+SA-Zustands weist einen hohen Cr-Gehalt und einen geringeren Ni-Gehalt auf, während Mound Co nicht erkennbar sind. Bei der Cr1+SA-Probe nimmt der Chromgehalt in der σ-Phase mit der Tiefe ab, wobei es an den Grenzflächen zur Schicht und zum Stahlsubstrat zu Diskontinuitäten kommt. Am Übergang von der σ-Phase zum Stahl treten in allen Zusammensetzungsprofilen Unstetigkeiten auf. Unterhalb der σ-Phase tritt eine Zone auf, in der der Chromgehalt allmählich abnimmt, bis eine weitere Diskontinuität im Cr-Gehalt auftritt, während die anderen Elemente keine solche Diskontinuität aufweisen. Für den Cr2+SA-Zustand unterscheiden sich die Elementverteilungen von denen des Cr1+SA-Zustands. Die Eisen- und Chromgehalte sind über die Dicke der σ-Phase konstant, und der mit Chrom angereicherte Bereich unterhalb der σ-Phase ist weniger ausgeprägt. Darüber hinaus ist der Chromgehalt an der Oberfläche niedriger als im Cr1+SA-Zustand, und es ist keine Schicht mit einem Chromgehalt von über 50 % vorhanden. Dies stimmt mit den mikroskopischen Beobachtungen überein (Bild 4 und 7), wonach die äussere Schicht die Risse in der σ-Phase bei der Cr1-Chromierung stoppt. Die Cr3+SA-Probe weist ein ähnliches Zusammensetzungsprofil wie die Cr2+SA-Probe auf, ist aber flacher. Neben einer flacheren Härtung weist der Cr3+SA-Zustand einen geringeren Chromgehalt in der σ-Schicht auf. Bei allen Chromierungsbehandlungen ist eine deutliche Verarmung an Molybdän an der Grenzfläche zwischen der gehärteten Schicht und der Grundmasse festzustellen, da Mo in die σ-Phase gezogen wird.
3.5 Zersetzung der σ-Phase
Die σ-Phase gilt im Allgemeinen als eher spröde, sodass bei Anwendungen, bei denen die Korrosionsbeständigkeit im Vordergrund steht, die σ-Phase zersetzt werden kann und Cr in das Material diffundiert. Die Zersetzung der σ-Phase wurde untersucht, indem die Proben 1 Stunde lang bei 1080 °C geglüht wurden, d. h. außerhalb des Stabilitätsbereichs der σ-Phase. Die Röntgendiffraktogramme der zersetzten σ-Phase der Chromierungsbehandlungen Cr2 und Cr3 in Bild 11 zeigen, dass sich Austenit auf dem Martensit-Substrat gebildet hat. Die Cr3-Behandlung wurde bei einer niedrigeren Temperatur als die Cr2-Behandlung durchgeführt, was zu einer dünneren σ-Schicht führte, siehe Bild 4 und 8. Der dickere Einsatz für Cr2 löste sich nicht vollständig auf, und ein Teil der σ-Phase blieb erhalten. Die Dicke der Austenitschicht verhindert die Beobachtung des Martensits in der Grundmasse.
Das zerlegte Mikrogefüge für Cr2 und Cr3 ist in Bild 12 zu sehen. Wie bei der XRD-Untersuchung (Bild 11) beobachtet, löst sich die σ-Schicht, die aus der Cr2-Behandlung resultiert, nicht vollständig auf, und es ist eine dünne äußere Schicht aus erhaltenem σ zu sehen. Dies ist wahrscheinlich auf die Auflösung der σ-Schicht zurückzuführen, die von der Grenzfläche aus durch Diffusion von Cr weiter in die Masse erfolgt, sodass ein ausreichend hoher Cr-Gehalt verbleibt, um eine dünne Schicht der σ-Phase an der Oberfläche zu erhalten. Die Cr3σ-Schicht wird nach der Zersetzungswärmebehandlung vollständig in Austenit umgewandelt. Interessanterweise scheint die Zersetzungsbehandlung die Risse über der σ-Schicht zu schließen (siehe Bild 4‒7). Die Diffusionszone neigt dazu, sich bevorzugt an bestimmten Stellen auszubreiten. Das Grundmaterialgefüge ist identisch mit dem in Bild 6 gezeigten Zustand nach Lösungsbehandlung und Auslagerung.
Die Mikrohärteprofile in Bild 13 stimmen mit einer teilweisen Zersetzung der σ-Schicht auf der Cr2-Probe überein, da eine etwas höhere Oberflächenhärte mit einer großen Standardabweichung beobachtet wird. Dies spiegelt eine sehr dünne Schicht der zurückgehaltenen σ-Phase wider. Die Härte der zersetzten Cr3-Probe entspricht dem austenitischen rostfreien Stahl. Die Gesamthärte ist identisch mit der des lösungsbehandelten und ausgelagerten Zustands, da der Zersetzung eine Auslagerung folgte (siehe Experimentelles).
Die Zusammensetzungsprofile für Cr2 nach der Zersetzungswärmebehandlung bestätigen das Vorhandensein von Resten der σ-Phase, während sie bei Cr3+D nicht vorhanden ist (Bild 14). Die Dicke der σ-Phase ist geringer als im lösungsbehandelten und ausgelagerten Zustand (Bild 10). Die Cr3-Chromierung nach der Zersetzung hat eine ähnliche Zusammensetzung wie die des austenitischen rostfreien Stahls in der Nähe der Oberfläche, d. h. einen Chromgehalt von ~15 Gew.-%. Offensichtlich hat sich Titan in einer Tiefe von etwa 5 μm (an der ursprünglichen Oberfläche) angesammelt, was mit den Cr2+SA- und Cr3+SA-Positionen identisch ist (siehe Bild 10). Die Zusammensetzung der Grundmasse wird durch die Zersetzungsglühung nicht beeinträchtigt.
3.6 Potentiostatische Messungen
Die Polarisationskurven, die sich aus den potentiostatischen Messungen ergeben, die im SA-Zustand sowie im chromierten und nachgeglühten Zustand für Cr2 und Cr3 durchgeführt wurden, sind in Bild 15 dargestellt. Die berechneten Korrosionsraten sind in Tabelle 4 aufgeführt. Der SA-Zustand wurde als Referenz gewählt, da das Material normalerweise in diesem Zustand eingesetzt wird, um angemessene mechanische Eigenschaften zu gewährleisten. Der SA-Zustand weist eine schlechte Korrosionsbeständigkeit auf, was durch das stark negative Korrosionspotenzial und die hohe Korrosionsstromdichte zum Ausdruck kommt. Es wurden zwei Wiederholungen für die Zustände Cr2+A und Cr3+A durchgeführt. Der nachgelagerte Zustand wurde gewählt, da das Material im chromierten Zustand aufgrund der unzureichenden Härte nicht eingesetzt werden kann (siehe Bild 8). Der Cr2+A-Zustand scheint korrosionsbeständiger zu sein als der Cr3+A-Zustand. Das Korrosionspotenzial ist leicht verbessert, aber die Korrosionsstromdichte und damit die Korrosionsrate sind deutlich geringer. Der anodische Teil der Polarisationskurve ist zu niedrigeren Stromdichten hin verschoben. Der Cr3+A-Zustand hat ein verbessertes Korrosionspotenzial im Vergleich zu SA und eine allgemeine Verschiebung der Polarisationskurve zu einem niedrigeren Stromdichteniveau. Für Cr3+A wurde im Vergleich zu Cr2+A eine höhere Korrosionsrate berechnet.
Die Lösungsbehandlung und die Auslagerung nach dem Chromieren haben keinen großen Einfluss auf das Korrosionspotenzial von Cr2 und Cr3. Bei Cr3 ist der anodische Teil der Kurve zu niedrigeren Stromdichten hin verschoben, während er bei Cr2 mit dem Zustand Cr2+A übereinstimmt. Cr3+A und Cr3+SA haben ähnliche Korrosionsraten. Bei Cr2+SA ist jedoch eine deutliche Verbesserung der Korrosionsrate des Materials gegenüber dem direkt ausgelagerten Gegenstück festzustellen. Der zersetzte Zustand für Cr2 weist das höchste Korrosionspotenzial für alle Proben auf, die mit derselben Chromierungsbehandlung bearbeitet wurden.
Die Oberflächen der untersuchten Proben sind in Bild 16 dargestellt. Die SA-Probe ist stark korrodiert und die Oberfläche ist vollständig rissig und blättert ab. Die Chromierungsbehandlungen verändern das Aussehen nach den Polarisationstests erheblich. Bei der Cr2+A-Behandlung tritt etwas Lochfraß auf, der durch eine Lösungsbehandlung vor der Auslagerung und durch die Zersetzung der σ-Schicht weiter verbessert wird. Bei den Cr2+SA- und Cr2+D-Proben werden nur sehr wenige Grübchen festgestellt, aber den orangefarbenen/braunen Bereichen auf den Oberflächen nach zu urteilen, hat sich etwas Eisenhydroxid gebildet. Die Lochfraßbildung bei Cr3 ist stärker, wie aus den Polarisationskurven in Bild 15 und den Korrosionsraten in Tabelle 4 hervorgeht. Es ist auch zu erkennen, dass die Zersetzung von Cr3 keine wesentliche Verbesserung des Korrosionsverhaltens bewirkt. Die Lochfraßkorrosion der Cr3+SA-Probe scheint sich leicht zu verbessern.
4 Diskussion
4.1 Auswirkung der Chromierung auf das Gefüge
Die Chromierung durch thermoreaktive Abscheidung und Diffusion (TRD) hat sich als praktikable Oberflächenbehandlung für additiv hergestellten M300 erwiesen (Bild 4). Es überrascht nicht, dass die Reaktion des Materials auf die Chromierungsbehandlung von der Behandlungstemperatur und -zeit abhängt, was sich in der Dicke der harten σ-Schicht für Cr1–Cr3 widerspiegelt. Sowohl eine niedrigere Behandlungstemperatur als auch eine kürzere Behandlungszeit führten zu einer dünneren σ-Schicht.
LOM (Bild 4–6) und REM (Bild 7) zeigten eine deutliche Zone unterhalb der σ-Schicht mit einer ungleichmäßigen Grenzfläche zum darunter liegenden Martensit. Diese Zone fällt mit einem Bereich geringerer Härte zwischen der sehr harten σ-Phase und der Grundmasse zusammen, siehe Bild 8. Die Dicke dieser Zone nimmt mit der Prozesstemperatur und -zeit ab. Die scheinbar höhere Härte dieser Zone für Cr3 ist auf die begrenzte Dicke und die Beiträge der benachbarten (härteren) Phasen bei Härteeindrücken zurückzuführen. Um die Art und den Ursprung dieser Phase zu verstehen, wurden die Gleichgewichts-Volumenanteile der wichtigsten Phasen für die Zusammensetzung in jeder in Cr1+SA beobachteten Schicht berechnet (Bild 10): α-Cr(Fe), σ-Phase, Austenit und Martensit, siehe Bild 17.
In der äußeren α-Cr(Fe)-Schicht ist die bcc-Phase über den gesamten Temperaturbereich stabil, mit wenig bis gar keiner Stabilität von fcc. Die Zusammensetzung des σ-Bereichs ermöglicht es, dass die bcc-Phase bei hohen Temperaturen stabil ist und sich bei niedrigeren Temperaturen in σ umwandelt. Im Austenitbereich ist hauptsächlich Austenit stabil mit einer gewissen Stabilität von σ und bcc bei niedrigen Temperaturen. Dies ist eine übliche Beobachtung bei Gleichgewichtsberechnungen für austenitische, nichtrostende Stähle. In der Martensitregion ist die Stabilität von bcc (im Vergleich zur Austenitregion) erhöht und die Stabilität von σ nicht gegeben, da diese Phase die Einbindung von Cr erfordert. Die Stabilisierung von Austenit gegenüber bcc-Martensit ist unerwartet, da Chrom ein bekannter Ferritstabilisator in Eisenbasislegierungen ist [23]. Die Kombination von Chrom mit den Austenitstabilisatoren Nickel und Kobalt in M300 unterdrückt die Bildung von Martensit. Dies steht im Einklang mit empirischen Beziehungen zwischen der Martensitstarttemperatur (MS) und der Stahlzusammensetzung, die zeigen, dass sowohl Ni als auch Cr die MS senken, während Co die MS erhöht [24]. Bei einem hohen Cr-Gehalt ist die MS also niedriger als bei einem Stahl mit niedrigem (oder gar keinem) Cr-Gehalt. Diese verbesserte Austenitstabilität spiegelt sich in der beobachteten weichen Austenitphase unterhalb der σ-Schicht wider. Diese Interpretation steht im Einklang mit der Härte in dieser Zone und dem austenitähnlichen Aussehen, das nach der Zersetzung der σ-Phase beobachtet wird (vgl. Bild 6 und 12).
Ursprünglich wurden bei Cr1 Zugrisse in der σ-Schicht beobachtet (Bild 4 und 6), weshalb die Chromierungsbehandlung angepasst wurde, um den Ursprung dieser Risse zu verstehen und sie zu begrenzen oder zu beseitigen. Bei den sanfteren Prozessparametern in Cr2 und Cr3 blieben die Risse in der σ-Schicht jedoch bestehen. Dies deutet darauf hin, dass die Risse nicht mit dem Chromierungsprozess selbst zusammenhängen, sondern durch die Abkühlung nach der Chromierung verursacht werden. Bei den Chromierungstemperaturen ist die M300-Legierung austenitisch. Beim Abkühlen entstehen Spannungen im Stahl und in der σ-Schicht, zunächst als Folge der Umwandlung der äußeren Schicht in die σ-Phase und der unterschiedlichen Wärmeausdehnungskoeffizienten von Austenit und σ-Phase. Wahrscheinlich schrumpft der Austenit stärker als die σ-Phase, was zu Druckspannungen in der σ-Phase führt, die durch geringe Zugspannungen in dem relativ dicken Stahlsubstrat ausgeglichen werden. Die Umwandlung von Austenit in Martensit geht mit einer Volumenausdehnung des Stahls einher und überlagert dadurch Zugspannungen in der σ-Phase. Die (plötzlichen) Umwandlungsspannungen werden für die beobachteten Risse in der spröden σ-Phase verantwortlich gemacht.
4.2 Auswirkung des Nachglühens auf das chromierte Gefüge
Die verschiedenen Arten der Wärmebehandlung, d. h. Aushärtung, Lösungsglühen und Aushärtung und σ-Zersetzung, haben unabhängig von den angewandten Chromierungsparametern eine ähnliche Wirkung auf die chromierten Gefüge. Die Auslagerungsbehandlung hat nur sehr geringe Auswirkungen auf das chromierte Gefüge (σ-Schicht und Austenitzone), während das Grundmaterial auf das gleiche Niveau wie im SA-Zustand gehärtet wird. Durch die Lösungsbehandlung nach der Chromierung diffundiert das Chrom tiefer in das Material, wodurch sich insbesondere der weiche Austenitbereich vergrößert (Bild 8). Interessanterweise scheint der Austenitbereich durch die Auslagerungsbehandlung nicht gehärtet werden zu können, weder direkt nach dem Chromieren noch nach einer Lösungsbehandlung nach dem Chromieren. Die wichtigste härtende Ausscheidung in der M300-Legierung ist das intermetallische Ni3Ti, und die Fähigkeit, in der Austenitzone zu härten, wird wahrscheinlich durch die Bildung dieser Ausscheidung eingeschränkt. Wie die EDS-Analyse zeigt (siehe Bild 9 und 10), neigt Ti dazu, sich in der Nähe der Austenit/σ-Phasen-Grenzfläche und entlang der Korngrenzen im Austenitbereich anzureichern. Wahrscheinlich zieht die hohe Reaktivität von Ti die Atome bereits beim Erhitzen an die ursprüngliche Oberfläche, da die Anreicherung eher an der ursprünglichen Oberfläche als an der Oberfläche der σ-Schicht erfolgt. Möglicherweise bildet Ti Verbindungen mit der flüchtigen Atmosphäre (Cl oder O). Die Anreicherung von Titan könnte erklären, warum die Austenitphase während der Auslagerung nicht gehärtet wird, da Titan nicht zur Bildung des wichtigen intermetallischen Ni3Ti zur Verfügung steht. Da der Gesamtgehalt an Titan nur durchschnittlich 0,65 Gew.-% beträgt, ist die Verarmung an Titan in der Austenitzone schwer zu erkennen, da die EDS-Zahlen viel niedriger sind als bei den anderen Legierungselementen; in den α-Cr(Fe)- und σ-Schichten wurde jedoch nur sehr wenig Ti beobachtet, und auch der Ti-Gehalt in der Austenitzone ist gering. Vergleicht man die Gleichgewichtsanteile von Ni3Ti in den verschiedenen Regionen (Bild 17, unten rechts), so kann sich nur in der Grundmasse eine signifikante Menge des Intermetalls bilden. Im Bereich der Austenitzusammensetzung ist eine gewisse Stabilität vorhanden, aber wahrscheinlich ist der größte Teil des in diesem Bereich gemessenen Ti entlang der Korngrenzen und der ursprünglichen Oberfläche gebunden. Außerdem bilden die Ni3Ti-Ausscheidungen eine stabile, kohärente Grenzfläche mit der bcc-Matrix, was im Austenitbereich aufgrund von Unterschieden in der Kristallstruktur möglicherweise nicht realisierbar ist [25].
Die weiche Austenitzone könnte die Anwendbarkeit von chromiertem M300 bei mechanisch-belasteten Anwendungen einschränken, da der sogenannte Eierschaleneffekt berücksichtigt werden muss. Dies könnte jedoch weniger nachteilig sein als in herkömmlichen Fällen einer harten Oberfläche auf einem weicheren Substrat, da die Austenitzone recht dünn ist und der Grundmaterial-Martensit wahrscheinlich die für die Festigkeit des Werkstoffs entscheidende Phase ist. Außerdem kann das Vorhandensein des duktilen Austenits als Puffer dienen, der plastische Verformungen aufnehmen kann. Andererseits kann die duktilere Phase bei Anwendungen von Vorteil sein, bei denen die Duktilität unter der Oberfläche wichtig ist, z. B. bei Anwendungen mit Kontaktermüdung in Verbindung mit Oberflächenverschleiß. Eine Austenitschicht auf der Oberfläche kann auch als Barriere für die Wasserstoffdiffusion von Vorteil sein, da die Diffusionsrate von Wasserstoff in Austenit gering ist under Wasserstoff einschließen kann [26, 27]. Dies könnte als Werkstoff für Power-To-X-Anwendungen interessant sein.
Die σ-Phase wird zersetzt, um die Korrosionsbeständigkeit des chromierten M300 weiter zu verbessern. Die Zersetzung erfolgt bei hoher Temperatur und beruht auf der fortgesetzten Diffusion von Chrom in die Grundmasse bis zu einem Niveau, bei dem der Cr-Gehalt an der Oberfläche nicht mehr ausreicht, um die σ-Phase zu erhalten. Bei der angewandten Zersetzungstemperatur von 1080 °C destabilisiert ein Chromgehalt von weniger als ~20 Gew.-% die σ-Phase. Dies wird durch den Vergleich der Zusammensetzungsprofile von Cr2+D und Cr3+D in Bild 14 deutlich. Die Zersetzung der σ-Phase ist bei Cr2 unvollständig (siehe auch die Röntgendiffraktogramme in Bild 11), wo ein Oberflächenchromgehalt von ~30 Gew.-% gemessen wird. Die Auflösung der σ-Phase findet bei Cr3 statt, wo der Oberflächenchromgehalt nach der Vakuumbehandlung ~15 Gew.-% beträgt.
Ein weiterer wichtiger Effekt der (teilweisen) Auflösung der σ-Phase ist das Verschwinden der oben erwähnten Risse in der σ-Phase. Dies ist wie folgt zu erklären. Bei der „Zersetzungstemperatur“ werden die Risse durch die Wärmeausdehnung der Schicht und des Substrats geschlossen, sodass die Diffusionsbindung die Risse heilen kann. Die Auflösung der σ-Phase durch Diffusion des Chroms nach innen bildet einen stabilen Austenitbereich als Puffer zwischen der σ-Schicht und der Grundmasse. Während der martensitischen Umwandlung des Austenits im Stahl kann die damit verbundene Volumenausdehnung plastisch im Austenit aufgenommen werden und führt nicht zu Rissen, weder im Austenit noch in der zurückgehaltenen σ-Phase.
4.3 Einfluss des Chromierens und Glühens auf die Korrosionsbeständigkeit
Die Martensitaushärtungslegierung M300 weist im lösungsbehandelten und ausgelagerten Zustand ein sehr schlechtes Korrosionsverhalten auf, wie die potentiostatischen Messungen zeigen (Bild 15 und 16 und Tabelle 4). Daher ist es wichtig, den durch die Chromierung erreichbaren Korrosionsschutz zu untersuchen, damit die hervorragenden mechanischen Eigenschaften der Martensitaushärtenden-Legierung auch unter Bedingungen genutzt werden können, bei denen eine schlechte Korrosionsbeständigkeit untragbar wäre.
Vergleicht man die Korrosionsleistungen der Cr2+A- und Cr3+A-Bedingungen, so wird der Effekt der dickeren Diffusionszone und σ-Schicht von Cr2 aufgrund der höheren Behandlungstemperatur deutlich. Während Cr2+A die Korrosionsrate um mehr als das Vierfache verbessert, verbessert Cr3+A sie um den Faktor 2. Durch eine Lösungsbehandlung der Cr2-chromatierten Proben vor der Auslagerung wird die Korrosionsleistung erneut erheblich verbessert, wobei die Korrosionsrate im Vergleich zum lösungsbehandelten und ausgelagerten Zustand um den Faktor 12 sinkt. Dies wird auf die tiefere Austenitzone unterhalb der σ-Schicht zurückgeführt. Obwohl die Zersetzung der σ-Phase nur teilweise abgeschlossen war, ist die Korrosionsrate im Vergleich zum lösungsbehandelten und ausgelagerten Zustand immer noch um das 20-fache reduziert. Dies ist zum Teil auf die bereits erwähnte Diffusion von Chrom in die Grundmasse zurückzuführen, die nach der Zersetzungsbehandlung stärker ausgeprägt ist als nach der Lösungsbehandlung. Außerdem wirkt sich das Fehlen von Rissen positiv auf den Korrosionsschutz des chromierten Schicht aus.
Der größte Unterschied zwischen den beiden Chromierungszuständen besteht in der Reaktion auf nachfolgende Hochtemperaturbehandlungen. Während die Korrosionsbeständigkeit der Cr2-Chromierung sowohl durch die Lösungsbehandlung als auch durch die σ-Phasenzersetzung erheblich verbessert wird, hat die hohe Temperatur nur eine begrenzte Auswirkung auf den Cr3-Zustand. Es wird angenommen, dass dies auf die relativ dünne Chromschicht zurückzuführen ist. Während der Hochtemperaturbehandlung diffundiert das Chrom tiefer in den Stahl. Die geringe anfängliche Schichtdicke hat zu einer Verringerung des Cr-Gehalts an der Oberfläche auf 15 Gew.-% geführt, was offenbar nicht ausreicht, um die im Cr3+SA-Zustand erzielte Verringerung der Korrosionsrate aufrechtzuerhalten. Eine kürzere Zersetzungszeit könnte diese schlechtere Korrosionsleistung beheben.
Obwohl im Cr2+SA-Zustand Risse vorhanden waren, wirkten sie sich nicht negativ auf die Korrosionsbeständigkeit aus. Dies ist auf die darunter liegende Austenitschicht mit hohem Chromgehalt zurückzuführen, die verhindert, dass die Risse den darunter liegenden korrosionsanfälligen Martensit erreichen. Obwohl die Korrosionsrate der Chromierungsbehandlung Cr1 in dieser Studie nicht untersucht wurde, wird erwartet, dass sie aufgrund der dickeren σ-Schicht und der stabilisierten Austenitzone deutlich besser abschneidet als Cr2. Außerdem weist der Cr1-Zustand eine dünne α-Cr(Fe)-Schicht über der σ-Phase auf, die verhindert, dass die Risse die Oberfläche erreichen. Die Zersetzung der σ-Schicht scheint die beste Korrosionsbeständigkeit zu bieten, sodass es wichtig ist, die Nachbehandlung auf die Anforderungen einer bestimmten Anwendung abzustimmen. In einigen Fällen könnte es wünschenswerter sein, einen Kompromiss aus Lösungsglühen und Auslagern als Nachchromierungsglühbehandlung zu wählen, wobei die hohe Oberflächenhärte der σ-Phase erhalten bleibt. Daher muss die Kombination von mechanischen, tribologischen und Korrosionseigenschaften für eine bestimmte Anwendung priorisiert werden. Da die L-PBF-Mikrostruktur durch die Chromierungsbehandlung zurückgesetzt wird, könnten diese Beobachtungen möglicherweise auch auf konventionell hergestellte M300-Bauteile angewendet werden.
5 Schlussfolgerungen
In dieser Studie wurden drei verschiedene Chromierungsbedingungen und ihre Auswirkungen auf das Gefüge und die Korrosionsbeständigkeit von additiv gefertigtem, martensitaushärtendem Stahl verglichen. Verschiedene Wärmebehandlungen wurden angewandt, um das Gefüge, die Phasenverteilung, die mechanischen Eigenschaften und die Korrosionsbeständigkeit der Oberflächen zu beeinflussen, und es können folgende Schlussfolgerungen gezogen werden:
Das Chromieren von martensitischem Stahl führt zur Bildung einer sehr harten Schicht aus σ-Phase, die von der ursprünglichen Oberfläche nach außen wächst. Diese σ-Schicht wird von einer Schicht aus stabilisiertem Austenit getragen, das eine ähnliche Zusammensetzung wie austenitischer rostfreier Stahl aufweist. Dies ist darauf zurückzuführen, dass das Cr die MS-Temperatur senkt und dadurch die γ-Phase bei niedrigeren Temperaturen stabilisiert.
Die Dicke und Zusammensetzung der σ-Schicht und der Austenit-Schicht hängt sowohl von der Chromierungstemperatur als auch von der Zeit ab. Ein ausreichend hoher Chromgehalt in der Oberfläche bewirkt die Bildung einer dünnen, gleichmäßigen Schicht aus α-Cr(Fe) auf der σ-Schicht.
Die Zersetzung der σ-Phase erfolgt durch Diffusion von Chrom in die Grundmasse und Absenkung des Cr-Gehalts der Oberfläche unter den Stabilitätsbereich von σ. Wenn die Zersetzung unvollständig ist, verbleibt eine dünne Schicht aus σ an der äußeren Oberfläche, was zeigt, dass die Zersetzung an der Grenzfläche zwischen σ und der Grundmasse beginnt. Bei der Zersetzung von σ bildet sich eine einheitliche Austenitschicht auf dem Martensit-Substrat.
In der σ-Schicht bilden sich senkrecht zur Oberfläche Risse aufgrund der unterschiedlichen Wärmeausdehnung der verschiedenen Phasen und der martensitischen Umwandlung der Masse in bcc-Martensit. Diese Risse werden durch die Zersetzung von σ geschlossen, wahrscheinlich durch Interdiffusion von Chrom.
Die Chromierungsbehandlungen verringerten die Korrosionsrate des martensitischen Stahls erheblich, wobei ein höherer Chromgehalt und eine dickere Schicht die Korrosionsbeständigkeit effizienter verbesserten. Die Korrosionsbeständigkeit könnte durch eine Lösungsglühbehandlung oder idealerweise durch die Zersetzung von σ in γ weiter verbessert werden.
1 Introduction
Metal additive manufacturing (AM) approaches the status of a viable production method for a variety of applications in aerospace, medical, dental, energy and automotive industries [1]. The main benefits of AM over conventional manufacturing processes include short lead times, full geometrical freedom, reduced need for expensive tooling and machining operations as well as the possibility of low-batch production or full customization [1, 2]. For metal AM, powder-based processes are the most widespread, with laser powder-bed fusion (L-PBF) holding a prominent position for processing of most AM metals [2, 3]. In the L-PBF process, a high-energy laser is rastered over a bed of metal powder, selectively melting and solidifying the powder at desired locations. Subsequently, the build platform is lowered, a new layer of powder is distributed, and the laser scans the next layer. The process is repeated until the final component geometry is achieved. Rapid tooling and fabrication of tools with unique geometries have driven the implementation of tool steels in the metal AM process chain. Traditional carbon-bearing tool steels, such as H13, while processable by L-PBF, present challenges due to (local) rapid cooling rates that lead to nonuniform martensite formation and crack development [3, 4]. Maraging steels provide a strong alternative to carbon-bearing tool steels. Here, the lath martensite that develops is essentially carbon-free and considerably softer and more ductile than the plate/lenticular martensite that forms in carbon-bearing tool steels. Maraging steels receive their strength and hardness through the formation of intermetallic phases that precipitate during a subsequent ageing treatment. These steels exhibit an excellent combination of strength and ductility [3, 5]. While different maraging steels have been processed using metal AM [6, 7], the 18Ni-300 or M300 alloy has been the subject of extensive research [8, 9, 10, 11, 12, 13]. During L-PBF, M300 steels solidify as austenite. Usually, these primary austenite grains are elongated in the direction of the largest heat flux, i. e. the build direction, and have an internal cell structure. Upon cooling, soft martensite laths form inside these elongated austenite grains [2, 10, 14].
Extensive research has focused on optimization of ageing of additively manufactured maraging steels in the range 450–520 °C [9, 11]; ageing above 525–550 °C resulted in over-ageing of the material [15, 16]. Over-ageing reduces both the hardness and strength of the material as a result of precipitate coarsening [5, 9]. As with most L-PBF produced metals, M300 exhibits a degree of mechanical anisotropy, which requires a solution heat treatment to achieve isotropic properties [11, 15, 17]. The hardening effect during ageing of M300 is a result of the precipitation of Ni3Ti, Ni3Mo and/or Fe2Mo [8, 10, 18]. The M300 alloy is a chromium-free maraging tool steel and therefore has little to no corrosion resistance. Suryawanshi et al. compared L-PBF maraging steel to its conventional counterpart and found inferior properties, which were attributed to the presence of porosities [19]. It was also found that the ageing treatment deteriorated the corrosion resistance of the material due to the galvanic coupling associated with the precipitation of intermetallic phases [20, 21]. Anoop et al. found that L-PBF manufactured M300 was highly susceptible to stress corrosion cracking due to a high level of porosity, which could be reduced by applying hot isostatic pressing (HIP) [12]. To the authors’ knowledge at this stage, no research has been published, where a dedicated surface treatment is considered for improving the corrosion properties of L-PBF M300.
Adding chromium to the surface of steel through chromizing is a rather well-documented process and is commonly conducted through pack cementation. This involves packing a component in a chromium-containing powder and annealing in the temperature range of 900–1100 °C, where solid state diffusion enriches the surface of the component in Cr. The interaction between chromium and the steel component depends on the composition of the material. Traditionally, chromizing of carbon-containing steels leads to the development of a very hard and brittle surface layer of chromium carbide. Although chromium carbide provides some improvement of the corrosion resistance, the hardness and wear resistance are particularly improved. At relatively low carbon contents, Cr is mainly dissolved in solid solution and for temperatures in the range of 700‒800 °C σ-phase can develop at the surface, which also provides improved wear performance along with some improvement in corrosion resistance. To the authors’ knowledge, no attempts have been made to chromize maraging tool steels made by additive manufacturing or conventional manufacturing.
This study addresses chromizing of additively manufactured maraging M300 steel and its surface hardening response and its impact on corrosion resistance of the material.
2 Materials and Methods
Specimens of the maraging alloy M300 were manufactured on a SLM280 HL twin-laser L-PBF printer. Cuboid specimens were manufactured for microstructure characterization, while cylindrical specimens were utilized for corrosion measurements. The powder for this study was supplied by SLM Solutions and the composition of the M300 alloy is given in Table 1. The powder had a median diameter of 32 μm. The most important manufacturing parameters are provided in Table 2. The manufacturing was conducted in a protective atmosphere of nitrogen.
Three different proprietary chromizing treatments were conducted with the parameter levels given in Table 3: two temperature levels (low and high) and two time levels (short and long). All specimens were ground on one side with sandpaper grit #4000 before treatment to ensure a reproducible surface finish.
Post heat treatments were conducted on specific specimens. High temperature solution treatments were conducted at 940 °C in a high vacuum furnace at a pressure of 10-6 mbar for 1 h. Low temperature ageing was conducted at 500 °C for 6 h, following the recommendation from the powder supplier. Ageing was conducted under high vacuum conditions (as stated above). Decomposition of the hardened surface layer was conducted at 1080 °C for 1 h followed by ageing under high vacuum. The solution treated and aged condition is denoted by SA, while the aged condition is denoted by A. The decomposed condition is denoted by D.
Microstructure characterization was conducted following standard metallographic preparation. Vilella’s reagent was used for etching by applying a 2 min swab. Micro-hardness indentations were conducted on polished specimens on a FutureTech FM-700 using a 5 g load and a 10 s dwell time. All presented hardness profiles were averaged over two separate profiles; bulk hardness values are averaged over 10 indents. All indents were spaced by at least 3x the indent diameter. Phase analysis was conducted on a Bruker D8 Discovery diffractometer equipped with Cr Kα radiation using a symmetric coupled θ–2θ focusing principle. Diffractograms were recorded with a 0.03 °2θ step size and a 6 s measurement time per step in the range 30‒160 °2θ. Light optical microscopy (LOM) was conducted on etched samples on a Zeiss Axio Vert.A1 inverted light microscope. Scanning electron microscopy (SEM) and energy dispersive spectroscopy (EDS) were conducted on a Zeiss Supra FEG-SEM equipped with a silicon drift EDS detector. Electron backscatter diffraction (EBSD) was coupled with EDS and measured on a Zeiss Sigma FEG-SEM.
The corrosion resistance was evaluated for the solution treated and aged condition as well as for chromized and post heat treated and decomposed specimens. Cyclic potentiodynamic polarization (CPP) testing was conducted in a 3.5 wt% naturally aerated solution of NaCl in demineralized water. The testing was conducted at room temperature using an ACM potentiostat. The area exposed to the solution was measured before each test. The open circuit potential (OCP) was measured for a duration of 600 s prior to polarization measurements. The CPP was measured using a cyclic sweep with a scan rate of 0.5 mV/s from –300 mV to 1200 mV with respect to the location of the OCP. The corroded surface was investigated using optical microscopy on a Keyence VHX-6000 digital microscope.
3 Results and Interpretations
3.1 X-ray diffraction
X-ray diffraction was applied to identify the phases formed during L-PBF of M300 and during post-build chromizing. Figure 1 shows that the as-built condition consists entirely of a bcc phase, i. e. the aforementioned bcc martensite. Solution treatment and ageing also produces a predominantly bcc microstructure with a small 111 peak of fcc austenite visible. This indicates that the ageingtreatment has led to the formation of reverted austenite due to the instability of bcc martensite, a known phenomenon for ageing of maraging steels [5, 6, 10, 22]. The bcc peaks of the as-built condition appear to occur at lower scattering angles than for the solution treated and aged condition, suggesting the presence of compressive residual stresses in the as-built condition. The intermetallic phases precipitating during ageing are not identified in the diffractogram for the solution treated and aged condition, because of their very fine size.

X-ray diffractograms for the as-built, solution treated and aged, as-chromized for Cr1 and Cr1 with post solution treatment and ageing
Bild 1. Röntgendiffraktogramme für den eingebauten, lösungsbehandelten und ausgelagerten Zustand, für Cr1 im chromierten Zustand und für Cr1 mit Lösungsnachbehandlung und Auslagerung
The diffractogram for the as-chromized condition appears to consist primarily of bcc phase and the intermetallic σ-phase. The bcc peaks are shifted to lower scattering angles indicating either a different composition or a different stress state. It is not possible to exclude the presence of austenite, because the three fcc peaks that would be observable with chromium radiation coincide with peaks of the σ-phase. Solution treatment and ageing appears to not affect the diffractogram of the chromized specimen. The chromizing appears to result in narrower α-peaks than the solution treated and aged condition.
3.2 Microstructure characterization
LOM reveals pronounced differences between the as-built and the solution treated and aged conditions, see Figure 2. The as-built condition presents clear characteristics of the L-PBF process.

LOM-Mikrofotografien von a) und b) im eingebauten Zustand und c) und d) im lösungsbehandelten und ausgelagerten Zustand. Aufbaurichtung von unten nach oben
Fig. 2. LOM micrographs of a) and b) as-built condition and c) and d) solution treated and aged condition. Build direction bottom to top
Elongated prior austenite grains reflect the direction of the largest heat flux and epitaxial nucleation on top of previously solidified material. At higher magnification, see Figure 2b, the cellular subgrain structure of the L-PBF material can be identified inside the martensite laths. Some degree of porosity is an inherent feature of materials produced by L- PBF.
These cellular structures can be observed in greater detail in the backscatter electron (BSE) images in Figure 3. The appearance of the cellular structure is different for different grains, because of their columnar nature. Consequently, depending on how they are sectioned, they can appear equi-axed, elliptical or as parallel lines. The microstructure of the solution treated and aged condition no longer shows remnants of the L-PBF origin. The microstructure consists entirely of lath martensite (Figures 2b and d), similar to conventionally manufactured M300. Porosities can be found in both the as-built and the solution treated and aged conditions (Figures 2a and c). Elongated porosities are oriented with their apex perpendicular to the build direction. These porosities are formed as a result of insufficient laser power, so-called lack-of-fusion porosities. Smaller and spherical porosities are formed as a result of entrapped gas from the L-PBF process.

SEM BSE micrographs of the as-built M300
Bild 3. SEM-BSE-Schliffbilder des M300 im eingebauten Zustand
The as-chromized microstructures are presented in Figure 4 for the different treatment conditions. The thickness of the σ-layer depends on treatment temperature and time. Cr1 and Cr2 differ in treatment time, while Cr2 and Cr3 only differ in temperature. The longer treatment time of Cr1 produced by far the thickest layer of σ-phase. A characteristic feature after chromizing of M300 maraging steel is the formation of cracks perpendicular to the surface in the σ-phase layer. The orientations of the cracks indicates that they originate from tensile stress; most likely these cracks initiate at the interface between the σ-phase and the bulk. The cracks are caused by the combination of a different thermal shrink for substrate and layer during cooling and, in particular, the volume expansion in the substrate associated with martensite formation. Interestingly, during the Cr1 treatment a layer has developed atop the σ-phase, wherein the cracks are halted. A bright layer is visible underneath the σ-phase, particularly for Cr2 (Figure 2d). The bulk of the material reflects the influence of the chromizing temperature. Cr3 is conducted at a lower temperature than Cr1/Cr2, and an elongated grain structure similar to the as-built condition is present (cf. dashed lines in Figures 2a and 4e).

LOM micrographs of the as-chromized condition. a) and b) Cr1, c) and d) Cr2, e) and f) Cr3. Build direction bottom to top
Bild 4. LOM-Schliffbilder des chromierten Zustands. a) und b) Cr1, c) und d) Cr2, e) und f) Cr3. Aufbaurichtung von unten nach oben
Specimens from the Cr2 and Cr3 treatments were aged directly after chromizing (see Figure 5). Slight differences are observed between the as-chromized and the chromized and aged conditions. Particularly at higher magnifications, it appears that the martensite laths are more well-defined than the as-chromized conditions, potentially due to precipitation of intermetallic phases at the lath interfaces or austenite reversion at this location. Furthermore, an irregular zone has developed underneath the σ-phase layer (see in particular Figure 5b); in this intermediate zone the cracks do not continue.

LOM micrographs of the chromized and aged condition. a) Cr2+A, b) Cr3+A. Build direction bottom to top
Bild 5. LOM-Aufnahmen des chromierten und ausgelagerten Zustands. a) Cr2+A, b) Cr3+A. Aufbaurichtung von unten nach oben
The changes in microstructure as a result of solution treatment and ageing after chromizing are given in Figure 6. No essential differences in the bulk microstructure are observed, because the solution treatment resets the microstructure to austenite and, again, martensite forms upon cooling. The solution treatment has led to the development of a pronounced white region in-between the σ-phase and martensite, which is interpreted as the result of interdiffusion between σ-phase and the bulk during the high temperature solution treatment. In Figure 6c, a large porosity is located near the surface, and it must have had a connection to the chromizing atmosphere, as the surface of this porosity is also chromized.

LOM micrographs of the chromized and solution treated and aged condition. a) Cr1+SA, b Cr2+SA, c) Cr3+SA. Build direction bottom to top
Bild 6. LOM-Schliffbilder des chromierten, lösungsbehandelten und ausgelagerten Zustands. a) Cr1+SA, b) Cr2+SA, c) Cr3+SA. Aufbaurichtung von unten nach oben
The surface region of the Cr1 condition after solution treatment and ageing is viewed in more detail using SEM in Figure 7. The layered nature of the surface region is visible. The location of the original surface is marked by a series of black pits with the σ-case growing slightly inward, but mostly outward from the original surface. Underneath the σ-case, an uneven region of a dark phase is found followed by a transition region and the bulk bcc martensite. The outermost layer differs from the σ-case and is mostly uniform across the surface. The vertical crack is seen to penetrate through the entire σ-case but appears to be constricted by the uniform dark layer underneath the σ-case and by the thin outermost layer.

SEM BSE micrograph of the Cr1+SA condition
Bild 7. SEM-BSE-Schliffbild des Cr1+SA-Zustands
3.3 Micro hardness profiles
Micro hardness profiles for the different chromizing and annealing conditions are provided in Figure 8. Comparing the as-chromized conditions, Cr1 leads to a higher surface hardness and a deeper hardened case. The bulk hardness for all treatments is similar, albeit slightly lower than the hardness of the as-built condition (indicated by the dashed line AB). The reduction in substrate hardness is explained from the disappearance of the fine cellular structure (see Figure 3) and its associated strengthening effect. For the Cr1 treatment, starting at a depth of 15 μm a zone of ~5 μm is observed where the hardness is below the bulk hardness.

Micro hardness comparison for the different chromizing treatments and post-annealing treatments. Dashed lines are drawn to guide the eye
Bild 8. Vergleich der Mikrohärte für die verschiedenen Chromierungsbehandlungen und Nachglühbehandlungen. Die gestrichelten Linien dienen als Orientierungshilfe für das Auge
Ageing Cr2 and Cr3 directly after chromizing hardens the bulk to the same level as the solution treated and aged condition (indicated by the dashed line SA). The surface hardness is comparable for the as-chromized and the chromized and aged conditions. The slight differences in maximum hardness for the Cr3 condition before and after ageing are not a result of microstructural differences but are ascribed to the very thin σ-phase layer that creates difficulties with accurate hardness indentation measurements on the cross-section. For both Cr2 and Cr3, the bulk is not evenly hardened by the ageing treatment. Both specimens have a thin zone, where the hardness is much lower than in the surface and bulk.
This zone corresponds to the irregularly shaped bright region in Figure 5b.
The micro hardness profiles after additional solution treatment and ageing after chromizing show a region, where the material is not hardened during ageing. This zone is widest for the Cr1 treatment, followed by Cr2 and Cr3. The region with low hardness corresponds to the nonuniform zone underneath the σ-case (Figure 7). The hardness in the soft region of Cr1+SA is even lower than the as-built condition and identical to the soft region of Cr1 in the as-chromized condition. Hardness values in the soft regions in Cr2+SA and Cr3+SA are slightly lower than for their directly aged conditions. This is attributed to growth of the zone underneath the σ-case by continued diffusion during the solution treatment, so the hardness indentations in these zones are less affected by the presence of neighboring phases with a higher hardness. It is concluded that the composition of this zone does not allow the precipitation of strengthening intermetallics utilized in M300 during ageing.
3.4 Composition and phase analysis
EBSD phase identification was conducted on the Cr1+SA specimen to be able to distinguish the different phases formed during the chromizing treatment and as a result of subsequent annealing treatments, see Figure 9. The σ-case was identified as a tetragonal FeCr compound belonging to space group P42/mnm. The grains of σ appear to be columnar, oriented perpendicularly to the surface of the material without a strong preference of crystallographic orientation. The fcc phase underneath the σ-case is not uniform but appears to be reliant on the diffusion of chromium along grain boundaries. The austenite grains are larger than the new grains formed in the σ-case. The bulk and the outermost layer are both identified as the same bcc phase, which likely is bcc α-Cr (with a certain amount of Fe) on the surface and bcc martensite in the bulk; no differences were found in the Kikuchi patterns of the two phases. This is supported by the compositional differences observed using EDS. Each martensite lath has a specific orientation but contains a distribution of low-angle grain boundaries contained by the high-angle lath grain boundaries.

EDS and EBSD maps of the Cr1+SA condition. Top, left: Phase map (green = bcc, yellow = σ, red = fcc). Bottom, left: Orientation map (Euler coloring). EDS maps of the main alloying elements
Bild 9. EDS- und EBSD-Karten des Cr1+SA-Zustands. Oben, links: Phasenkarte (grün = bcc, gelb = σ, rot = fcc). Unten, links: Orientierungskarte (Euler-Färbung). EDS-Karten der wichtigsten Legierungselemente
EDS mapping was conducted to obtain insight into the elemental distribution after chromizing, solution treatment and ageing. The EDS map of the hardened case of the Cr1+SA specimen is provided in Figure 9. Four distinct zones are observed, consistent with SEM and micro hardness profiles in Figures 6 and 8, respectively. The outermost layer is solely enriched in chromium and depleted in other alloying elements. The layer of σ-phase contains primarily Cr, Mo and Fe, with a distinct depletion of Ni and Co. Regions immediately adjacent to the σ-phase layer are depleted in Mo. The austenite zone has a lower chromium content and a depletion of other alloying elements to a lesser degree compared to the σ-case. Titanium appears to be concentrated along the original surface, i. e. separating the part of the σ-layer that has grown into the material and the part that has grown outwardly, as is consistent with the location of the pits in Figure 7. Furthermore, a clear concentration of titanium occurs along the grain boundaries in the austenite zone. Ti generally has a low solubility in austenite.
EDS composition profiles are compared in Figure 10 for the three different chromizing conditions after solution and ageing treatments. The α-Cr layer on top of the σ-phase of the Cr1+SA condition has a high Cr content, decreased Ni and no discernable amount of Mo or Co. For the Cr1+SA specimen, the chromium content decreases with depth in the σ-phase with discontinuities at the interfaces with the top layer and steel substrate. On the transition from σ-phase to steel, discontinuities occur in all composition profiles. Below the σ-phase, a zone occurs where the chromium content gradually decreases until another discontinuity in Cr content occurs, while the other elements do not show such a discontinuity. For the Cr2+SA condition, the elemental distributions differ from the Cr1+SA condition. The iron and chromium contents are constant over the thickness of the σ-phase and the chromium-enriched region below the σ-phase is less pronounced. Furthermore, the chromium content at the surface is lower than the Cr1+SA condition and no top layer with a chromium content above 50 % is present. This is consistent with observations from microscopy, (Figures 4 and 7), where the top layer halts the cracks in the σ-phase for the Cr1 chromizing treatment. The Cr3+SA specimen has a compositional profile similar to that of the Cr2+SA, but shallower. Besides a shallower hardened case, the Cr3+SA condition has a lower chromium content in the σ-phase layer. For all chromizing treatments, there is a distinct depletion of molybdenum at the interface between the hardened case and the bulk as Mo is drawn into the σ-phase.

EDS-Zusammensetzungsprofile für die verschiedenen Chromierungsbedingungen, gefolgt von Lösungsbehandlung und Auslagerung. Die gestrichelten Linien markieren den Übergang zwischen benachbarten Phasenbereichen
Fig. 10. EDS composition profiles for the different chromizing conditions followed by solution treatment and ageing. Dashed lines mark the transition between adjacent phase regions

Röntgendiffraktogramme für die verschiedenen Zustände: wie eingebaut, lösungsbehandelt und ausgelagert sowie Cr2 und Cr3 zersetzt
Fig. 11. X-ray diffractograms for the different conditions: as-built, solution treated and aged and Cr2 and Cr3 decomposed

LOM-Schliffbilder des zersetzten Zustands der chromierten Proben. a) Cr2, zersetzt, b) Cr3, zersetzt
Fig. 12. LOM micrographs of the decomposed state of the chromized specimens. a) Cr2, decomposed, b) Cr3, decomposed
Micro hardness comparison of the decomposed condition of Cr2 and Cr3. Dashed lines are drawn to guide the eye
Bild 13. Vergleich der Mikrohärte des zersetzten Zustands von Cr2 und Cr3. Die gestrichelten Linien dienen als Orientierungshilfe für das Auge

EDS composition profiles for the chromized and decomposed conditions
Bild 14. EDS-Zusammensetzungsprofile für den chromierten und den zersetzten Zustand
3.5 Decomposition of σ-phase
The σ-phase is generally considered rather brittle, so for applications where corrosion resistance is the primary concern, the σ-phase can be decomposed, and Cr diffused into the material. The decomposition of the σ-phase was investigated by annealing the specimens at 1080 °C for 1 h, i. e. beyond the stability range for σ-phase. X-ray diffractograms for the decomposed σ-phase of the Cr2 and Cr3 chromizing treatments in Figure 11 show austenite formed on the martensite substrate. The Cr3 treatment was conducted at a lower temperature than Cr2, resulting in a thinner σ-case, see Figures 4 and 8. The thicker case for Cr2 did not entirely dissolve and some σ-phase was retained. The thickness of the austenite case prevented detection of the martensite in the bulk.
The decomposed microstructure for Cr2 and Cr3 can be found in Figure 12. As observed using XRD (Figure 11), the σ-layer resulting from the Cr2 treatment does not fully decompose and a thin outer layer of retained σ is seen. This is likely due to dissolution of the σ-case occurring from the interface by diffusion of Cr further into the bulk, leaving a sufficiently high Cr content to retain a thin layer of σ-phase at the surface. The Cr3 σ-layer is fully transformed into austenite after the decomposition heat treatment. Interestingly, the decomposition treatment appears to close the cracks over the σ-layer, see Figures 4–7. The diffusion zone tends to propagate preferentially at certain locations. The bulk microstructure is identical to the solution treated and aged conditions seen in Figure 6. The micro hardness profiles in Figure 13 are consistent with partial decomposition of the σ-layer on the Cr2 specimen, because a slightly higher surface hardness with a large standard deviation is observed. This reflects a very thin layer of retained σ-phase. The hardness of the decomposed Cr3 specimen is consistent with austenitic stainless steel. The bulk hardness is identical to that for the solution treated and aged condition, because the decomposition was followed by aging (see Experimental).
Composition profiles for the Cr2 after the decomposition heat treatment confirm the presence of remnants of the σ-phase, while it is absent for Cr3+D (Figure 14). The thickness of the σ-phase is shallower than in the solution treated and aged condition (Figure 10). The Cr3 chromizing treatment after decomposition has a composition similar to that of austenitic stainless steel near the surface i. e. a chromium content of ~15 wt%. Evidently, titanium has accumulated at a depth of about 5 μm (location of the original surface), identical to the Cr2+SA and Cr3+SA locations (see Figure 10). The composition of the bulk is unaffected by the decomposition anneal.
3.6 Potentiostatic measurements
The polarization curves resulting from the potentiostatic measurements conducted on the SA condition as well as chromized and post-annealed conditions for Cr2 and Cr3 are provided in Figure 15. Calculated corrosion rates are listed in Table 4. The SA condition was chosen as a reference, because the material will usually be applied in this condition to ensure adequate mechanical properties. The SA condition shows poor corrosion resistance, as reflected by the strongly negative corrosion potential and the high corrosion current density. Two repetitions were conducted for the Cr2+A and Cr3+A conditions. The post-aged condition was chosen, because the material will not be applied in the as-chromized condition due to insufficient hardness (see Figure 8). The Cr2+A condition appears to be more corrosion resistant than the Cr3+A condition. The corrosion potential is slightly improved, but there is a significant reduction in corrosion current density and, hence, the corrosion rate. The anodic part of the polarization curve is shifted to lower current densities. The Cr3+A condition has an improved corrosion potential, as compared to SA, and a general shift of the polarization curve to a lower current density level. A higher corrosion rate was calculated for Cr3+A than for Cr2+A.

Polarization curves for the Cr2 and Cr3 chromizing treatments with different post-annealing treatments
Bild 15. Polarisationskurven für die Chromierungsbehandlungen Cr2 und Cr3 mit verschiedenen Nachglühbehandlungen
Berechnete Korrosionsraten basierend auf potentiostatischen Messungen
Table 4. Calculated corrosion rates based on potentiostatic measurements
| SA | Cr2+A | Cr3+A | Cr2+SA | Cr3+SA | Cr2+D | Cr3+D | |
|---|---|---|---|---|---|---|---|
| Corrosion rate [μm/year] | 645 ± 82 | 120 ± 19 | 211 ± 65 | 46 | 248 | 27 | 389 |
Solution treatment and ageing after chromizing does not have much impact on the corrosion potential for Cr2 and Cr3. For Cr3, the anodic part of the curve is shifted to lower current densities, while for Cr2 it is consistent with the Cr2+A condition. The Cr3+A and Cr3+SA have similar corrosion rates. However, the Cr2+SA shows distinct improvements in the corrosion rate of the material over its directly aged counterpart. The decomposed condition for Cr2 exhibits the highest corrosion potential for all specimens treated with the same chromizing treatment.
The surfaces of the investigated specimens are given in Figure 16. The SA specimen is heavily corroded, and the surface is fully cracked and spalls off. The chromizing treatments importantly change the appearance after the polarization tests. The Cr2+A treatment experiences some pitting, which is improved with solution treating before ageing and further improved by decomposing the σ-case. On the Cr2+SA and Cr2+D specimens very few pits are detected, but, judging the orange/brown areas on the surfaces, some iron hydroxide has formed. The pitting on Cr3 is more severe as reflected by the polarization curves in Figure 15 and corrosion rates in Table IV. It can also be seen that as observed, the decomposition of Cr3 does not provide a significant improvement of the corrosion response. The pitting of the Cr3+SA specimen appears slightly improved.

Corroded surfaces of M300. a) solution treated and aged, b) and c) post-aged, d) and e) post-solution treated and aged, f) and g) decomposed. a) no chromizing, b), d) and f) Cr2, c), e) and g) Cr3
Bild 16. Korrodierte Oberflächen von M300. a) lösungsbehandelt und ausgelagert, b) und c) nachgelagert, d) und e) nachlösungsbehandelt und ausgelagert, f) und g) zersetzt. a) keine Chromierung, b), d) und f) Cr2, c), e) und g) Cr3
4 Discussion
4.1 Effect of chromizing on microstructure
Chromizing by thermoreactive deposition and diffusion (TRD) is demonstrated to be a feasible surface engineering treatment of additively manufactured M300 (Figure 4). Not surprisingly, the response of the material to the chromizing treatment depends on treatment temperature and time, as reflected by the thickness of the hard σ-layer for Cr1–Cr3. Both a lower treatment temperature and a shorter treatment time led to a thinner σ-layer.
LOM (Figures 4–6) and SEM (Figure 7) revealed a distinct zone underneath the σ-layer with an uneven interface to the underlying martensite. This zone coincides with a region of lower hardness between the very hard σ-phase and the bulk, see Figure 8. The thickness of this zone decreases with process temperature and time. The apparent higher hardness of this zone for Cr3, is ascribed to the limited thickness and the contributions from neighboring (harder) phases during hardness indentations. In order to understand the nature and origin of this phase, the equilibrium volume fractions of the most relevant phases were calculated for the composition in each layer observed in Cr1+SA (Figure 10): αCr(Fe), σ-phase, austenite and martensite, see Figure 17.

Gleichgewichtsanteil der Phasen auf der Grundlage der gemessenen Zusammensetzung an verschiedenen Stellen im Zustand Cr1+SA in Abhängigkeit vom Abstand zur Oberfläche: α-Cr(Fe), σ, fcc (Austenit), bcc (Ferrit oder Martensit)
Fig. 17. Equilibrium fractions of phases based on measured composition at different locations in the Cr1+SA condition as a function of distance to the surface: α-Cr(Fe), σ, fcc (austenite), bcc (ferrite or martensite)
In the outer α-Cr(Fe) layer, the bcc phase is stable throughout the entire temperature range with little to no stability of fcc. The composition of the σ-region allows the bcc phase to be stable at high temperatures, transforming into σ at lower temperatures. In the austenite region, mainly austenite is stable with some stability of σ and bcc at low temperatures. This is a common observation for equilibrium calculations on austenitic stainless steels. In the bulk martensite region, there is an increased stability of bcc (compared to the austenite region) and no stability of σ as this phase requires the inclusion of Cr. The stabilization of austenite over bcc martensite is unexpected because chromium is a well-known ferrite stabilizer in iron-based alloys [23]. The combination of chromium with the austenite stabilizers nickel and cobalt in M300 suppresses the formation of martensite. This is consistent with empirical relations between the martensite start temperature (MS) and the steel composition, which show that both Ni and Cr reduce MS, while Co raises MS [24]. Then, for a high Cr content MS is lower than for a steel with a low (or no) Cr content. This improved austenite stability is reflected by the observed, soft austenite phase underneath the σ-case. This interpretation is consistent with the hardness in this zone as well as an appearance similar to austenite observed after decomposition of the σ-phase (cf. Figures 6 and 12)
Originally, tensile cracks were observed in the σ-case (Figures 4 and 6) for Cr1 and therefore the chromizing treatment was adjusted in order to understand the origin of these cracks and how to limit or eliminate them. However, for the gentler process parameters in Cr2 and Cr3, cracks in the σ-layer persisted. This suggests that the cracks are not related to the chromizing process itself but originate from cooling after chromizing. At the chromizing temperatures, the M300 alloy is austenitic. On cooling, stresses arise in the steel and the σ-phase, firstly as a consequence of the transformation of the outer case to σ-phase and different thermal expansion coefficients for austenite and σ-phase. Most likely austenite shrinks more than σ-phase, resulting in compressive stresses in σ-phase, compensated by small tensile stresses in the relatively thick steel substrate. The transformation of austenite into martensite is accompanied by a volume expansion in the steel and thereby superimposes tensile stress onto the σ-phase. The (sudden) transformation stresses are held responsible for the observed cracks in the brittle σ-phase.
4.2 Effect of post-annealing on chromized microstructure
The different types of heat treatment, i. e. ageing, solution treatment and ageing and σ-decomposition, have a similar effect on the chromized microstructures, regardless of the applied chromizing parameters. The ageing treatment has very little effect on the chromized case (σ-layer and austenite zone), while the bulk material is hardened to the same level as the SA condition. Solution treatment after chromizing diffuses the chromium deeper into the material, thereby widening particularly the soft austenite region, Figure 8. Interestingly, the austenite region appears unable to be hardened by the ageing treatment, neither directly after chromizing nor after a post-chromizing solution treatment. The main hardening precipitate in the M300 alloy is the intermetallic Ni3Ti and the ability to harden in the austenite zone is likely limited by the formation of this precipitate. As seen from EDS (see Figures 9 and 10) Ti tends to accumulate near the austenite/σ-phase interface and along grain boundaries in the austenite region. Likely, the high reactivity of Ti pulls the atoms to the original surface already during heating as the accumulation occurs at the original surface rather than the surface of the σ-layer. Possibly, Ti forms compounds with the volatile atmosphere (Cl or O). The accumulation of titanium may explain why the austenite phase is not hardened during ageing, because titanium is not available to form the important Ni3Ti intermetallic. As the overall titanium bulk content is only on average of 0.65 wt%, depletion of titanium in the austenite zone is difficult to visualize as the EDS counts are much lower than for the other alloying elements, however very little Ti was observed in the α-Cr(Fe) and σ-layers, with also a low Ti content in the austenite region. When comparing the equilibrium fractions of Ni3Ti in the different regions (Figure 17, bottom right), only in the bulk a significant amount of the intermetallic can be formed. There is some stability in the austenite composition region, but likely most of the Ti measured in this region is bound along grain boundaries and the original surface. Furthermore, the Ni3Ti precipitates form a stable, coherent interface with the bcc matrix, which may not be possible in the austenite region due to differences in crystal structure [25].
The soft austenite zone could limit the applicability of chromized M300 in mechanically loaded applications, as the so-called eggshell effect needs to be considered. However, this may be less detrimental than in conventional cases of a hard surface on a softer substrate as the austenite zone is rather thin and the bulk martensite will likely be the determining phase for the strength of the material. Furthermore, the presence of the ductile austenite may act as a buffer, which can accommodate plastic deformation. On the other side, the more ductile phase may be advantageous in applications where subsurface ductility is important, for example in contact fatigue applications combined with surface wear. A layer of austenite on the surface may also be beneficial as a barrier for hydrogen diffusion due to the low diffusion rate of hydrogen in austenite and its hydrogen trapping ability [26, 27]. This could potentially be interesting as a material for Power-To-X applications.
The σ-phase is decomposed to further improve the corrosion resistance of the chromized M300. The decomposition is conducted at high temperature and relies on the continued diffusion of chromium into the bulk to a level, where the Cr content at the surface is insufficient to retain σ-phase. At the applied decomposition temperature of 1080 °C, a chromium content lower than ~20 wt% destabilizes the σ-phase. This is illustrated by comparing the composition profiles of Cr2+D and Cr3+D in Figure 14. The decomposition of σ-phase is incomplete for Cr2 (see also X-ray diffractograms in Figure 11) where the surface chromium content is measured to ~30 wt%. Dissolution of σ-phase does occur for Cr3, where the surface chromium content after the vacuum treatment is ~15 wt%.
Another important effect of the (partial) dissolution of σ-phase is the disappearance of the aforementioned cracks in the σ-phase. This is explained as follows. At the “decomposition” temperature the cracks are closed by the thermal expansion of the layer and substrate, so diffusion bonding can heal the cracks. The dissolution of σ-phase by inward chromium diffusion forms a stable austenite region as a buffer between the σ-layer and the bulk. Then, during the martensitic transformation of austenite in the steel, the associated volume expansion can be accommodated plastically in austenite and does not lead to cracks, neither in austenite, nor in retained σ-phase.
4.3 Effect of chromizing and annealing on corrosion resistance
The M300 maraging alloy in the solution treated and aged condition has very poor corrosion performance as evidenced by the potentiostatic measurements (Figures 15 and 16 and Table 4). Therefore, it becomes relevant to investigate the corrosive protection obtainable by the chromizing treatment, so the excellent mechanical properties of the maraging alloy can be utilized under conditions, where poor corrosion resistance would be prohibitive.
Comparing the corrosion performances of the Cr2+A and Cr3+A conditions, the effect of the thicker diffusion zone and σ-layer of Cr2 due to the higher treatment temperature, becomes evident. While Cr2+A improves the corrosion rate more than 4 times, Cr3+A improves it by a factor of 2. Applying a solution treatment to the Cr2 chromized specimens before ageing, the corrosion performance is significantly improved again with a 12 times reduction in corrosion rate as compared to the solution treated and aged condition. This is attributed to the deeper austenite zone underneath the σ-layer. Even though the decomposition of the σ-phase was only partly completed, the corrosion rate is still reduced 20 times as compared to the solution treated and aged condition. This is partly due to the aforementioned diffusion of chromium into the bulk, which is more significant after the decomposition treatment than after the solution treatment. Moreover, the absence of cracks will have a beneficial effect on the corrosion protection of the chromized case.
The strongest difference between the two chromizing conditions is the response to subsequent high temperature treatments. While the corrosion resistance of the Cr2 chromizing treatment is significantly improved by both solution treatment and further by σ-phase decomposition, the high temperature has only a limited effect on the Cr3 condition. This is thought to be a result of the relatively thin chromized case. During the high temperature treatment chromium diffuses deeper into the steel. The thin initial case depth has led to a reduction in Cr content at the surface to 15 wt%, which appears insufficient to maintain the reduction in corrosion rate achieved in the Cr3+SA condition. A shorter decomposition time may remedy this poorer corrosion performance.
Even though cracks were present in the Cr2+SA condition, they did not negatively affect the corrosion resistance. This is explained by the underlying austenite layer with a high chromium content, which stops the cracks from reaching the corrosion susceptible martensite underneath. While the corrosion rate of the Cr1 chromizing treatment was not investigated in this study, it is expected to perform significantly better than Cr2 because of the thicker σ-case and stabilized austenite zone. Furthermore, the Cr1 condition has a thin α-Cr(Fe) layer atop the σ-phase, preventing the cracks from reaching the surface. Decomposition of the σ-layer appears to provide the best corrosion resistance, so it becomes relevant to tailor the post-treatment to the requirements of a particular application. In some cases, it might be more desirable to apply a compromise using solution treatment and ageing as a post-chromizing annealing treatment, while still maintaining the high surface hardness of the σ-phase. Therefore, the combination of mechanical, tribological and corrosion properties will have to be prioritized for a specific application. As the L-PBF microstructure is reset by the chromizing treatment, these observations could potentially also be applied to conventionally manufactured M300 components.
5 Conclusions
This study has compared three different chromizing conditions and their impact on the microstructure and corrosion resistance of additively manufactured maraging steel. Different post-processing heat treatments have been applied to tailor the microstructure, phase distribution, mechanical properties and corrosion resistance of the surfaces and the following conclusions can be drawn:
Chromizing of maraging steel leads to the formation of a very hard case of σ-phase grown outwards from the original surface. This σ-case is supported by a case of stabilized austenite, which has a similar composition to austenitic stainless steel. This is due to the Cr acting to lower the MS temperature, thereby stabilizing γ to lower temperatures.
The thickness and composition of the σ-case and austenite case depend on both chromizing temperature and time. A sufficiently high chromium content in the surface caused the formation of a thin, uniform layer of α-Cr(Fe) atop the σ-case.
Decomposition of the σ-phase occurs through diffusion of chromium into the bulk and lowering of the surface Cr content below the stability range of σ. When the decomposition is incomplete, a thin layer of σ remains at the outer surface, which shows that decomposition initiates at the interface between σ and the bulk. The decomposition of σ formed a uniform case of austenite on the martensite substrate.
Cracks form in the σ-layer perpendicular to the surface due to differences in thermal expansion of the different phases and the martensitic transformation of the bulk into bcc martensite. These cracks are closed by the decomposition of σ, likely through inter-diffusion of chromium.
The chromizing treatments significantly reduced the corrosion rate of the maraging steel with a higher chromium content and a thicker case that improves the corrosion resistance more efficiently. The corrosion resistance could be further improved by a solution heat treatment or ideally the decomposition of σ into γ.
Acknowledgements
This work was conducted under the Innovation Fund Denmark project, AM-LINE 4.0 [grant number 7076-00074B]. The authors would like to thank TRD Surfaces ApS (Holte, Denmark) for performing the chromizing treatments. Thomas Dahmen is kindly acknowledged for facilitating collaborations and providing asbuilt material.
Danksagung
Diese Arbeit wurde im Rahmen des Projekts AM-LINE 4.0 des Innovationsfonds Dänemark [Förderungsnummer 7076-00074B] durchgeführt. Die Autoren bedanken sich bei TRD Surfaces ApS (Holte, Dänemark) für die Durchführung der Chromierungsbehandlungen. Wir danken Thomas Dahmen für die Erleichterung der Zusammenarbeit und die Bereitstellung von Metallbauteilen.
References
1 DebRoy, T; Wei, H. L.; Zuback, J. S.; Mukherjee, T.; Elmer, J. W.; Milewski, J. O.; Beese, A. M.; Wilson-Heid, A.; De, A.; Zhang, W: Additive manufacturing of metallic components – Process, structure and properties. Prog. Mater. Sci. 92 (2018), pp. 112–224, DOI:10.1016/j.pmatsci.2017.10.00110.1016/j.pmatsci.2017.10.001Search in Google Scholar
2 Herzog, D.; Seyda, V.; Wycisk, E.; Emmelmann, C.: Additive manufacturing of metals. Acta Mater. 117 (2016), pp. 371–392, DOI:10.1016/j.actamat.2016.07.01910.1016/j.actamat.2016.07.019Search in Google Scholar
3 Bajaj, P.; Hariharan, A.; Kini, A.; Kürnsteiner, P.; Raabe, D.; Jägle, E. A.: Steels in additive manufacturing: A review of their microstructure and properties. Mater. Sci. Eng. A 772 (2020), p. 138633, DOI:10.1016/j.msea.2019.13863310.1016/j.msea.2019.138633Search in Google Scholar
4 Pinkerton, A. J.; Li, L.: Direct additive laser manufacturing using gas- and wateratomised H13 tool steel powders. Int. J. Adv. Manuf. Technol. 25 (2005) 5-6, pp. 471–479, DOI:10.1007/s00170-003-1844-210.1007/s00170-003-1844-2Search in Google Scholar
5 Campanelli, S. L.; Contuzzi, N.; Posa, P.; Angelastro, A.: Study of the aging treatment on selective laser melted maraging 300 steel. Materials Res. Express 6 (2019), p. 066580, DOI:10.1088/2053-1591/ab0c6e10.1088/2053-1591/ab0c6eSearch in Google Scholar
6 Kürnsteiner, P.; Wilms, M. B.; Weisheit, A.; Barriobero-Vila, P.; Jägle, E. A.; Raabe, D.: Massive nanoprecipitation in an Fe-19Ni-xAl maraging steel triggered by the intrinsic heat treatment during laser metal deposition. Acta Mater. 129 (2017), pp. 52–60, DOI:10.1016/j.actamat.2017.02.06910.1016/j.actamat.2017.02.069Search in Google Scholar
7 Turk, C.; Zunko, H.; Aumayr, C.; Leitner, H.; Kapp, M.: Advances in maraging steels for additive manufacturing. BHM Berg- Und Hüttenmännische Monatshefte 164 (2019), pp. 112–116, DOI:10.1007/s00501-019-0835-z10.1007/s00501-019-0835-zSearch in Google Scholar
8 Kempen, K.; Yasa, E.; Thijs, L.; Kruth, J. P.; Van Humbeeck, J.: Microstructure and mechanical properties of selective laser melted 18Ni-300 steel. Phys. Procedia 12 (2011), pp. 255–263, DOI:10.1016/j.phpro.2011.03.03310.1016/j.phpro.2011.03.033Search in Google Scholar
9 Bai, Y.; Wang, D.; Yang, Y.; Wang, H.: Effect of heat treatment on the microstructure and mechanical properties of maraging steel by selective laser melting. Mater. Sci. Eng. A 760 (2019), pp. 105–117, DOI:10.1016/j.msea.2019.05.11510.1016/j.msea.2019.05.115Search in Google Scholar
10 Tan, C.; Zhou, K.; Kuang, M.; Ma, W.; Kuang, T.: Microstructural characterization and properties of selective laser melted maraging steel with different build directions. Sci. Technol. Adv. Mater. 19 (2018), pp. 746–758, DOI:10.1080/14686996.2018.152764510.1080/14686996.2018.1527645Search in Google Scholar
11 Kim, D.; Kim, T.; Ha, K.; Oak, J. J.; Jeon, J. B.; Park, Y.; Lee, W.: Effect of heat treatment condition on microstructural and mechanical anisotropies of selective laser melted maraging 18Ni-300 steel. Metals 10 (2020) 3, p. 410, DOI:10.3390/met1003041010.3390/met10030410Search in Google Scholar
12 Anoop, S.; Venugopal, A.; Dineshraj, S.; Murty, S. V. S. N.; Pant, B.: Stress corrosion cracking behavior of selective laser-melted M300 maraging steel in 3.5 wt.% NaCl solution. J. Mater. Eng. Perform. 30 (2021), pp. 6568–6578, DOI:10.1007/s11665-021-05913-y10.1007/s11665-021-05913-ySearch in Google Scholar
13 Li, R.; Kim, Y. S.; Van Tho, H.; Yum, Y. J.; Kim, W. J.; Yang, S. Y.: Additive manufacturing (AM) of piercing punches by the PBF method of metal 3D printing using mold steel powder materials. J. Mech. Sci. Technol. 33 (2019), pp. 809–817, DOI:10.1007/s12206-019-0137-010.1007/s12206-019-0137-0Search in Google Scholar
14 Becker, T. H.; Dimitrov, D.: The achievable mechanical properties of SLM produced maraging steel 300 components. Rapid Prototyp. J. 22 (2016), pp. 487–494, DOI:10.1108/RPJ-08-2014-009610.1108/RPJ-08-2014-0096Search in Google Scholar
15 Mooney, B.; Kourousis, K. I.; Raghavendra, R.: Plastic anisotropy of additively manufactured maraging steel: Influence of the build orientation and heat treatments. Addit. Manuf. 25 (2019), pp. 19–31, DOI:10.1016/j.addma.2018.10.03210.1016/j.addma.2018.10.032Search in Google Scholar
16 Yin, S.; Chen, C.; Yan, X.; Feng, X.; Jenkins, R.; O’Reilly, P.; Liu, M.; Li, H.; Lupoi, R.: The influence of aging temperature and aging time on the mechanical and tribological properties of selective laser melted maraging 18Ni-300 steel. Addit. Manuf. 22 (2018), pp. 592–600. DOI:10.1016/j.addma.2018.06.00510.1016/j.addma.2018.06.005Search in Google Scholar
17 Jarfors, A. E. W.; Matsushita, T.; Siafakas, D.; Stolt, R.: On the nature of the anisotropy of maraging steel (1.2709) in additive manufacturing through powder bed laser-based fusion processing. Mater. Des. 204 (2021), p. 109608, DOI:10.1016/j.matdes.2021.10960810.1016/j.matdes.2021.109608Search in Google Scholar
18 Mutua, J.; Nakata, S.; Onda, T.; Chen, Z. C.: Optimization of selective laser melting parameters and influence of post heat treatment on microstructure and mechanical properties of maraging steel. Mater. Des. 139 (2018), pp. 486–497, DOI:10.1016/j.matdes.2017.11.04210.1016/j.matdes.2017.11.042Search in Google Scholar
19 Suryawanshi, J.; Baskaran, T.; Prakash, O.; Arya, S. B.; Ramamurty, U.: On the corrosion resistance of some selective laser melted alloys. Materialia. 3 (2018), pp. 153–161, DOI:10.1016/j.mtla.2018.08.02210.1016/j.mtla.2018.08.022Search in Google Scholar
20 Özer, G.; Karaaslan, A.: A study on the effects of different heat-treatment parameters on microstructure–mechanical properties and corrosion behavior of maraging steel produced by direct metal laser sintering. Steel Res. Int. 91 (2020), pp. 1–8, DOI:10.1002/srin.20200019510.1002/srin.202000195Search in Google Scholar
21 Khan, H. M.; Özer, G.; Tarakci, G.; Coskun, M.; Koc, E.; Kaynak, Y.: The impact of aging and drag-finishing on the surface integrity and corrosion behavior of the selective laser melted maraging steel samples. Materwiss. Werksttech. 52 (2021), pp. 60–73, DOI:10.1002/mawe.20200013910.1002/mawe.202000139Search in Google Scholar
22 Jägle, E. A.; Choi, P. P.; Van Humbeeck, J.; Raabe, D.: Precipitation and austenite reversion behavior of a maraging steel produced by selective laser melting. J. Mater. Res. 29 (2014), pp. 2072–2079, DOI:10.1557/jmr.2014.20410.1557/jmr.2014.204Search in Google Scholar
23 McGuire, M. F.: Austenitic stainless steels. Encyclopedia of Materials: Science and Technology, K. H. J. Buschow, R. W. Cahn, M. C. Flemings, E. K. Kramer, B. Ilschner, S. Mahajan, P. Veyssière, (Eds), Pergamon, Oxford, UK, 2011, pp. 406–411. – ISBN: 978-0-08-043152-9Search in Google Scholar
24 Lee, S.-J.; Jung, M.: Prediction of martensite start temperatures of highly alloyed steels. Arch. Metall. Mater. 66 (2021), pp. 107–111, DOI:10.24425/amm.2021.13476510.24425/amm.2021.134765Search in Google Scholar
25 Dehgahi, S.; Sanjari, M.; Ghoncheh, M. H.; Amirkhiz, B. S.; Mohammadi, M.: Concurrent improvement of strength and ductility in heat-treated C300 maraging steels produced by laser powder bed fusion technique. Addit. Manuf. 39 (2021), p. 101847, DOI:10.1016/j.addma.2021.10184710.1016/j.addma.2021.101847Search in Google Scholar
26 Park, Y. D.; Maroef, I. S.; Landau, A.; Olson, D. L.: Retained austenite as a hydrogen trap in steel welds. Weld. J. 81 (2002), pp. 27–35, open accessSearch in Google Scholar
27 Mine, Y.; Kimoto, T.: Hydrogen uptake in austenitic stainless steels by exposure to gaseous hydrogen and its effect on tensile deformation. Corros. Sci. 53 (2011), pp. 2619–2629, DOI:10.1016/j.corsci.2011.04.02210.1016/j.corsci.2011.04.022Search in Google Scholar
© 2022 C. V. Funch, K. V. Dahl, T. L. Christiansen, M. A. J. Somers, publiziert von De Gruyter
Articles in the same Issue
- Contents / Inhalt
- Chromizing of Additively Manufactured Maraging Steel; Microstructural Evolution and Corrosion Performance
- Supersolidus Liquid Phase Sintering and Heat Treatment on Atomic Diffusion Additive Manufacturing Produced Ledeburitic Cold Work Tool Steel*
- Influence of Different Pre-Heat Treatments on the Grain Size in the Core Region of Ultra-Clean Gear Steels
- Plasma Nitriding of an Air-Hardening Medium Manganese Forging Steel
- Impressum / Imprint
- Imprint / Impressum
- Norms / Normen
- From and for Practice / Praxis-Informationen
- AWT-Info / HTM 04-2022
- HTM Praxis