Super-resolution microscopy and studies of peroxisomes
-
Silvia Galiani

 and
Katharina Reglinski
and
Katharina Reglinski

Abstract
Fluorescence microscopy is an important tool for studying cellular structures such as organelles. Unfortunately, many details in the corresponding images are hidden due to the resolution limit of conventional lens-based far-field microscopy. An example is the study of peroxisomes, where important processes such as molecular organization during protein important can simply not be studied with conventional far-field microscopy methods. A remedy is super-resolution fluorescence microscopy, which is nowadays a well-established technique for the investigation of inner-cellular structures but has so far to a lesser extent been applied to the study of peroxisomes. To help advancing the latter, we here give an overview over the different super-resolution microscopy approaches and their potentials and challenges in cell-biological research, including labelling issues and a focus on studies on peroxisomes. Here, we also highlight experiments beyond simple imaging such as observations of diffusion dynamics of peroxisomal proteins.
Introduction
Life science studies to a great extent rely on observations using fluorescence microscopy. Its great potential is basis of several factors, including the possibility to fluorescently mark and map specific molecules and to conduct experiments on living cells. In addition, fluorescence entails a multitude of spectroscopic read-out parameters such as fluorescence lifetime, anisotropy or temporal fluctuations. Those parameters allow to explore not only spatial positions of tagged molecules but also properties of their immediate environment like pH or polarity and their temporal dynamics following diffusion and interactions. Fluorescence microscopy is usually realized using lenses, i.e. it is based on focusing of light and recording in the far-field away from any optical elements. This realizes least invasive observations, also inside living cells, tissue and organisms and in three dimensions. However, the disadvantage of using lenses is that light is diffracted at the lens aperture, resulting in extended focal spots and thus a limited spatial resolution – the diffraction limit – which for visible light is about 200 nm and 650 nm in lateral and axial directions, respectively. Consequently, similarly tagged objects closer together than these distances cannot be straightforwardly separated and thus appear as one in the final data, resulting in blurred images. A remedy is super-resolution fluorescence microscopy (SRM), which has been pushed over the past 20–30 years and has shown to be extremely valuable for live-science investigations of sub-cellular structures, as recognized by the Nobel Prize in Chemistry 2014 (Betzig et al. 2014). As several times reviewed before (for example in Eggeling et al. 2015; Hell 2003; Hell et al. 2015; Sahl et al. 2017; Schermelleh et al. 2019), various SRM approaches have evolved such as Stimulated Depletion (STED) microscopy, and (fluorescence) PhotoactivAtable Light Microscopy ([f]PALM) or (direct) STOchastic Reconstruction Microscopy ((d)STORM), both often summarized under the name Single-Molecule Localization Microscopy (SMLM), as well as Structured Illumination Microscopy (SIM) and recent MINFLUX microscopy. With all these techniques one can now more distinctively study molecular organization and structures at scales below the diffraction limit, yet with different options and possibilities. On the other side, reaching scales below 20–50 nm, SRM-based observations might increasingly be biased by the size of the fluorescent tag, which can – when using primary and secondary antibodies for immunolabeling or fluorescent proteins for live-cell studies – easily reach similar sizes and thus falsify determination of molecular positions. One aim of this review is thus to give a basic introduction of the different SRM techniques, with their work principles advantages and challenges for cell-biological work, as well as to detail problematics of labelling in SRM and summarize some proposed alternative tagging approaches.
Another aim of this review is to highlight the potentials of using SRM to study peroxisomes. These vesicular organelles are of size at or below the diffraction limit (Figure 1), and thus details and organization of specific molecules at the peroxisomes favour the use of SRM techniques. In more detail, peroxisomes are ubiquitous organelles in eukaryotic cells fulfilling many metabolic functions. In human cells, peroxisomes are involved in the β-oxidation of fatty acids, reactive oxygen species detoxification, and biosynthesis of different lipids, including plasmalogen, the main component of the myelin sheath (Braverman and Moser 2012). Because of its crucial roles in human metabolism, defects in peroxisomal function can cause many severe diseases (Nagotu et al. 2012). Only a fundamental understanding of peroxisomal biogenesis and assembly will help identify ways to control these diseases, leading to novel therapeutic strategies. Most importantly, the functions of peroxisomes are cell-type specific and variable as a response to environmental changes (Islinger et al. 2012; Kunau 2006; Smith and Aitchison 2013). Consequently, the pool of peroxisomal matrix proteins needs to be continuously adapted, entailing the necessity of a highly dynamic import system. Here, peroxisomal matrix proteins are synthesized on free ribosomes in the cytosol and transported into the organelle post-translationally via cytosolic transport proteins such as PEX5 or PEX7 and translocated across the peroxisomal membrane and into the matrix via a pore (the peroxisomal translocon), which mainly consists of the peroxisomal proteins PEX14 and PEX5 (Meinecke et al. 2010) (Figure 1). Unfortunately, many of these important details of the organization of the peroxisomal translocon are not yet known due to missing spatial resolution in standard optical microscopy techniques, and the study of these structures requires SRM with large spectroscopic information content, as summarized in this review.
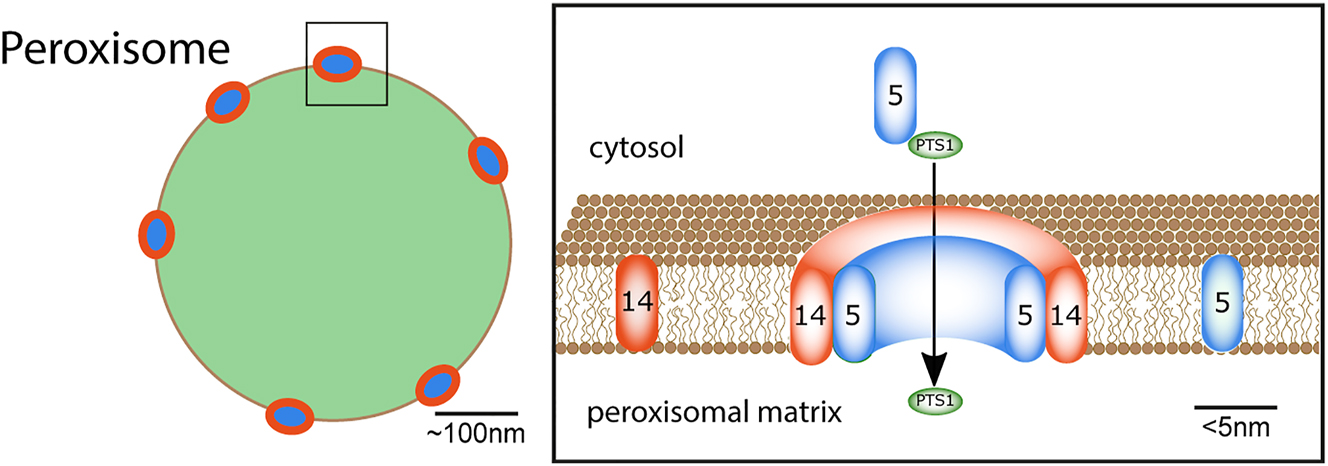
Sketch of the peroxisomal protein import process. (Right) peroxisome (green) with peroxisomal import translocons (blue, red-ringed) at the peroxisomal membrane (black border). (Left) close-up of a part of the peroxisomal membrane with peroxisomal import receptor PEX5 (blue), membrane protein PEX14 (orange), both components of the translocation pore, and PTS1 cargo-protein (green). The cargo receptor PEX5 binds PTS1-containing cargo-proteins in the cytosol, directs it to the peroxisomal membrane, where PEX5 becomes part of the translocation pore, the PTS1-containing cargo-proteins become imported, and PEX5 is released afterwards. Adapted from Galiani et al. (2016).
Lens-based microscopy and the diffraction limit
At first, we give a general overview over optical and fluorescence microscopy, most importantly introducing its spatial resolution limit. As highlighted, optical microscopy has been established as key technology in the life sciences. When combined with the fluorescence readout, it offers the specific and highly sensitive detection of distinct cellular constituents (Pawley 2006). This is usually achieved by tagging molecules of interest with fluorescent molecules (denoted fluorophores) such as organic dyes (through immunolabeling with dye-tagged antibodies) or fluorescent proteins (through cellular expression with tagged protein). To minimize invasiveness, optical microscopy of the living cell is usually applied in the far-field, i.e. a lens-based system is employed to excite and detect the fluorescence emitted from the molecules micrometres to millimetres away from any optical element. This not only preserves the non-invasiveness but also realizes the ability to image deep inside living cells or tissue. However, the concomitant focusing of light introduces diffraction of light and thus the most prominent limitation of optical microscopes, since details far below the light wavelength, i.e. in the range of below 200–300 nm, cannot be directly resolved and remain hidden to the observer (Abbe 1873).
The most straightforward far-field fluorescence microscopy approach is the wide-field mode, where a large area is excited at once and imaged onto a camera, and the confocal mode, where only a small spot (volume) is excited, its fluorescence detected by a point detector, and the final image formed by scanning the spot over the sample (Figure 2A,B). By using lenses, however, the spatial resolution of a microscope, i.e. the minimal spatial distance of two nearby alike objects at which they still can be discerned, is limited by diffraction. Diffraction is a physical phenomenon that occurs at apertures like slits, pinholes or the edges of a lens. Thereby, light is diverted (i.e. diffracted) at the aperture’s edges, leading to a light intensity pattern of certain size in, for example, the focus of a lens. Most importantly, it cannot be unlimitedly small, even for a very strongly focusing lens. The diameter d of the focal light intensity pattern, i.e. of the so-called point-spread-function (PSF), is governed by the wavelength λ of the light and the focusing strength or numerical aperture NA = n sinα of the lens (with focusing angle α and the refractive index n of the medium between lens and sample): d xy ≈ λ/(2n sinα) along the lateral xy-axes and d z ≈ λ/(n sin2α) along the optical z-axis (Born and Wolf 2019). This extended PSF rules both the fluorescence excitation and collection process, and for basically all conventional optical far-field microscopy approaches including the wide-field variant precludes the discerning of simultaneously emitting molecules which lie within this PSF. For visible light (λ ≈ 500 nm) structural details below approximately 200 nm thus appear blurred and indiscernible in the final image (Figure 2C). This determines the spatial resolution of the microscope, i.e. the minimal distance at which alike objects can still be distinguished in space.
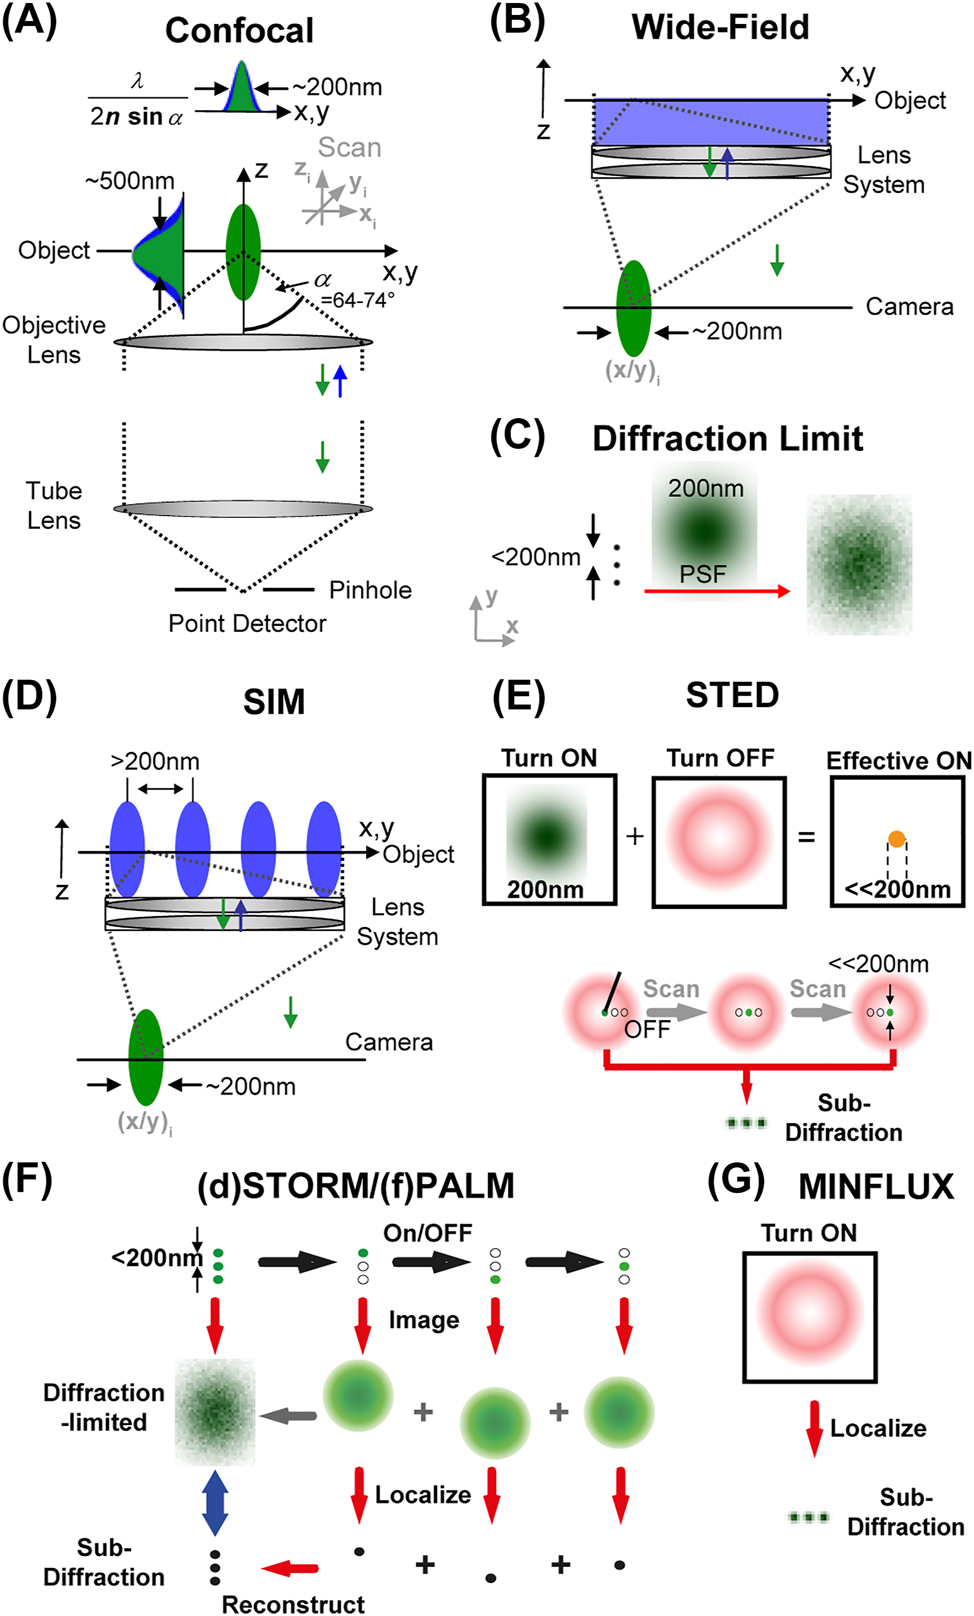
Overview over different far-field fluorescence microscopy approaches. Generally, in a far-field fluorescence microscope, an object is illuminated with excitation light (blue) and its fluorescence (green) imaged onto a detector using a lens system, whereby the object is placed > μm away from any optics. Conventional diffraction-limited confocal (A) and wide-field (B) microscopy. In a wide-field microscope a large area of the object is illuminated at once and signal imaged onto a camera, while in a point-scanning confocal microscope a diffraction-limited volume is illuminated, signal detected on a point-detector through a pinhole, and the final image formed by scanning the spot over the object. (C) The size of the focused and observed spot is governed by the focusing strength of the objective lens (given by the angle α), the wavelength λ of the applied light, and the refractive index n of the object medium. Due to the focusing of light one cannot image point-like objects to dimensions smaller than approximately 200 nm in the lateral (x, y) and 600 nm in the axial (z) directions for visible light. This finite-sized, diffraction-limited point spread function (PSF) precludes the discerning of alike objects closer together than these 200 nm and results in blurred images at these spatial scales. (D) Diffraction-limited SRM: a two-fold increase in spatial resolution has been realized by SIM using, for example, a standing wave pattern in a wide-field mode with the pattern maxima separated by more than the 200 nm. (E) Diffraction-unlimited targeted SRM – STED microscopy: usually realized on a confocal microscope, the diffraction-limited spot of the fluorescence excitation or turn-on laser (green, left) is overlaid with an additional turn-off laser, the STED laser, which features a central intensity zero and reversibly inhibits fluorescence everywhere but at the center (red, middle), resulting in an effective fluorescence on spot of sub-diffraction size (right). Scanning of this spot realizes imaging with sub-diffraction resolution, and thus the discerning of alike objects closer together than 200 nm (lower panel). (F) Diffraction-unlimited stochastic SRM – SMLM ((d)STORM/(f)PALM): images with sub-diffraction spatial resolution are reconstructed from consecutive camera frames with simultaneous imaging and position-localization of single isolated fluorophores only, whose fluorescence emission is switched on and off one after the other. (G) Diffraction-unlimited SRM – MINFLUX microscopy: the fluorescence emission of individual fluorophores is switched on and off one after the other (as for SMLM) and their spatial localization determined relative to a donut-shaped excitation laser (as for STED) from a minimized fluorescence detection. Adapted from Eggeling et al. (2015).
Towards super-resolution microscopy; diffraction-limited SRM
Confocal microscopy
Over the decades, various approaches have been put forward, claiming an improvement in spatial resolution, yet often with limited success. For example, the diffraction barrier cannot be overcome by confining the collected fluorescence through a pinhole placed in front of a point detector, as realized in spot-scanning confocal microscopy (Figure 2B). Through the pinhole, the width of the effective focal spot or PSF is theoretically reduced by a factor of √2 (Minsky 1961; Pawley 2006; Sheppard 1985), but this improved spatial information is usually heavily damped and thus lost in noise. Here, recent hybrid approaches of confocal imaging with a very small pinhole and deconvolution-based post-processing of the acquired images, as introduced by commercial providers (e.g. HyVolution or FV-OSR), can improve the recovery of some of the aforementioned increased spatial information, but again are hampered by an increased noise level stemming from the decreased signal throughput through the reduced pinhole. The main reason why the confocal laser scanning microscope is considered as the workhorse of fluorescence microscopy results from a superb background rejection when detecting through a pinhole, which significantly improves three-dimensional imaging (Pawley 2006; Sheppard 1985).
Two-photon microscopy
Also, two-photon excitation microscopy was often considered to generate a reduced effective PSF and thus an improved spatial resolution. In two-photon microscopy, fluorescence emission results from the simultaneous absorption of two photons, and the wavelength of the excitation light is usually chosen to be double the wavelength that would be used for conventional one-photon excitation (Bloembergen 1965; Denk et al. 1990; Sheppard and Kompfner 1978). The necessity to simultaneously absorb two photons results in a non-linear squared dependence of the fluorescence emission on the excitation intensity. Because of this non-linearity, the effective focal fluorescence spot or PSF is indeed slimmed compared to the original laser excitation spot. However, this is counteracted by having to choose a doubled wavelength λ for two-photon excitation, i.e. the diameter d xy ∼ λ of the excitation PSF is twice as large from the very start (Denk et al. 1990). Consequently, in total the effective PSF of two-photon microscopy is larger than that of its one-photon counterpart and thus the spatial resolution of a two-photon microscope slightly poorer (Schönle et al. 1999).
Mathematical approaches
Other approaches to overcome the diffraction barrier employ purely mathematical processing of the imaging data such as deconvolution algorithms (Bertero et al. 1990; Bertero and Patrizia 1998; Jose-Angel and James 1996) or most recent artificial-intelligent (AI) or deep-learning (DL) approaches (for example Park et al. 2022; Wang et al. 2019; Zhang et al. 2021). Such computational methods usually require a priori knowledge of parameters of the imaging system (such as the PSF) and/or of the imaged object. Due to a potential lack of accurate a priori information or challenges in establishing accurate training data for AI and DL algorithms, these approaches are unfortunately prone to artifacts and rarely exceed a 2-fold increase in spatial resolution.
Structured illumination
Several approaches have implemented the use of structured illumination for increasing the spatial resolution of a far-field fluorescence microscope for example (Ash and Nicholls 1972; Bailey et al. 1993; Lukosz 1966). Structured illumination microscopy (SIM) by, for example, a standing wave pattern (Figure 2D) is a well-established microscopy technique, allowing the far-field imaging with a two-fold improvement in the lateral and axial resolution (Frohn et al. 2000; Gustafsson 2000; Gustafsson et al. 2008; Schermelleh et al. 2008); and reviewed in Heintzmann and Huser (2017). SIM is very photon-efficient, allows routine imaging with multiple colours with conventional fluorophores, and is generally considered a “mild” SRM technique, best suited for live cell imaging (Baddeley and Bewersdorf 2018; Burgert et al. 2015; Tokunaga et al. 2008). However, SIM relies on mathematical post-processing and a carefully aligned and calibrated microscope setup, bearing an increased risk of reconstruction artefacts, which require significant knowledge to detect and counteract (Ishitsuka et al. 2014). SIM has also been realized based on a confocal microscope with single- (Müller and Enderlein 2010) or multi-spot (York et al. 2012) illumination, yet introducing camera detection instead of detection through a pinhole. These confocal-based SIM methods can employ more robust deconvolution reconstruction algorithms with reduced risk of artefacts and have therefore been implemented commercially as readily available extensions to existing top-end commercial confocal systems (Airyscan, RCM, iSIM). Consequently, confocal-based SIM requires only little adaptation in terms of sample labelling and preparation and thus has quickly become a popular entry level choice to realize up to 1.7-fold improvement in lateral and ∼5-fold improvement in volumetric resolution (Gustafsson et al. 2016; Keller et al. 2008; Manley et al. 2008).
Conclusion: diffraction-limited SRM
Although often considered already as being super-resolution, the spatial resolution of all these microscopes is still limited, i.e. they do not surpass the diffraction barrier, but they rather push diffraction to its limits, and consequently can be termed diffraction-limited SRM. As summarized in Eggeling et al. (2015), diffraction-limited SRM approaches at best double the spatial resolution in x, y-and z-direction, equivalent to an ∼8-fold volumetric improvement, i.e. the absolute resolution is wavelength-dependent and typically reaches down to 100 nm laterally and 300 nm axially with standard high numerical-aperture objectives. Particularly, diffraction-limited SRM techniques are geared towards live cell imaging and higher throughput applications.
Diffraction-unlimited super-resolution microscopy
Diffraction-unlimited SRM techniques, also often referred to as nanoscopy, can push spatial resolution levels theoretically down to infinitesimally small scales. Their unifying basic principle is to reversibly inhibit the fluorescence emission, e.g. using fluorescent labels with multiple discernible states (such as an on- and an off-state) (Hell 2003, 2004, 2007). This group can be subdivided into targeted (or deterministic) and stochastic approaches.
Targeted SRM
The first targeted approach to appear was Stimulated Depletion (STED) microscopy. Here, fluorescence is inhibited in a targeted way, i.e. at pre-defined spatial positions (Figure 2E). Usually realized on a confocal microscope, the laser beam that excites fluorescence, i.e. which switches fluorescence on, is overlaid by a second laser beam (often termed depletion or STED laser) that switches off the fluorescence emission. Since featuring a focal intensity distribution with at least one local intensity minimum (a zero-intensity point, for example at the focal center in a donut-like intensity pattern) this depletion laser light beam selectively inhibits fluorescence everywhere but at the zero-intensity point, which generates an effective fluorescence observation spot of sub-diffraction size. Scanning of this spot over the sample therefore entails images constituting a huge and in principle unlimited improvement in spatial resolution – the larger the intensity of the depletion laser, i.e. the more efficient the inhibition, the smaller the effective fluorescence spot and thus the better the spatial resolution. Consequently, the spatial resolution is ruled by the amount of light one puts into the system. In STED microscopy, reversible inhibition of fluorescence is realized by stimulated emission. Since the emission of in principle any fluorophore can be stimulated, STED microscopy is theoretically applicable to conventionally prepared samples. It has been optimized to allow for three-dimensional, multi-color, live-cell and tissue observations, and has thus become a popular SRM tool, realized on multiple commercial machines (Eggeling et al. 2015).
RESOLFT microscopy (Reversible Saturable OpticaL Fluorescence Transition) realizes targeted SRM by employing reversibly photoswitchable fluorophores for reversible inhibition of fluorescence and thus for switching off fluorescence emission everywhere but at a local focal intensity minimum. Compared to stimulated emission, this photoswitching approach requires much less laser intensities and consequently applications have highlighted very high resolution enhancement when imaging structures in living cells (Grotjohann et al. 2011; Hell 2003; Hofmann et al. 2005; Masullo et al. 2018). However, the necessity for specific reversibly photoswitchable fluorophores has so far prevented its wide-spread use.
Stochastic SRM
Stochastic nanoscopy approaches are usually summarized under the name Single-Molecule Localization Microscopy (SMLM). Different acronyms have been introduced here, such as STORM (Rust et al. 2006), ((f)PALM), Ground State Depletion Microscopy followed by individual molecule return (GSDIM) (Fölling et al. 2008), direct STORM (dSTORM) (Heilemann et al. 2008) or Single-Molecule Active Control Microscopy (SMACM) (Biteen et al. 2008), but they all are based on the same principle (for example reviewed in Lelek et al. 2021). SMLM relies on the stochastic on- and off-switching of the fluorescence emission of individual, well-separated labels combined with the determination of their exact spatial positions (Figure 2F). Employed on a wide-field microscope, the spatial distribution of labeled molecules is determined by imaging the fluorescence onto a camera. Again, alike objects closer together than 200 nm cannot be distinguished, since due to the diffraction of light the image of a single point (PSF) appears blurred on the camera. By inhibiting the fluorescence emission of most of the labels, only single isolated molecules can fluoresce at a given time, and their spatial positions can be precisely determined from their blurred image spots on the camera using different localization approaches. By stochastically switching on and off different single isolated molecules in subsequent camera recordings, the final image with sub-diffraction sized spatial resolution is reconstructed from the summation of all localized spatial positions. Among other factors such as labeling density and camera readout noise, the spatial resolution is ruled by the amount of fluorescence emitted from an individual fluorophore used for localization, i.e. from the amount of light one gets out of the system. Due to superb reduction of background light, SMLM is often preferred with evanescent illumination, i.e. on a Total Internal Reflection Fluorescence (TIRF) microscope; this TIRF mode, however, restricts the observation range to cell surfaces at the microscope cover glass. However, adaptation of SMLM allows nowadays also to generate super-resolution images along all three spatial dimensions, for multiple colors, and in tissue, and it has thus also become a popular SRM tool, distributed through various commercial instruments (Schermelleh et al. 2019).
MINFLUX
For both STED/RESOLFT and SMLM there is a very high demand for laser or fluorescence light to reach high spatial resolution. For example, for targeted SRM such as STED a large amount of laser light must be put into the system for a maximized inhibition of fluorescence, and for SMLM a maximum amount of fluorescence light must be squeezed out of the system for an accurate molecular localization. In recently developed MINFLUX microscopy (single molecule localization with MINimal emission FLUXes), spatial resolution is improved by minimizing fluorescence light output instead of maximizing it (Balzarotti et al. 2017; Sahl et al. 2017). In MINFLUX, the targeted and stochastic microscopy concepts are kind of combined by localizing the position of individually switched-on fluorophores relative to a local intensity zero of the fluorescence excitation laser, e.g. the focal center in a donut-like intensity distribution as employed for the STED laser (Figure 2G). In more detail, this donut-like laser focus is scanned around an individual molecule to identify the spatial position of minimal fluorescence emission and thus of the molecule with high precision. After switching on and off and localizing multiple individual molecules, the final image is reconstructed from all spatial localizations (as for SMLM). The spatial resolution achieved in a MINFLUX microscope is given by several experimental factors such as the scanning process (e.g. how precise one scans the donut-center around the molecule) and the fluorescence quantum yield of the fluorophores. The latter is generally important in any fluorescence microscope (and especially in SMLM), where a high fluorescence quantum yield is anticipated to maximize detected signal, guaranteeing a high image contrast. In MINFLUX microscopy, however, a fluorophore with a high quantum yield is not employed to “squeeze out” as many photons, but it guarantees an efficient scan around an individual fluorophore. Imaging data recorded on model as well as cellular samples has highlighted spatial resolution down to a few-nm range, however at much reduced laser powers compared to STED microscopy or SMLM, and also the possibility to record three-dimensional and multi-color data (Pape et al. 2020; Schmidt et al. 2021).
Super-resolution microscopy: limitations and potentials
The different SRM techniques have their specific advantages and disadvantages with respect to, for example, photobleaching, setup complexity, image acquisition speed, or requirement for image reconstruction.
Image artefacts
For instance, reconstruction algorithms based on the identification and localization of single isolated molecules from multiple images need to be employed to create the final image in SMLM and MINFLUX, while a direct image of the spatial distribution of labelled molecules is formed in targeted STED and RESOLFT microscopes. Unfortunately, the reconstruction process in SMLM potentially may introduce artefacts, for example from a lack of knowledge of missed or repeated recordings of molecules (Shroff et al. 2008; Small 2009) or from out-of-focus molecules (Enderlein et al. 2006; Engelhardt et al. 2011). Nevertheless, quite some improvements in the identification and localization algorithms have been developed over the past years, especially aimed at image reconstructions for more densely labelled samples and/or those having low signal-to-noise levels (see for example Gustafsson et al. 2016; Lelek et al. 2021; Marsh et al. 2018). A major improvement in the reliability of SMLM has also been put forward through the implementation of transient on/off binding of fluorescent labels (instead of relying on photophysical transitions) (Sharonov and Hochstrasser 2006), e.g. through oligonucleotide hybridization in DNA-PAINT (Point Accumulation for Imaging Nanoscale Topography) (Ehmann et al. 2014; Jungmann et al. 2016), thereby reducing energy load and extending possibilities for multiplexing. Also, for SMLM live-cell recordings can be imitated by tracking and simply summing up the localized positions of the individual molecules over time, helping to identify favored areas and exclusion zones of specific molecules (Manley et al. 2008). Similar of all of the above arguments hold true for MINFLUX microscopy, but being a relatively young technique, its possible artefacts and potentials still need more evaluations (Prakash 2022; Prakash and Curd 2022; Sahl et al. 2017), best through a widespread use in various applications (Schmidt et al. 2021).
Photobleaching and phototoxicity
Fluorescence microscopy experiments in general suffer from photobleaching of the fluorescent tags as well as phototoxic effects. In photobleaching, the laser-induced elevation to the excited state of a fluorophore, which is required for fluorescence generation, results in a higher chemical reactivity and thus in potential reactions to non-fluorescent or differently fluorescent species, depending on various factors such as illumination light intensity, the fluorophore’s excited state lifetime, oxygen levels, or the immediate chemical environment (see for example Eggeling et al. 1998). Phototoxicity usually originates from light-induced generation of toxic chemicals such as radicals, for example leading to cell death or cellular malfunctions. Consequently, photobleaching and phototoxicity all limit the recording time as well as reliability of the experiments. Photobleaching of the fluorescent labels is a more complex issue in deterministic-based microscopy, especially STED microscopy. Whereas in SMLM and MINFLUX a molecule needs in principle to be switched on and off only once, the fluorescence must be switched on and off multiple times during the scanning recording of the deterministic microscopy approaches, favoring labels and experimental conditions that supply this condition. Further, relatively large laser powers are employed in STED microscopy, potentially leading to increased photobleaching and phototoxicity. While from theory stimulated emission reduces the lifetime of the excited state and therefore increases the photostability of the fluorophore, unwanted excitation to very high excited states usually antagonizes this process (Eggeling et al. 2015). Several methods have been put forward to counteract photobleaching and phototoxic effects in STED microscopy, such as recordings based on fast beam-scanning and intelligent light-exposure schemes (Donnert et al. 2006; Dreier et al. 2019; Heine et al. 2017; Hoebe et al. 2007; Jahr et al. 2020; Staudt et al. 2011), nowadays even implemented on commercial instrumentation. General to SRM and any fluorescence recording, photobleaching and phototoxicity vary between experiments, and thus experimental conditions need to be carefully optimized, such as choice of sensitive, high-quantum yield and photostable and if required photoswitchable labels, well-prepared samples (e.g. labelling with minimum background and “healthy” living cells), and adapted data acquisition protocols (e.g. point-scanning or camera-frame speed, laser intensities) (Eggeling et al. 2015; Kilian et al. 2018; Schermelleh et al. 2019). MINFLUX inherently reduces photobleaching by minimizing photon output. STED microscopy offers unique options for experimental optimization, since adaptation of the depletion (or STED) laser intensity allows trading off spatial resolution against phototoxic effects and scanning speed, i.e. image acquisition time.
Temporal resolution and dynamics
Image acquisition time and thus temporal resolution is especially important for live-cell observations, where a high temporal resolution guarantees the accurate recording of cellular and molecular dynamics. Temporal resolution is inherently low for image recordings in SMLM or MINFLUX, since the final image is created from a multitude of individual images (usually 1,000 to 100,000). Image formation time and thus temporal resolution in STED microscopy depends on the point-scanning speed, which – as highlighted – can be increased by sacrificing either brightness or spatial resolution, i.e. by simply scanning faster or with less STED laser power (i.e. increased effective PSF), respectively. Yet, STED microscopy has shown fast (around 0.1–1 s range) image acquisition times, especially for small (few µm) fields of view. For live-cell recordings a good compromise might, as already indicated, be diffraction-limited SRM approaches such as SIM, which even more sacrifices spatial resolution against temporal resolution. On the other hand, interaction dynamics of molecules can be resolved temporally as well as spatially when employing single-molecule fluorescence approaches on a super-resolution microscope, as detailed in in the chapter Studying peroxisome related molecular dynamics. In this respect, SMLM is inherently based on identifying, localizing and thus counting single molecules and it thus has the great advantage of delivering quantitative data such as number of molecules per interaction or cluster site.
Expansion microscopy
A completely different, non-optical SRM approach is expansion microscopy (ExM) (Chen et al. 2015). ExM uses physical expansion of the sample, which then discloses structural details at the nanoscale even with conventional diffraction-limited optics (Wassie et al. 2019). Specifically, after specific fluorescence labeling, the fluorophores are fixed to a polymer matrix, which is then allowed to swell in a controlled way and isotopically in all spatial dimensions (Chen et al. 2015; Tillberg et al. 2016). Usual protocols reach a 2-5-fold swelling along each spatial direction, allowing studies with accordingly increased spatial resolution (Wassie et al. 2019).Now even 10-fold expansion is implemented (Truckenbrodt et al. 2018). However, recent improvements in sample preparations such as iterative protocols have reached even further increased expansion values (Chang et al. 2017) or improved staining through labeling post expansion (F. U. Zwettler et al. 2020a). Here, observation of the expanded samples with SRM approaches have then approached spatial resolutions of down to 1 nm (Cahoon et al. 2017; Gao et al. 2018; Shaib et al. 2022; Wang et al. 2018; Zwettler et al. 2020b). Main applications are on tissue samples with a for example neurobiological focus. However, also cultured cells, viral particles, molecular complexes and single proteins have successfully been employed to ExM (Shaib et al. 2022; Wassie et al. 2019). Yet, ExM is only applicable with fixed samples. Further, the preparation protocols may not always be straightforward and may have to be adapted to a specific sample as well as require dedicated image analysis (Zwettler et al. 2021). Unfortunately, cases have been reported with inhomogeneous expansions throughout the cell, for example delivering different expansion factors for different cellular organelles with peroxisomes being least expandable (Büttner et al. 2021; King et al. 2020).
Summary: limitations and potentials
In summary, there are several SRM approaches that offer complementary possibilities: (i) diffraction-limited SRM approaches such as SIM or confocal Airy-scan are popular for live-cell or three-dimensional recordings, yet they deliver only moderate improvement in spatial resolution down to 100–150 nm and they require well-established but complex data analysis; (ii) STED microscopy has an in principle unlimited spatial resolution but at the expense of requiring large laser powers; usually 50–80 nm spatial resolution are employed; it allows flexible tuning of experiments between spatial and temporal resolution, direct image generation without the need for post-data analysis, fixed and live cell recordings (the latter best for small fields-of-view, few µm), use of in principle conventional fluorescent labels (dyes, fluorescent proteins) yet of good photostability, and combination with single-molecule spectroscopy. (iii) SMLM is advantageous for large-field-of-view recordings (several 100 µm) with down to around 10–30 µm spatial resolution on fixed cells, offers quantitative molecular data, but requires photoswitchable fluorophores (e.g. photoactivatable dyes or fluorescent proteins, special mounting conditions or transiently binding labels), dedicated data post-processing and rather long acquisition times, which is less convenient for live-cell recordings. (iv) MINFLUX microscopy is a rather novel approach where signal output is minimized instead of maximized, and which promises imaging down to an only few-nm spatial resolution; however it is as well requiring photoswitchable fluorophores, dedicated data post-processing as well as rather long image acquisition times, favoring small-fields-of-views on fixed cells, which still needs to be explored more. (v) ExM as a non-optical SRM approach requires dedicated sample preparation through swelling protocols and is limited to fixed samples, but especially through the combination with other SRM readouts promises down to a few nanometres spatial resolution.
Conclusions: limitations and potentials
Generally, increasing spatial resolution usually comes along with restrictions on other sides, such as experimental constraints like increased sensitivity towards irradiation intensities, accurate sample preparation protocols, labeling density and specificity, setup drifts and vibrations, and limited signal-to-noise ratio, which all influence the achievable resolution. The fact that all the microscopy approaches are complementary, whether they are diffraction-limited or with nanoscale resolution, promotes research environments with access to various kinds of microscopes and nanoscopes, depending on their suitability for the case in hand. In this respect, combination between technologies, such as fluorescence, electron or X-ray microscopy together with measurement of forces or ion currents (electrophysiology), can efficiently gather complementary data and thus increase information content and thus sensitivity and accuracy of experiments (Ando et al. 2018). A well-established and already commercialized example is correlative light and electron microscopy (CLEM), where the ultrahigh resolution but molecule-unspecific data from electron microscopy is pooled together with molecule-specific but less resolved information from fluorescence microscopy.
Super-resolution microscopy: labelling issue
As discussed above, the advancements in SRM usually come with a price. For example, the new level of precision poses additional demands on labelling compared to diffraction-limited microscopy. Reasons are for example that SRM is much more prone to bias such as unspecific labelling and – as outlined – photobleaching of the labels. Further, the spatial resolution reaches the actual size of the labels. As a consequence, the latter may not report on the correct position of the tagged molecule anymore, an issue irrelevant to low-resolution imaging. We here give an overview of various labelling approaches and the challenges and potentials they face for SRM.
Immunolabelling: from antibodies to nanobodies
The probably most established fluorescence labelling approach for fixed (and permeabilized) cells is immunolabeling, where a usually non-labelled primary antibody specifically marks the targeted molecule and a labelled secondary antibody against the primary is used for visualization. However, the two antibodies (primary and secondary) have a size of about 10 nm each. Therefore, as indicated, the localized fluorophore will not exactly represent the position of the marked protein. In an electron microscopic study this linkage error was estimated to about 17.5 nm for immunolabeled microtubule (Weber et al. 1978). Obviously, the use of only one antibody, i.e. a labelled primary antibody (direct immunolabeling, as opposed to indirect immunolabeling with primary and secondary antibodies) can reduce this bias. Further, single domain antibodies or nanobodies have only a size of down to around 4 nm and can realize a further reduction of the localization bias. Unfortunately, their production and labelling is more elaborate and costlier than for conventional antibodies. For example, production of nanobodies includes the immunization of camelids which is a limiting factor for creating nanobodies against specific targets (Muyldermans 2013). However, nanobodies against general primary antibody features or against fluorescent proteins (such as the green fluorescent protein, GFP) are generic and have been used as labelled secondary tags in indirect immunofluorescence (Ries et al. 2012), clearly reducing the localization bias compared to indirect immunolabeling with a conventional-sized secondary antibody. Further optimization in the production process will probably soon introduce labelled primary nanobodies against many other proteins.
Another advantage of nanobodies, or classical secondary antibodies, is that they can be coupled to any fluorescent dye that might be beneficial for different SRM techniques. This makes them very flexible in use. On the other hand, antibodies often have varying labelling densities, which may lead to different imaging artefacts. The thiols of antibodies may be coupled to dyes functionalized with a maleimide group, but this reaction does not lead to a stochiometric labelling of the antibodies. By determining the degree of labelling after the coupling reaction, only the average number of fluorophores attached to one antibody can be determined.
The reduction to only a single dye linked to a protein of interest by one antibody or nanobody is especially beneficial for techniques that aim for a resolution down to a single fluorophore like SMLM or MINFLUX. This one-to-one labelling is a prerequisite for an accurate counting and quantification of molecules such as the determination of the number of proteins within an aggregate (Lelek et al. 2021). However, bias in fluorescence emission due to complex photophysics like quenching and thus inaccurate on-off switching often leads to a failure in registration of molecular localizations or overcounting of one molecule. For example, it has been reported that the blinking behaviour of fluorophores that are less than 10 nm apart is altered by resonance energy transfer between fluorophores and this can impair their localization (Helmerich et al. 2022). Consequently, such imperfections in fluorophore emission results in wrongly characterized protein aggregates. This potential artefact has to be considered in the data analysis and also sample preparation such as buffer conditions (Baumgart et al. 2016; Helmerich et al. 2022; Marsh et al. 2018). On the other hand. a one-to-one labelling approach is less advantageous for SRM techniques such as STED microscopy (and conventional wide-field or confocal microscopy). These usually rely on bright labelling for maximizing signal to noise ratio (SNR). This indicates the need for dedicated labelling and sample preparation.
Live-cell labelling
An alternative method to attach dyes to proteins is the use of fluorescent proteins or SNAP/HALO tags. These tags are fused directly to the proteins of interest and jointly expressed in cells. While fluorescent proteins are fluorescent on their own, SNAP/Halo tags require the addition of cell-membrane permeable fluorophore substrates that are functionalized to specifically dock to these tags. Fluorescent proteins and SNAP/HALO tags are applicable in both fixed and most importantly living cells (Bottanelli et al. 2016). However, they also have some restrictions. For example, the tag may impair the function of the protein by blocking interaction sites. Further, this tagging approach requires a modification of the gene of the protein of interest, which is usually done in transiently transfected plasmids. Thereby, the protein is usually overexpressed, which may lead to artefacts such as an artificial or miss-localizations. Also, the labelling efficiency of all these tags is varying. Consequently, it is hard to determine the fraction of expressed proteins that are actually labelled. Further, one needs to consider whether the untagged wild type form of the protein is still present in the observed system. In case of a mixed population of labelled und unlabelled protein, the formation of homo-oligomers or aggregates might remain undetected, as only a part of the subunits is labelled and thus visible in the microscope. A remedy to reduce bias induced by overexpression and expression of untagged wild type protein is the genomic integration of a tagged version of a protein under the regulation of the natural promotor by a CRISPR/Cas modification as demonstrated in (Bottanelli et al. 2017; Wong-Dilworth et al. 2022).
The labelling of SNAP and HALO tags depends on many factors such as the concentrations of the tag and the fluorophore substrate, as well as the accessibility of both in an experimental setup. For example, the membrane permeability of the substrate is often defined by the fluorescent dye coupled to it, or the structural formation of the protein can hinder the accessibility of the tag. With these limitations it becomes hard to determine the labelling efficiency of a given sample.
Labelling with unnatural amino acids
Finally, fluorescent proteins and SNAP/HALO tags are proteins on their own and therefore a rather bulky addition to the studied protein, exposing similar size problems as outlined for the antibodies. A remedy to this bulkiness is genetic code expansion (GCE) with unnatural amino acids and bioorthogonal click-labeling with small fluorophores (Peng and Hang 2016). Here, one amino acid of a protein is replaced by an unnatural amino acid, which can then be labelled by click chemistry. Specifically, one amino acid of the protein of interest gets mutated to an amber codon, and this modified protein needs to be expressed together with an aminoacyl-tRNA synthetase, which is integrating the non-canonical amino acid into the polypeptide chain during translation. In a second step, azide- or tetrazine-functionalized fluorophores are added to the growth medium and react with the specific non-canonical amino acid (Nikić et al. 2015). This method has the advantage that the protein gets labelled directly, without a large protein-tag. However, it needs genetic modification and some knowledge about the structure of the protein to make sure the replacement of the amino acid does not alter the structure or function of the proteins. Also, the unnatural amino acid needs to be accessible for the click reaction, currently restricting live-cell observations to surface proteins only.
Conclusions: labelling in SRM
Taking all of the above limitations together, a quantitative analysis of data from fluorescent optical microscopy is not straightforwardly done, as the number of fluorophores attached to one protein can vary with all available methods. This would only be possible by comparing conditions with very well-balanced controls. This shows that the molecular resolution with fluorescent labelled biological samples is a challenging task.
Super-resolution studies on peroxisomes
As highlighted already in the introduction, peroxisomes are vesicular organelles of size at, or below the diffraction limit (Figure 1), and thus the investigation of structural characteristics favours the use of SRM. Still, only a few intensive SRM studies have been performed so far. Here, we try to the best of our knowledge to give an overview over the SRM studies performed so far.
SMLM on peroxisomes
Peroxisomes have multiple times been used as one of many cellular structures to highlight methodological improvements of SMLM. One of the first SRM images of peroxisomes has been recorded with SMLM on fixed mammalian cells and immunostained for the peroxisomal membrane protein PMP70, mainly to demonstrate the achieved improved spatial resolution in two-colour SMLM relative to microtubule filaments (Figure 3A) (Fölling et al. 2008). Further, researchers have generated modified aptamers for DNA-PAINT like recordings and to highlight quantitative sub-10-nm cellular SMLM-based imaging (Strauss et al. 2018). Aptamers are nucleic acid–based ligands that specifically bind to proteins, and they have been fluorescently tagged and modified for slow off-rates, generating an on-off blinking in fluorescence emission similar to DNA-PAINT (denoted slow off-rate modified aptamers, SOMAmers). The authors specifically introduced a SOMAmer recognizing peroxisomal catalase in combination with antibody staining against PMP70 to realize multi-colour imaging of the peroxisomal matrix and membrane, respectively. Simultaneous imaging of multiple labels is not only implemented through the institution of labels emitting in different wavelength ranges (colours) but also with different lifetimes, as highlighted before in SRM (Bueckers et al. 2011; Masullo et al. 2020; Thiele et al. 2020). In a recent work, various cellular organelles including peroxisomes have been labelled with dyes of different fluorescence lifetime using DNA-PAINT and in this way distinguished in SMLM images (Oleksiievets et al. 2022). Specifically, the authors expressed fluorescent proteins to the organelles and used nanobodies with DNA-strands as well as complementary fluorescently tagged DNA strands for DNA-PAINT.
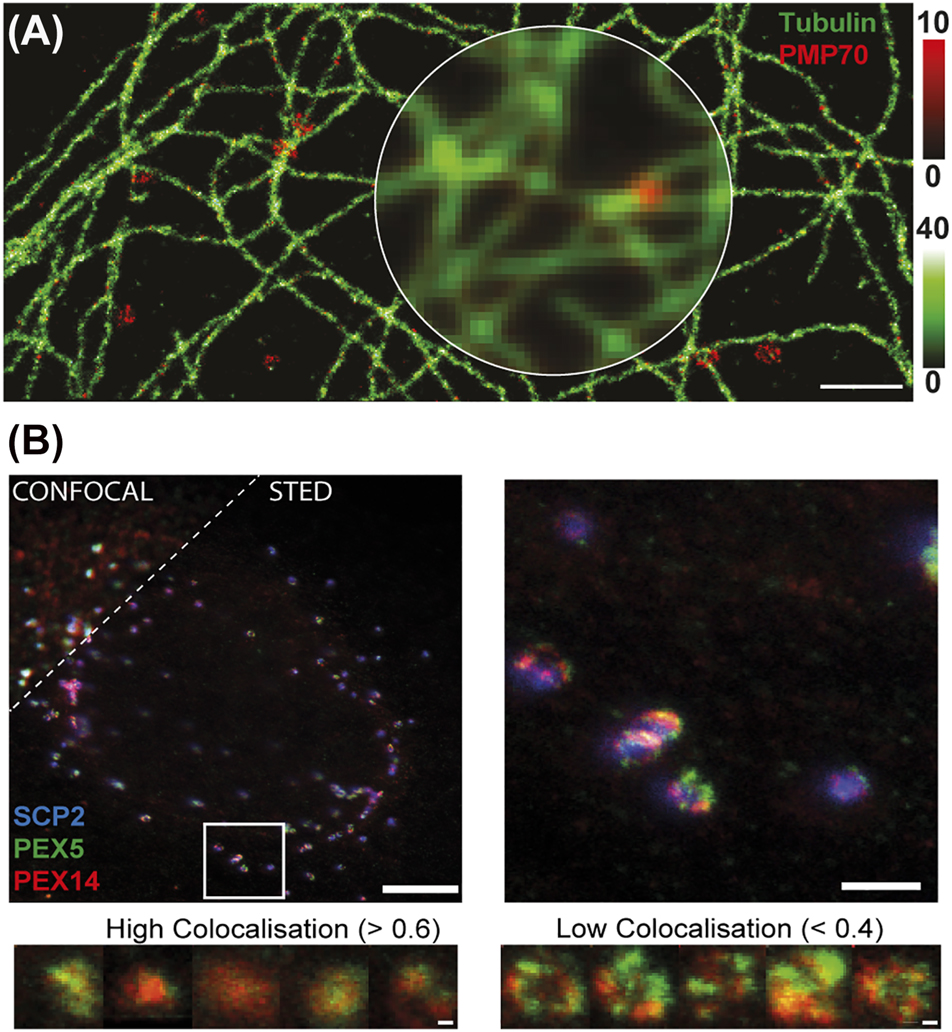
SRM on peroxisomes. (A) SMLM of immunostained peroxisomes (red, PMP70) and (B) microtubules (green) in fixed PtK2 cells with conventional wide-field counterpart (inner circle). Adapted from Fölling et al. (2008). (B) STED microscopy on peroxisomes in fixed fibroblast cells: colocalization study of proteins at peroxisomes. (Upper left panel) representative confocal (upper left corner) and STED (lower right part) images of fibroblast cells transfected with a fluorescent-protein tagged peroxisomal matrix marker (blue, GFP-SCP2, only confocal), fixed and immunolabelled for PEX14 (red) and PEX5 (green) with (upper right) and zoom-in of marked region; scale bars 5 µm (left), 1 µm (right). (Bottom panels) compartmentalization of peroxisomal membrane proteins: representative dual-color STED microscopy images of PEX5 (green) and PEX14 (red) for strong colocalization (Pearson’s test values > 0.6) and low compartmentalization of both proteins (left panels), and for low colocalization (Pearson’s test values < 0.4) and high compartmentalization of both proteins (right panels). Scale bars 200 nm. Adapted from Galiani et al. (2016).
Multi-colour STED microscopy
In 2016, we published a STED microscopy-based study of the organization of the peroxisomal proteins PEX5, PEX 14 and PEX11 on the surface of peroxisomes (Galiani et al. 2016). The experiments employed fixed and immunostained fibroblast cells in combination with dedicated image analysis, and revealed peroxisomes as predominantly circular shaped organelles with a heterogeneous size and shape distribution varying between around 130 to 650 nm in diameter, which highlights that sub-peroxisomal details like protein distribution and proximity cannot be studied with standard optical microscopy but require SRM. The study was mainly focused on the investigation of the peroxisomal import translocon, represented by the PTS1 import-receptor PEX5 and its interaction partner on the peroxisomal membrane PEX14. Using multi-color STED microscopy, we studied the distribution and colocalization of PEX5 and PEX14 relative to the peroxisomal matrix marker SCP2, an indicator of actively importing peroxisomes (Figure 3B). A strong heterogeneity between different peroxisomes were revealed: while most peroxisomes showed a strong colocalization of both proteins, small subpopulations of peroxisomes disclosed weak colocalizations between PEX5 and PEX14. The latter cases could represent stages in which PEX14 is interacting either with PEX19 (Neufeld et al. 2009) or microtubules (Bharti et al. 2011). To investigate these subpopulations in more detail, the morphological distribution of the different peroxisomal proteins at the peroxisomal membrane was compared to their colocalization: cases of strong colocalization were characterized by roundish and small staining patterns, while weak colocalization revealed larger ring-like or elliptical staining patterns of both PEX5 and PEX14, highlighting a clear compartmentalized organization (Figure 3B, bottom). Ongoing studies will implement further peroxisomal proteins, like PEX11 was already approached in this study, involve optimization of labelling, as outlined in the chapter Super-resolution microscopy: labelling issue of this review, and make use of other SRM approaches such as expansion or MINFLUX microscopy, as highlighted below.
STED microscopy of structures in peroxisomal ghosts
STED microscopy was also used to disclose structural details between peroxisomal membrane and matrix in human skin fibroblasts, which were immunolabeled with specific antibodies against the membrane protein PMP70 and the matrix protein ACAA (acetyl-CoA acyltransferase1) (Figure 4A). Here, also the size and morphology of ghost peroxisomes, which are a feature of cells from patients with a peroxisomal biogenesis disorder (PBD), were analysed. Caused by defects in different proteins involved in peroxisomal biogenesis, in these cells, the maturation and import of matrix proteins into peroxisomes is impaired and the cells contain “empty” ghost peroxisomes. The microscopy study highlighted that the peroxisomal ghosts were broadly distributed in size and abundancy, varying among different types of PBD. Ghost peroxisomes in PBD patient cells were significantly larger but less in number than wild-type peroxisomes in control cell lines (Figure 4B). By arranging patients according to increasing average peroxisomal size, it was found that peroxisomal ghost size was lower in patients with severe mutations compared to the milder clinical phenotypes.
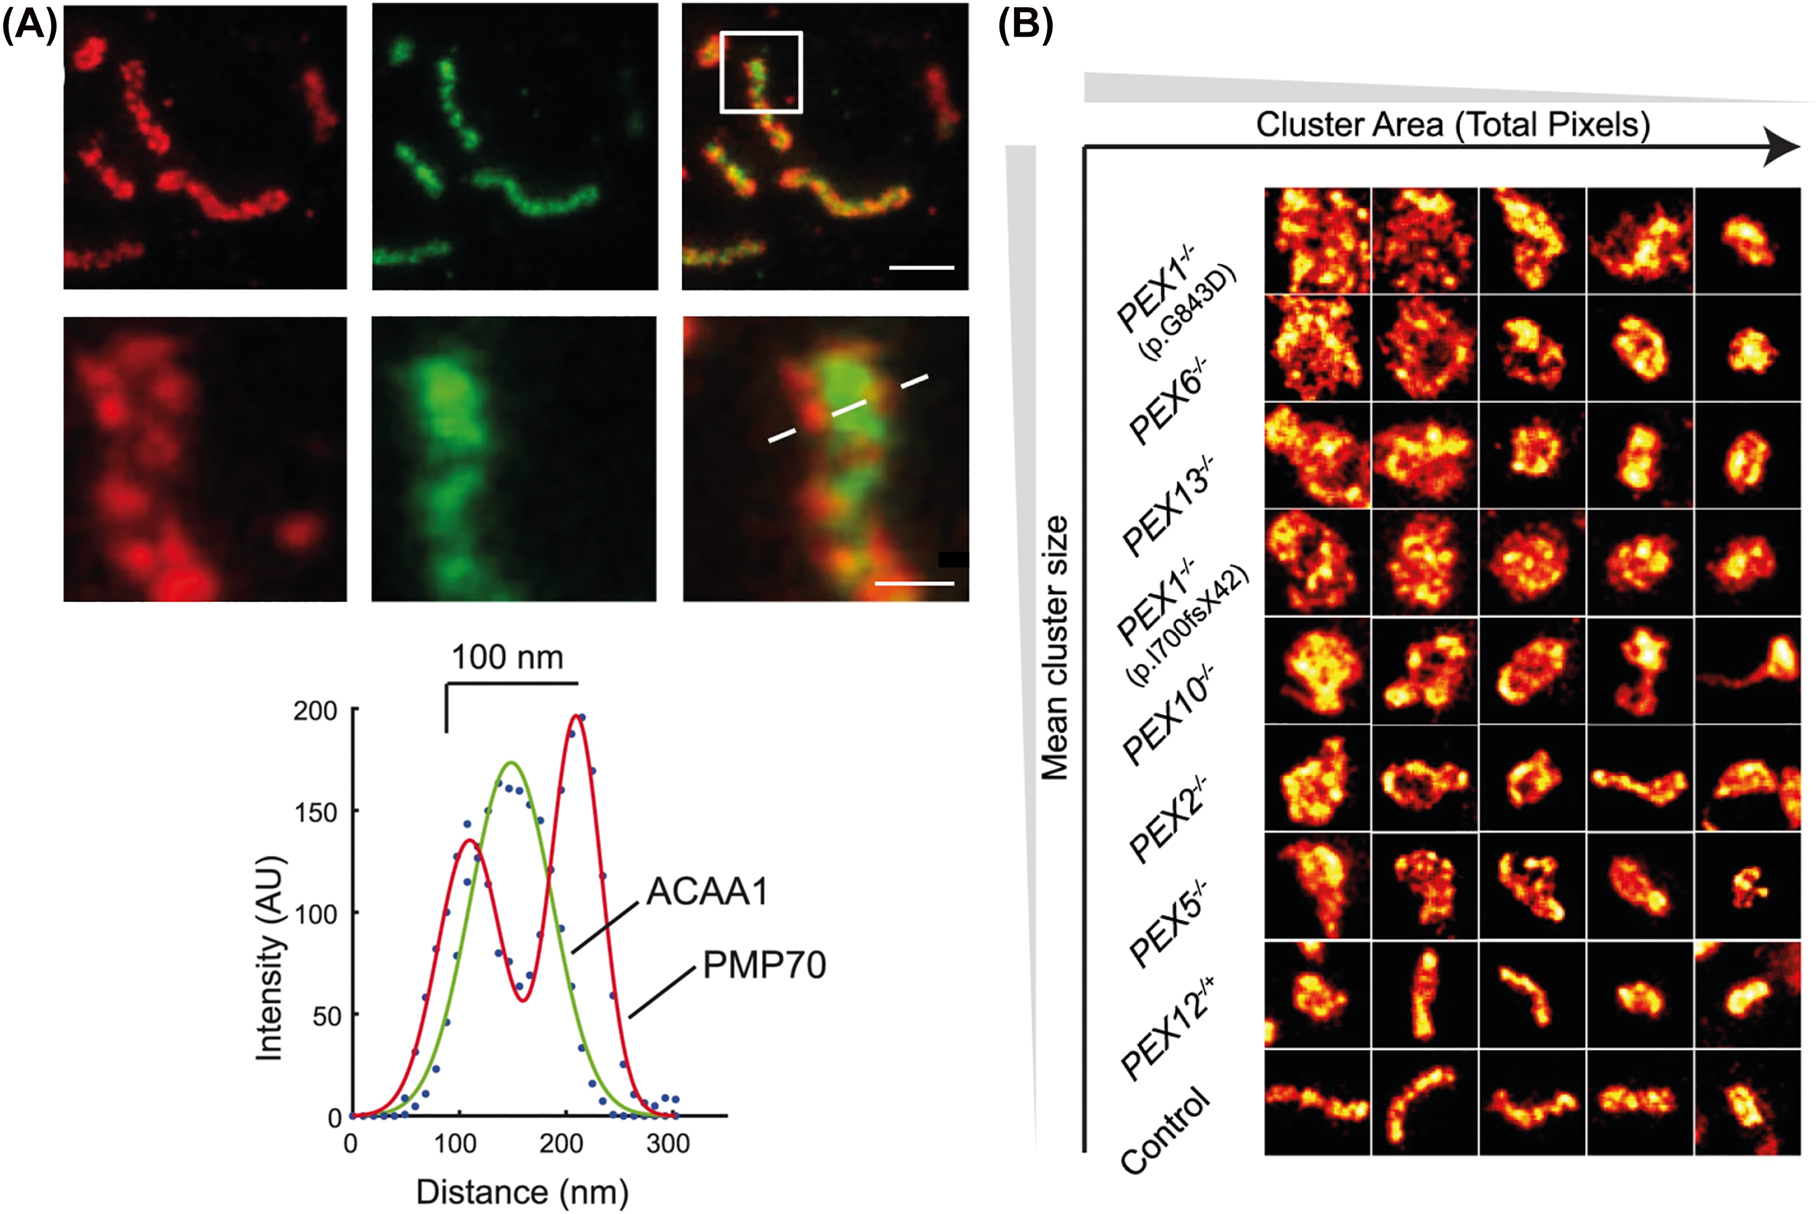
STED microscopy of peroxisomes in fixed human skin fibroblasts. (A) Two-color STED microscopy of peroxisomal membrane (PMP70, red) and matrix (anti-acetyl-CoA acyltransferase1, anti-ACAA1, green), and merged images of both (right): overviews (upper panels) and zoom-ins of marked area (lower panels), and intensity line profiles along dotted line. Scale bars 500 nm (upper) and 100 nm (lower). (B) ZSS patient peroxisomal ghost analysis: STED microscopy image tiles (1000 × 1000 nm) of peroxisomal membranes form patient fibroblasts immunostained for PMP70, indicating that PBD is associated with an increase in peroxisome circularity. Adapted from Soliman et al. (2018).
MINFLUX microscopy of peroxisomes
MINFLUX microscopy has also been used to image peroxisomes. MINFLUX microscopy data on the peroxisomal protein PMP70 in fixed Vero cells highlighted the capability of this technique to resolve individual proteins on the peroxisomal membrane (Schmidt et al. 2021) (Figure 5A). In addition, our first MINFLUX microscopy recordings of peroxisomal proteins (PEX5 and PEX14 in fixed HEK cells) disclosed the potential to perform dual-color recordings with very high spatial resolution in all three dimensions (Figure 5B).
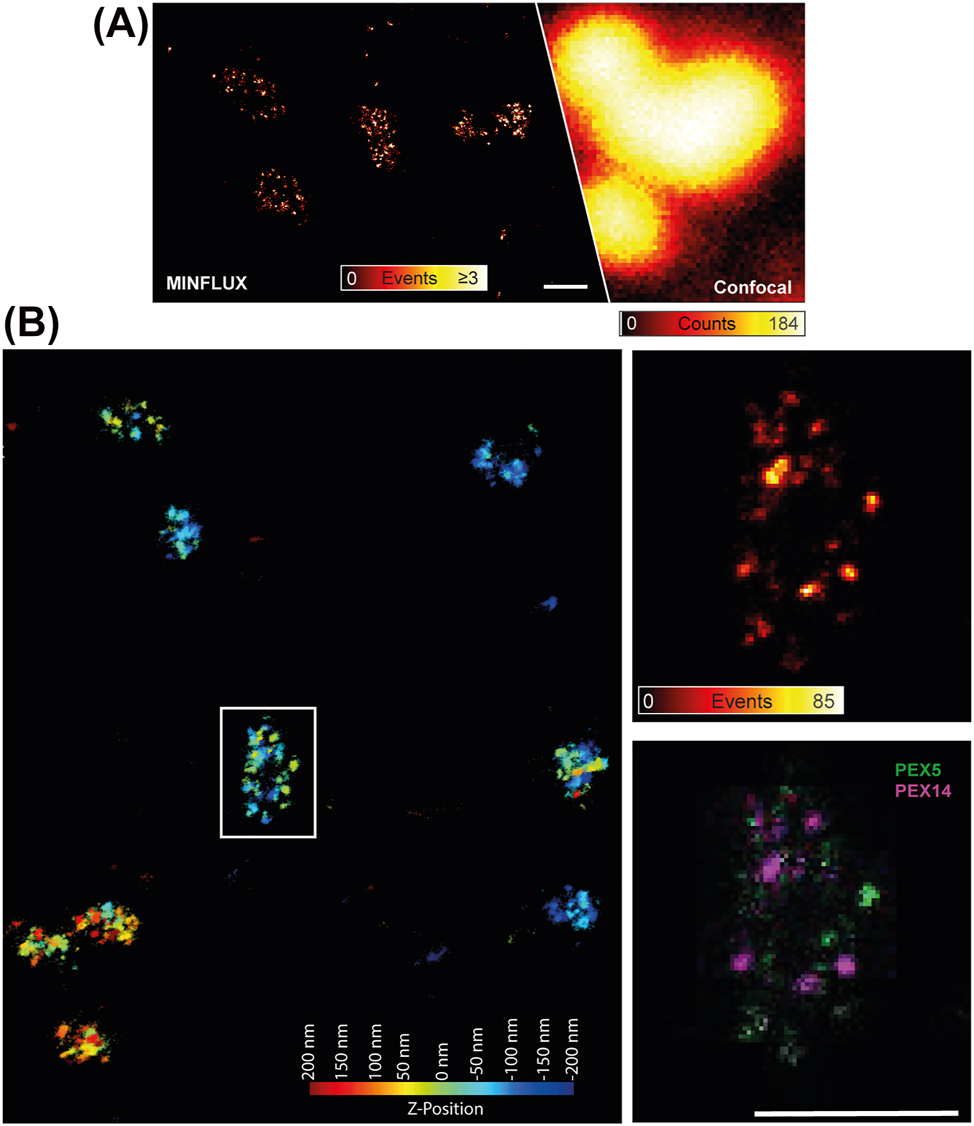
MINFLUX microscopy on peroxisomes. (A) Immunostained PMP70 in peroxisomes in a fixed Vero cell: individual protein localizations recorded with MINFLUX (left) and confocal counterpart (right); scale bar 100 nm. Adapted from Schmidt et al. (2021). (B) Two-dimensional projection of a 3D two-color MINFLUX recording of the peroxisomal membrane protein PEX14 (immunostained with sCy5, magenta) and the peroxisomal import receptor PEX5 (immunostained with CF680, green) in fixed human HEK cells and imaged simultaneously on a MINFLUX setup. The overview (left) shows the localizations colour-coded for their Z-position without an intensity value. The zoom-in at the marked area (right) shows the number of events (upper panel) and the dual labelling for the two peroxisomal proteins (lower panel); scale bar 100 nm.
Expansion microscopy on peroxisomes
We have further tested, whether ExM combined with STED microscopy can be used to study structural details of peroxisomes (Büttner et al. 2021). Unfortunately, this study revealed that the peroxisomal matrix and membrane expand differently in an acrylamide gel (Figure 6), which is probably due to the dense protein matrix in the lumen of peroxisomes that even forms a crystalline core (Smith and Aitchison 2013). This finding is also in line with the finding that peroxisomes do not swell in hypotonic solution, in contrast to other organelles such as the endoplasmatic reticulum and mitochondria (King et al. 2020). Consequently, with current sample preparation protocols peroxisomes might not be a suitable target for ExM.

Expansion in combination with STED microscopy on peroxisomes. HEK293 cells expressing a fluorescent peroxisomal matrix protein (magenta, GFP-PTS1, boosted with a fluorescent nanobody against GFP) were immunolabeled with an antibody against PEX14 (cyan), expanded and imaged in two-colour STED microscopy. (A) Expanded HEK cell and insets zoom-ins of marked areas. Scale bars as labelled. (B) Areas of the peroxisomes (median and standard deviation) as extracted from 500 to 3500 individual imaged peroxisomes for peroxisomal membranes (left, from PEX14 signal) and expanded matrices (right, from matrix protein) for expanded and non-expanded samples, highlighting different expansion factors of 4.35 for the membrane and 1.6 for the matrix. Adapted from Büttner et al. (2021).
Correlative microscopy on peroxisomes
An ultimate approach to study the morphology of peroxisomes and intracellular organelles in general has been presented through the combination of SRM fluorescence approaches with electron microscopy (CLEM) (Hoffman et al. 2020). Here a pipeline was developed to (i) preserve fluorescently labeled, cultured mammalian cells in vitreous ice; (ii) image selected cells by multicolor 3D-SIM and SMLM; (iii) image the same cells by 3D focused ion beam scanning electron microscopy (FIB-SEM) at 4- or 8-nm isotropic spatial resolution; and (iv) register all image volumes to nanoscale precision using dedicated image analysis. With this method, this study enabled the analysis of the volume and morphology of peroxisomes in COS-7 cells to a before unseen precision. It was found that peroxisomes show an increasing irregular morphology with increasing size. While small peroxisomes (below 0.01 mm³) are mostly spherical, larger peroxisomes are characterized by more irregular shapes like plates, cups and hollow sprees. Irregular shaped peroxisomes were also found in multi-organelle complexes, e.g. with mitochondria.
Labelling of peroxisomes for SRM
The same labelling issues as highlighted in the chapter Super-resolution microscopy: labelling issue for other proteins hold true for SRM experiments on peroxisomes. While there are well-established primary antibodies against peroxisomal proteins such as PEX5 and PEX14, and these were already successfully used in previous STED microscopy studies (Galiani et al. 2016; Soliman et al. 2018) and adapted for MINFLUX (Figure 5), a reduction in label size is specifically useful here due to the specifically crowded environment at the peroxisomal surface and matrix. Also, cellular expression of many peroxisomal proteins tagged with fluorescent proteins or SNAP/HALO tags is well established, especially for live-cell studies, and it has been combined with dye-tagged nanobodies for STED microscopy and SMLM (Galiani et al. 2016; Oleksiievets et al. 2020). In a recent study, fluorescent proteins as well as GFP-nanobodies have been combined in a cell-free system based on Xenopus egg extract to highlight novel details of the peroxisomal protein uptake mechanism (Skowyra and Rapoport 2022). However, also for peroxisomal proteins tagging with fluorescent proteins or SNAP/HALO tags might result in overexpression and thus artificial accumulation at the peroxisomal membrane, or even to miss-localizations to other organelles like mitochondria, favouring CRISPR/Cas-based genetic modifications (compare the chapter Live-cell labelling). Hopefully, with optimized production protocols soon labelled primary nanobodies against specific peroxisomal proteins or the direct introduction of labels through unnatural amino acids will soon become accessible.
Studying peroxisome related molecular dynamics
Time-lapse imaging
Besides recording images to explore structural and molecular details at a certain time point, it is often also important to follow their dynamics over time. Most simple is a frame-by-frame time-lapse recording of the same field of view, revealing structural changes. On one hand, this obviously precludes fixed but necessitates live samples, adding usually complexity in sample handling. On the other hand, temporal and spatial resolution have to usually be weighed against each other, since recordings with increased spatial resolution usually entail enlarged acquisition times or smaller fields-of-views, as highlighted in the chapter Temporal resolution and dynamics. Therefore, dedicated experimental protocols alongside with tailored image analysis are favoured, usually reaching a compromise between good spatial and temporal resolution. Outstanding examples have been the application of lattice light-sheet microscopy (Chen et al. 2014) and advanced SIM (Guo et al. 2018), where the combination with advanced spectrally resolved recordings and analysis revealed organelle interaction sites, the so-called organelle interactome, including contact sites and their dynamics of peroxisomes with for example mitochondria or endoplasmatic reticulum (Valm et al. 2017).
Spatio-temporal tracking of peroxisomes
Conventional wide-field or multi-focal confocal (e.g. spinning-disc) microscopy is usually enough to track the intracellular movement of individual peroxisomes. For example, by labelling peroxisomes with fluorescent-protein tagged imported proteins, tracks of individual peroxisomes revealed dependencies on intact microtubule network, further highlighting peroxisomal contacts with these inner-cellular filaments (Bharti et al. 2011; Castro et al. 2018; Reuter et al. 2021; Schollenberger et al. 2010). More advanced microscopy approaches such as single-molecule based spectroscopic methods are however required to follow dynamics at peroxisomes down to the molecular level.
Single-molecule studies of peroxisomal proteins
We have previously combined advanced live-cell microscopy and single-molecule based spectroscopy techniques such as fluorescence correlation spectroscopy (FCS) to further investigate the peroxisomal import process, specifically of the diffusion and thus interaction dynamics of the import receptor PEX5 in the cytosol (Galiani et al. 2022). In FCS, molecular mobilities are determined by measuring the time it takes for a fluorescently tagged molecule to traverse the microscope’s observation spot (Magde et al. 1974) (Figure 7A). Since bound molecules diffuse as one and slower than each of them individually, mobility is an excellent measure of interaction dynamics (Figure 7B). In our study, we disclosed an unexpectedly slow diffusion of PEX5, independent of many factors such as aggregation, target binding or cytoskeleton but associated with larger cytosolic interaction partners via the protein N-terminal half. Specifically, using FCS in combination with super-resolution STED microscopy (Sezgin et al. 2019), we highlighted that this association was not transient but rather stable over time (Figure 7C). Our study disclosed the potential of using complementary microscopy tools in combination with a gamut of differently designed control experiments to reveal molecular organization and interactions in the cytosol via studying their nanoscale distribution and diffusion dynamics to a yet unseen level of detail, paving the way for equally complex biological studies in the future.

Characterization of the cell-cytosolic diffusion of PEX5 (labelled via SNAP-tag) and a fluorescent-protein tagged import protein (eGFP-PTS1) using FCS. (A) Principle of FCS: FCS provides the average transit time tD of diffusing fluorescent molecules (green) through the microscope’s observation volume (blue) via calculation of the autocorrelation function (ACF) from the time trace of the detected fluorescence signal, independently for green and red labelled molecules, as well as the interaction between the two differently labelled molecules by calculation of the cross-correlation function (CCF), which only gives a non-zero amplitude if a fraction of both molecules diffuse together. (B) Representative confocal microscopy images of live human fibroblast cells with intact PEX5 (upper panels) and important-deficient variant PEX5 S600W (middle panels), and (lower panels) FCS data G (t) (dots, individual ACFs and CCF) and fits to the data (solid lines), highlighting only co-diffusion for PEX5 (and not PEX5 S600W), as expected. (C) STED-FCS study of PEX5 diffusion. (Left) Sketch of the principle of STED-FCS, where FCS data and the average transit time tD are determined at different observation spot sizes, as tuned by the intensity of the STED laser. The effective size of the observation spot (blue) decreases by increasing the power of the STED laser intensity (red, left), which shortens the decay time of the ACFs (middle panel). Right: STED-FCS data by analysing the transit times in dependence of the axial equatorial observation area highlights a linear dependency of tD on the observation spot size (PEX5 and PEX5 600 W in comparison to free cytosolic fluorescent protein eGFP with a SNAP-tag), indicating free diffusion (dotted line) and no transient interactions for all. Adapted from Galiani et al. (2022).
The dynamics of peroxisomal import have recently been studied further with related FCS-based approaches, specifically image- or camera-based fluorescence correlation spectroscopy, where mobility data is pooled over space and time (Ravindran et al. 2022). It was shown that not only Pex14 but also Pex13 correlates with a fluorescent import protein at the peroxisomal membrane after introduction of Pex5 expression in yeast cells.
Summary
In this review we have introduced the basics and differences of different SRM techniques and challenges their use in cell-biological investigations. Specifically, we have highlighted the need of using SRM to study structural and molecular details of peroxisomes, and summarized SRM studies of peroxisomes so far. In addition, further advanced techniques for measuring peroxisomal protein movement as well as the challenges of fluorescently labelling peroxisomal and cellular structures and molecules in general were summarized. With this we rolled out a kind of roadmap for designing microscopy experiments on peroxisomes. It is obvious that for many studies, conventional techniques such as wide-field and confocal microscopy are still enough. Anyway, sample preparations and controls should first be carried out with more simple and conventional microscopes, also to explore whether SRM, which always introduces more complexity, is really needed. As highlighted, all microscopy approaches are complementary, whether they are diffraction-limited or with nanoscale resolution, and this promotes research environments with access to various kinds of microscopes.
Funding source: Deutsche Forschungsgemeinschaft
Award Identifier / Grant number: research unit 1905
Award Identifier / Grant number: grant no. 322325142
Award Identifier / Grant number: EXC 2051 – Project-ID 390713860
Award Identifier / Grant number: 316213987 – SFB 1278
Funding source: Wolfson Foundation
Award Identifier / Grant number: Wolfson Imaging Centre
Funding source: Wellcome Trust
Award Identifier / Grant number: Grant No. 104924/14/Z/14 and Strategic Award 09191
Funding source: Bundesministerium fuer Bildung und Forschung
Award Identifier / Grant number: Photonics Research Germany - FKZ 13N15713/13N15717
Award Identifier / Grant number: LIVE2QMIC - FGZ 13N15956
Award Identifier / Grant number: Leibniz Center for Photonics in Infection Research (LPI)
Funding source: Medical Research Council
Award Identifier / Grant number: Grant No. MC_UU_12010/unit programs G0902418 and MC_UU_12025
Award Identifier / Grant number: Grant No. MR/K01577X/1
Funding source: Free State of Thuringia
Award Identifier / Grant number: TMWWDG
Award Identifier / Grant number: TAB - FGZ 2018 FGI 0022
Award Identifier / Grant number: TAB - FGZ 2020 FGI 0031
Award Identifier / Grant number: TAB - FGZ 2020-FGR-0051
Funding source: Innovation program by the German BMWi
Award Identifier / Grant number: ZIM - 16KN070934
-
Author contributions: All the authors have accepted responsibility for the entire content of this submitted manuscript and approved submission.
-
Research funding: The authors greatly acknowledge financial support by the Deutsche Forschungsgemeinschaft (DFG, German Research Foundation; under research unit 1905 “Structure and function of the peroxisomal translocon”, grant no. 322325142 “Super-resolution optical microscopy studies of peroxisomal protein import in the yeast Saccharomyces cerevisiae”, Germany’s Excellence Strategy – EXC 2051 – Project-ID 390713860, and project number 316213987 – SFB 1278), the State of Thuringia (TMWWDG), the Free State of Thuringia (TAB; AdvancedSTED / FGZ: 2018 FGI 0022; Advanced Flu-Spec / 2020 FGZ: FGI 0031; SARSRapid 2020-FGR-0051), the innovation program by the German BMWi (ZIM; project 16KN070934 / Lab-on-a-chip FCS-Easy), the MRC (Grant No. MC_UU_12010/unit programs G0902418 and MC_UU_12025), the Wellcome Trust (Grant No. 104924/14/Z/14 and Strategic Award 091911 (Micron)), MRC/BBSRC/EPSRC (Grant No. MR/K01577X/1), the Wolfson Foundation (for initial funding of the Wolfson Imaging Centre Oxford). Further, this work is supported by the BMBF, funding program LIVE2QMIC (FGZ: 13N15956) as well as Photonics Research Germany (FKZ: 13N15713 / 13N15717) and is integrated into the Leibniz Center for Photonics in Infection Research (LPI). The LPI initiated by Leibniz-IPHT, Leibniz-HKI, UKJ and FSU Jena is part of the BMBF national roadmap for research infrastructures.
-
Conflict of interest statement: The authors declare no conflicts of interest regarding this article.
References
Abbe, E. (1873). Beiträge zur Theorie des Mikroskops und der mikroskopischen Wahrnehmung. Arch. Mikrosk. Anat. 9: 413–418.10.1007/BF02956173Search in Google Scholar
Ando, T., Bhamidimarri, S.P., Brending, N., Colin-York, H., Collinson, L., De Jonge, N., de Pablo, P.J., Debroye, E., Eggeling, C., Franck, C., et al.. (2018). The 2018 correlative microscopy techniques roadmap. J. Phys. D Appl. Phys. 51: 443001, https://doi.org/10.1088/1361-6463/aad055.Search in Google Scholar PubMed PubMed Central
Ash, E.A. and Nicholls, G. (1972). Super-resolution aperture scanning microscope. Nature 237: 510–512, https://doi.org/10.1038/237510a0.Search in Google Scholar PubMed
Baddeley, D. and Bewersdorf, J. (2018). Biological insight from super-resolution microscopy: what we can learn from localization-based images. Annu. Rev. Biochem. 87: 965–989, https://doi.org/10.1146/annurev-biochem-060815-014801.Search in Google Scholar PubMed
Bailey, B., Farkas, D.L., Taylor, D.L., and Lanni, F. (1993). Enhancement of axial resolution in fluorescence microscopy by standing-wave excitation. Nature 366: 44–48, https://doi.org/10.1038/366044a0.Search in Google Scholar PubMed
Balzarotti, F., Eilers, Y., Gwosch, K.C., Gynnå, A.H., Westphal, V., Stefani, F.D., Elf, J., and Hell, S.W. (2017). Nanometer resolution imaging and tracking of fluorescent molecules with minimal photon fluxes. Science 355: 606–612, https://doi.org/10.1126/science.aak9913.Search in Google Scholar PubMed
Baumgart, F., Arnold, A.M., Leskovar, K., Staszek, K., Fölser, M., Weghuber, J., Stockinger, H., and Schütz, G.J. (2016). Varying label density allows artifact-free analysis of membrane-protein nanoclusters. Nat. Methods 13: 661–664, https://doi.org/10.1038/nmeth.3897.Search in Google Scholar PubMed PubMed Central
Bertero, M., Boccacci, P., Brakenhoff, G.J., Malfanti, F., and Voort, H.T.M.v. d. (1990). Three-dimensional image restoration and super-resolution in fluorescence confocal microscopy. J. Microsc. 157: 3–20, https://doi.org/10.1111/j.1365-2818.1990.tb02942.x.Search in Google Scholar
Bertero, M.B. and Patrizia (1998). Introduction to inverse Problems in imaging. CRC Press, Taylor & Francis Group, Boca Raton.10.1887/0750304359Search in Google Scholar
Betzig, E., Hell, S.W., Moerner, W., Eggeling, C., Kador, L., Sauer, M., and Welter, K. (2014). Nobel prize in chemistry: fascinating glimpses into the nanoworld. Chem. Unserer Zeit 48: 425.Search in Google Scholar
Bharti, P., Schliebs, W., Schievelbusch, T., Neuhaus, A., David, C., Kock, K., Herrmann, C., Meyer, H.E., Wiese, S., Warscheid, B., et al.. (2011). PEX14 is required for microtubule-based peroxisome motility in human cells. J. Cell Sci. 124: 1759–1768, https://doi.org/10.1242/jcs.079368.Search in Google Scholar PubMed
Biteen, J.S., Thompson, M.A., Tselentis, N.K., Bowman, G.R., Shapiro, L., and Moerner, W.E. (2008). Super-resolution imaging in live caulobacter crescentus cells using photoswitchable EYFP. Nat. Methods 5: 947–949, https://doi.org/10.1038/nmeth.1258.Search in Google Scholar PubMed PubMed Central
Bloembergen, N. (1965). Nonlinear optics. W.A. Benjamin Inc, New York.Search in Google Scholar
Born, M. and Wolf, E. (2019). Principles of optics: 60th anniversary edition, 7th ed. Cambridge, UK: Cambridge University Press.10.1017/9781108769914Search in Google Scholar
Bottanelli, F., Kilian, N., Ernst, A.M., Rivera-Molina, F., Schroeder, L.K., Kromann, E.B., Lessard, M.D., Erdmann, R.S., Schepartz, A., Baddeley, D., et al.. (2017). A novel physiological role for ARF1 in the formation of bidirectional tubules from the Golgi. Mol. Biol. Cell 28: 1676–1687, https://doi.org/10.1091/mbc.e16-12-0863.Search in Google Scholar
Bottanelli, F., Kromann, E.B., Allgeyer, E.S., Erdmann, R.S., Wood Baguley, S., Sirinakis, G., Schepartz, A., Baddeley, D., Toomre, D.K., Rothman, J.E., et al.. (2016). Two-colour live-cell nanoscale imaging of intracellular targets. Nat. Commun. 7: 10778, https://doi.org/10.1038/ncomms10778.Search in Google Scholar PubMed PubMed Central
Braverman, N.E. and Moser, A.B. (2012). Functions of plasmalogen lipids in health and disease. Biochim. Biophys. Acta, Mol. Basis Dis. 1822: 1442–1452, https://doi.org/10.1016/j.bbadis.2012.05.008.Search in Google Scholar PubMed
Bueckers, J., Wildanger, D., Vicidomini, G., Kastrup, L., and Hell, S.W. (2011). Simultaneous multi-lifetime multi-color STED imaging for colocalization analyses. Opt. Express 19: 3130–3143, https://doi.org/10.1364/oe.19.003130.Search in Google Scholar PubMed
Burgert, A., Letschert, S., Doose, S., and Sauer, M. (2015). Artifacts in single-molecule localization microscopy. Histochem. Cell Biol. 144: 123–131, https://doi.org/10.1007/s00418-015-1340-4.Search in Google Scholar PubMed
Büttner, M., Lagerholm, C.B., Waithe, D., Galiani, S., Schliebs, W., Erdmann, R., Eggeling, C., and Reglinski, K. (2021). Challenges of using expansion microscopy for super-resolved imaging of cellular organelles. Chembiochem 22: 686–693, https://doi.org/10.1002/cbic.202000571.Search in Google Scholar PubMed PubMed Central
Cahoon, C.K., Yu, Z., Wang, Y., Guo, F., Unruh, J.R., Slaughter, B.D., and Hawley, R.S. (2017). Superresolution expansion microscopy reveals the three-dimensional organization of the Drosophila synaptosomal complex. Proc. Natl. Acad. Sci. U.S.A. 114: E6857–E6866, https://doi.org/10.1073/pnas.1705623114.Search in Google Scholar PubMed PubMed Central
Castro, I.G., Richards, D.M., Metz, J., Costello, J.L., Passmore, J.B., Schrader, T.A., Gouveia, A., Ribeiro, D., and Schrader, M. (2018). A role for Mitochondrial Rho GTPase 1 (MIRO1) in motility and membrane dynamics of peroxisomes. Traffic 19: 229–242, https://doi.org/10.1111/tra.12549.Search in Google Scholar PubMed PubMed Central
Chang, J.B., Chen, F., Yoon, Y.G., Jung, E.E., Babcock, H., Kang, J.S., Asano, S., Suk, H.J., Pak, N., Tillberg, P.W., et al.. (2017). Iterative expansion microscopy. Nat. Methods 14: 593–599, https://doi.org/10.1038/nmeth.4261.Search in Google Scholar PubMed PubMed Central
Chen, B.C., Legant, W.R., Wang, K., Shao, L., Milkie, D.E., Davidson, M.W., Janetopoulos, C., Wu, X.S., Hammer, J.A.3rd, Liu, Z., et al.. (2014). Lattice light-sheet microscopy: imaging molecules to embryos at high spatiotemporal resolution. Science 346: 1257998, https://doi.org/10.1126/science.1257998.Search in Google Scholar PubMed PubMed Central
Chen, F., Tillberg, P.W., and Boyden, E.S. (2015). Optical imaging. Expansion microscopy. Science 347: 543–548, https://doi.org/10.1126/science.1260088.Search in Google Scholar PubMed PubMed Central
Denk, W., Strickler, J.H., and Webb, W.W. (1990). Two-photon laser scanning fluorescence microscopy. Science 248: 73–76, https://doi.org/10.1126/science.2321027.Search in Google Scholar PubMed
Donnert, G., Keller, J., Medda, R., Andrei, M.A., Rizzoli, S.O., Lührmann, R., Jahn, R., Eggeling, C., and Hell, S.W. (2006). Macromolecular-scale resolution in biological fluorescence microscopy. Proc. Natl. Acad. Sci. U.S.A. 103: 11440–11445, https://doi.org/10.1073/pnas.0604965103.Search in Google Scholar PubMed PubMed Central
Dreier, J., Castello, M., Coceano, G., Cáceres, R., Plastino, J., Vicidomini, G., and Testa, I. (2019). Smart scanning for low-illumination and fast RESOLFT nanoscopy in vivo. Nat. Commun. 10: 556, https://doi.org/10.1038/s41467-019-08442-4.Search in Google Scholar PubMed PubMed Central
Eggeling, C., Widengren, J., Rigler, R., and Seidel, C.A. (1998). Photobleaching of fluorescent dyes under conditions used for single-molecule detection: evidence of two-step photolysis. Anal. Chem. 70: 2651–2659, https://doi.org/10.1021/ac980027p.Search in Google Scholar PubMed
Eggeling, C., Willig, K.I., Sahl, S.J., and Hell, S.W. (2015). Lens-based fluorescence nanoscopy. Q. Rev. Biophys. 48: 178–243, https://doi.org/10.1017/s0033583514000146.Search in Google Scholar PubMed
Ehmann, N., van de Linde, S., Alon, A., Ljaschenko, D., Keung, X.Z., Holm, T., Rings, A., DiAntonio, A., Hallermann, S., Ashery, U., et al.. (2014). Quantitative super-resolution imaging of Bruchpilot distinguishes active zone states. Nat. Commun. 5: 4650, https://doi.org/10.1038/ncomms5650.Search in Google Scholar PubMed PubMed Central
Enderlein, J., Toprak, E., and Selvin, P.R. (2006). Polarization effect on position accuracy of fluorophore localization. Opt. Express 14: 8111–8120, https://doi.org/10.1364/oe.14.008111.Search in Google Scholar PubMed
Engelhardt, J., Keller, J., Hoyer, P., Reuss, M., Staudt, T., and Hell, S.W. (2011). Molecular orientation affects localization accuracy in superresolution far-field fluorescence microscopy. Nano Lett. 11: 209–213, https://doi.org/10.1021/nl103472b.Search in Google Scholar PubMed
Fölling, J., Bossi, M., Bock, H., Medda, R., Wurm, C.A., Hein, B., Jakobs, S., Eggeling, C., and Hell, S.W. (2008). Fluorescence nanoscopy by ground-state depletion and single-molecule return. Nat. Methods 5: 943–945, https://doi.org/10.1038/nmeth.1257.Search in Google Scholar PubMed
Frohn, J.T., Knapp, H.F., and Stemmer, A. (2000). True optical resolution beyond the Rayleigh limit achieved by standing wave illumination. Proc. Natl. Acad. Sci. U.S.A. 97: 7232–7236.10.1073/pnas.130181797Search in Google Scholar PubMed PubMed Central
Galiani, S., Reglinski, K., Carravilla, P., Barbotin, A., Urbančič, I., Ott, J., Sehr, J., Sezgin, E., Schneider, F., Waithe, D., et al.. (2022). Diffusion and interaction dynamics of the cytosolic peroxisomal import receptor PEX5. Biophys Rep 2: 100055, https://doi.org/10.1016/j.bpr.2022.100055.Search in Google Scholar PubMed PubMed Central
Galiani, S., Waithe, D., Reglinski, K., Cruz-Zaragoza, L.D., Garcia, E., Clausen, M.P., Schliebs, W., Erdmann, R., and Eggeling, C. (2016). Super-resolution microscopy reveals compartmentalization of peroxisomal membrane proteins. J. Biol. Chem. 291: 16948–16962, https://doi.org/10.1074/jbc.m116.734038.Search in Google Scholar PubMed PubMed Central
Gao, M., Maraspini, R., Beutel, O., Zehtabian, A., Eickholt, B., Honigmann, A., and Ewers, H. (2018). Expansion stimulated emission depletion microscopy (ExSTED). ACS Nano 12: 4178–4185, https://doi.org/10.1021/acsnano.8b00776.Search in Google Scholar PubMed
Grotjohann, T., Testa, I., Leutenegger, M., Bock, H., Urban, N.T., Lavoie-Cardinal, F., Willig, K.I., Eggeling, C., Jakobs, S., and Hell, S.W. (2011). Diffraction-unlimited all-optical imaging and writing with a photochromic GFP. Nature 478: 204–208, https://doi.org/10.1038/nature10497.Search in Google Scholar PubMed
Guo, Y., Li, D., Zhang, S., Yang, Y., Liu, J.-J., Wang, X., Liu, C., Milkie, D.E., Moore, R.P., Tulu, U.S., et al.. (2018). Visualizing intracellular organelle and cytoskeletal interactions at nanoscale resolution on millisecond timescales. Cell 175: 1430–1442.e17, https://doi.org/10.1016/j.cell.2018.09.057.Search in Google Scholar PubMed
Gustafsson, M.G.L. (2000). Surpassing the lateral resolution limit by a factor of two using structured illumination microscopy. J. Microsc. 198: 82–87.10.1046/j.1365-2818.2000.00710.xSearch in Google Scholar PubMed
Gustafsson, N., Culley, S., Ashdown, G., Owen, D.M., Pereira, P.M., and Henriques, R. (2016). Fast live-cell conventional fluorophore nanoscopy with ImageJ through super-resolution radial fluctuations. Nat. Commun. 7: 12471, https://doi.org/10.1038/ncomms12471.Search in Google Scholar PubMed PubMed Central
Gustafsson, M.G.L., Shao, L., Carlton, P.M., Wang, C.J.R., Golubovskaya, I.N., Cande, W.Z., Agard, D.A., and Sedat, J.W. (2008). Three-dimensional resolution doubling in wide-field fluorescence microscopy by structured illumination. Biophys. J. 94: 4957–4970.10.1529/biophysj.107.120345Search in Google Scholar PubMed PubMed Central
Heilemann, M., van de Linde, S., Schüttpelz, M., Kasper, R., Seefeldt, B., Mukherjee, A., Tinnefeld, P., and Sauer, M. (2008). Subdiffraction-resolution fluorescence imaging with conventional fluorescent probes. Angew. Chem. Int. Ed. 47: 6172–6176, https://doi.org/10.1002/anie.200802376.Search in Google Scholar PubMed
Heine, J., Reuss, M., Harke, B., D’Este, E., Sahl, S.J., and Hell, S.W. (2017). Adaptive-illumination STED nanoscopy. Proc. Natl. Acad. Sci. U.S.A. 114: 9797–9802, https://doi.org/10.1073/pnas.1708304114.Search in Google Scholar PubMed PubMed Central
Heintzmann, R. and Huser, T. (2017). Super-resolution structured illumination microscopy. Chem. Rev. 117: 13890–13908, https://doi.org/10.1021/acs.chemrev.7b00218.Search in Google Scholar PubMed
Hell, S.W. (2003). Toward fluorescence nanoscopy. Nat. Biotechnol. 21: 1347–1355, https://doi.org/10.1038/nbt895.Search in Google Scholar PubMed
Hell, S.W. (2004). Strategy for far-field optical imaging and writing without diffraction limit. Phys. Lett. A. 326: 140–145.10.1016/j.physleta.2004.03.082Search in Google Scholar
Hell, S.W. (2007). Far-field optical nanoscopy. Science 316: 1153–1158, https://doi.org/10.1126/science.1137395.Search in Google Scholar PubMed
Hell, S.W., Sahl, S.J., Bates, M., Zhuang, X., Heintzmann, R., Booth, M.J., Bewersdorf, J., Shtengel, G., Hess, H., Tinnefeld, P., et al.. (2015). The 2015 super-resolution microscopy roadmap. J. Phys. D Appl. Phys. 48: 443001, https://doi.org/10.1088/0022-3727/48/44/443001.Search in Google Scholar
Helmerich, D.A., Beliu, G., Taban, D., Meub, M., Streit, M., Kuhlemann, A., Doose, S., and Sauer, M. (2022). Photoswitching fingerprint analysis bypasses the 10-nm resolution barrier. Nat. Methods 19: 986–994, https://doi.org/10.1038/s41592-022-01548-6.Search in Google Scholar PubMed PubMed Central
Hoebe, R.A., Van Oven, C.H., Gadella, T.W.J., Dhonukshe, P.B., Van Noorden, C.J.F., and Manders, E.M.M. (2007). Controlled light-exposure microscopy reduces photobleaching and phototoxicity in fluorescence live-cell imaging. Nat. Biotechnol. 25: 249–253, https://doi.org/10.1038/nbt1278.Search in Google Scholar PubMed
Hoffman, D.P., Shtengel, G., Xu, C.S., Campbell, K.R., Freeman, M., Wang, L., Milkie, D.E., Pasolli, H.A., Iyer, N., Bogovic, J.A., et al.. (2020). Correlative three-dimensional super-resolution and block-face electron microscopy of whole vitreously frozen cells. Science 367: eaaz5357, https://doi.org/10.1126/science.aaz5357.Search in Google Scholar PubMed PubMed Central
Hofmann, M., Eggeling, C., Jakobs, S., and Hell, S.W. (2005). Breaking the diffraction barrier in fluorescence microscopy at low light intensities by using reversibly photoswitchable proteins. Proc. Natl. Acad. Sci. U.S.A. 102: 17565–17569, https://doi.org/10.1073/pnas.0506010102.Search in Google Scholar PubMed PubMed Central
Ishitsuka, Y., Nienhaus, K., and Nienhaus, G.U. (2014). Photoactivatable fluorescent proteins for super-resolution microscopy. Methods Mol. Biol. 1148: 239–260, https://doi.org/10.1007/978-1-4939-0470-9_16.Search in Google Scholar PubMed
Islinger, M., Grille, S., Fahimi, H.D., and Schrader, M. (2012). The peroxisome: an update on mysteries. Histochem. Cell Biol. 137: 547–574, https://doi.org/10.1007/s00418-012-0941-4.Search in Google Scholar PubMed
Jahr, W., Velicky, P., and Danzl, J.G. (2020). Strategies to maximize performance in stimulated emission depletion (STED) nanoscopy of biological specimens. Methods 174: 27–41, https://doi.org/10.1016/j.ymeth.2019.07.019.Search in Google Scholar PubMed PubMed Central
Jose-Angel, C. and James, G.M. (1996). Fast regularization technique for expectation maximization algorithm for optical sectioning microscopy. Proc. SPIE 2655: 199–208.10.1117/12.237477Search in Google Scholar
Jungmann, R., Avendaño, M.S., Dai, M., Woehrstein, J.B., Agasti, S.S., Feiger, Z., Rodal, A., and Yin, P. (2016). Quantitative super-resolution imaging with qPAINT. Nat. Methods 13: 439–442, https://doi.org/10.1038/nmeth.3804.Search in Google Scholar PubMed PubMed Central
Keller, P.J., Schmidt, A.D., Wittbrodt, J., and Stelzer, E.H.K. (2008). Reconstruction of zebrafish early embryonic development by scanned light sheet microscopy. Science 322: 1065–1069, https://doi.org/10.1126/science.1162493.Search in Google Scholar PubMed
Kilian, N., Goryaynov, A., Lessard, M.D., Hooker, G., Toomre, D., Rothman, J.E., and Bewersdorf, J. (2018). Assessing photodamage in live-cell STED microscopy. Nat. Methods 15: 755–756, https://doi.org/10.1038/s41592-018-0145-5.Search in Google Scholar PubMed PubMed Central
King, C., Sengupta, P., Seo, A.Y., and Lippincott-Schwartz, J. (2020). ER membranes exhibit phase behavior at sites of organelle contact. Proc. Natl. Acad. Sci. U.S.A. 117: 7225–7235, https://doi.org/10.1073/pnas.1910854117.Search in Google Scholar PubMed PubMed Central
Kunau, W.-H. (2006). Peroxisomes: morphology, function, biogenesis and disorders. Biochim. Biophys. Acta Mol. Cell Res. 1763: 1363–1808.10.1016/j.bbamcr.2006.09.021Search in Google Scholar
Lelek, M., Gyparaki, M.T., Beliu, G., Schueder, F., Griffié, J., Manley, S., Jungmann, R., Sauer, M., Lakadamyali, M., and Zimmer, C. (2021). Single-molecule localization microscopy. Nat. Rev. Methods Primers 1: 39, https://doi.org/10.1038/s43586-021-00038-x.Search in Google Scholar PubMed PubMed Central
Lukosz, W. (1966). Optical systems with resolving powers exceeding the classical limit. J. Opt. Soc. Am. 56: 1463–1471, https://doi.org/10.1364/josa.56.001463.Search in Google Scholar
Magde, D., Elson, E.L., and Webb, W.W. (1974). Fluorescence correlation spectroscopy. II. An experimental realization. Biopolymers 13: 29–61, https://doi.org/10.1002/bip.1974.360130103.Search in Google Scholar PubMed
Manley, S., Gillette, J.M., Patterson, G.H., Shroff, H., Hess, H.F., Betzig, E., and Lippincott-Schwartz, J. (2008). High-density mapping of single-molecule trajectories with photoactivated localization microscopy. Nat. Methods 5: 155–157, https://doi.org/10.1038/nmeth.1176.Search in Google Scholar PubMed
Marsh, R.J., Pfisterer, K., Bennett, P., Hirvonen, L.M., Gautel, M., Jones, G.E., and Cox, S. (2018). Artifact-free high-density localization microscopy analysis. Nat. Methods 15: 689–692, https://doi.org/10.1038/s41592-018-0072-5.Search in Google Scholar PubMed
Masullo, L.A., Bodén, A., Pennacchietti, F., Coceano, G., Ratz, M., and Testa, I. (2018). Enhanced photon collection enables four dimensional fluorescence nanoscopy of living systems. Nat. Commun. 9: 3281, https://doi.org/10.1038/s41467-018-05799-w.Search in Google Scholar PubMed PubMed Central
Masullo, L.A., Steiner, F., Zähringer, J., Lopez, L.F., Bohlen, J., Richter, L., Cole, F., Tinnefeld, P., and Stefani, F.D. (2020). Pulsed interleaved MINFLUX. Nano Lett. 21: 840–846, https://doi.org/10.1021/acs.nanolett.0c04600.Search in Google Scholar PubMed
Meinecke, M., Cizmowski, C., Schliebs, W., Krüger, V., Beck, S., Wagner, R., and Erdmann, R. (2010). The peroxisomal importomer constitutes a large and highly dynamic pore. Nat. Cell Biol. 12: 273–277, https://doi.org/10.1038/ncb2027.Search in Google Scholar PubMed
Minsky, M. (1961). Microscopy apparatus US Patent. in.Search in Google Scholar
Müller, C.B. and Enderlein, J. (2010). Image scanning microscopy. Phys. Rev. Lett. 104: 198101, https://doi.org/10.1103/physrevlett.104.198101.Search in Google Scholar
Muyldermans, S. (2013). Nanobodies: natural single-domain antibodies. Annu. Rev. Biochem. 82: 775–797, https://doi.org/10.1146/annurev-biochem-063011-092449.Search in Google Scholar PubMed
Nagotu, S., Kalel, V.C., Erdmann, R., and Platta, H.W. (2012). Molecular basis of peroxisomal biogenesis disorders caused by defects in peroxisomal matrix protein import. Biochim. Biophys. Acta 1822: 1326–1336, https://doi.org/10.1016/j.bbadis.2012.05.010.Search in Google Scholar PubMed
Neufeld, C., Filipp, F.V., Simon, B., Neuhaus, A., Schuller, N., David, C., Kooshapur, H., Madl, T., Erdmann, R., Schliebs, W., et al.. (2009). Structural basis for competitive interactions of Pex14 with the import receptors Pex5 and Pex19. EMBO J. 28: 745–754, https://doi.org/10.1038/emboj.2009.7.Search in Google Scholar PubMed PubMed Central
Nikić, I., Kang, J.H., Girona, G.E., Aramburu, I.V., and Lemke, E.A. (2015). Labeling proteins on live mammalian cells using click chemistry. Nat. Protoc. 10: 780–791, https://doi.org/10.1038/nprot.2015.045.Search in Google Scholar PubMed
Oleksiievets, N., Sargsyan, Y., Thiele, J.C., Mougios, N., Sograte-Idrissi, S., Nevskyi, O., Gregor, I., Opazo, F., Thoms, S., Enderlein, J., et al.. (2022). Fluorescence lifetime DNA-PAINT for multiplexed super-resolution imaging of cells. Commun Biol. 5: 38, https://doi.org/10.1038/s42003-021-02976-4.Search in Google Scholar PubMed PubMed Central
Oleksiievets, N., Thiele, J.C., Weber, A., Gregor, I., Nevskyi, O., Isbaner, S., Tsukanov, R., and Enderlein, J. (2020). Wide-field fluorescence lifetime imaging of single molecules. J. Phys. Chem. A 5, https://doi.org/10.1021/acs.jpca.0c01513.Search in Google Scholar PubMed
Pape, J.K., Stephan, T., Balzarotti, F., Büchner, R., Lange, F., Riedel, D., Jakobs, S., and Hell, S.W. (2020). Multicolor 3D MINFLUX nanoscopy of mitochondrial MICOS proteins. Proc. Natl. Acad. Sci. U.S.A. 117: 20607–20614, https://doi.org/10.1073/pnas.2009364117.Search in Google Scholar PubMed PubMed Central
Park, H., Na, M., Kim, B., Park, S., Kim, K.H., Chang, S., and Ye, J.C. (2022). Deep learning enables reference-free isotropic super-resolution for volumetric fluorescence microscopy. Nat. Commun. 13: 3297, https://doi.org/10.1038/s41467-022-30949-6.Search in Google Scholar PubMed PubMed Central
Pawley, J.B. (2006). Handbook of biological confocal microscopy. Springer, New York, USA.10.1007/978-0-387-45524-2Search in Google Scholar
Peng, T. and Hang, H.C. (2016). Site-specific bioorthogonal labeling for fluorescence imaging of intracellular proteins in living cells. J. Am. Chem. Soc. 138: 14423–14433, https://doi.org/10.1021/jacs.6b08733.Search in Google Scholar PubMed PubMed Central
Prakash, K. (2022). At the molecular resolution with MINFLUX? Philos. Trans. R. Soc. A Math Phys. Eng. Sci. 380: 20200145, https://doi.org/10.1098/rsta.2020.0145.Search in Google Scholar PubMed PubMed Central
Prakash, K. and Curd, A.P. (2022). Assessment of 3D MINFLUX data for quantitative structural biology in cells. Nat. Methods 20: 48–51, https://doi.org/10.1038/s41592-022-01694-x.Search in Google Scholar PubMed
Ravindran, R., Bacellar, I.O.L., Castellanos-Girouard, X., Zhang, Z., Kisley, L., and Michnick, S.W. (2022). Peroxisome biogenesis initiated by protein phase separation. bioRxiv.10.1101/2022.09.20.508718Search in Google Scholar
Reuter, M., Kooshapur, H., Suda, J.G., Gaussmann, S., Neuhaus, A., Brühl, L., Bharti, P., Jung, M., Schliebs, W., Sattler, M., et al.. (2021). Competitive microtubule binding of PEX14 coordinates peroxisomal protein import and motility. J. Mol. Biol. 433: 166765, https://doi.org/10.1016/j.jmb.2020.166765.Search in Google Scholar PubMed
Ries, J., Kaplan, C., Platonova, E., Eghlidi, H., and Ewers, H. (2012). A simple, versatile method for GFP-based super-resolution microscopy via nanobodies. Nat. Methods 9: 582–584, https://doi.org/10.1038/nmeth.1991.Search in Google Scholar PubMed
Rust, M.J., Bates, M., and Zhuang, X. (2006). Sub-diffraction-limit imaging by stochastic optical reconstruction microscopy (STORM). Nat. Methods 3: 793–795, https://doi.org/10.1038/nmeth929.Search in Google Scholar PubMed PubMed Central
Sahl, S.J., Hell, S.W., and Jakobs, S. (2017). Fluorescence nanoscopy in cell biology. Nat. Rev. Mol. Cell Biol. 18: 685–701, https://doi.org/10.1038/nrm.2017.71.Search in Google Scholar PubMed
Schermelleh, L., Carlton, P.M., Haase, S., Shao, L., Winoto, L., Kner, P., Burke, B., Cardoso, M.C., Agard, D.A., Gustafsson, M.G.L., et al.. (2008). Subdiffraction multicolor imaging of the nuclear periphery with 3D structured illumination microscopy. Science 320: 1332–1336.10.1126/science.1156947Search in Google Scholar PubMed PubMed Central
Schermelleh, L., Ferrand, A., Huser, T., Eggeling, C., Sauer, M., Biehlmaier, O., and Drummen, G.P.C. (2019). Super-resolution microscopy demystified. Nat. Cell Biol. 21: 72–84, https://doi.org/10.1038/s41556-018-0251-8.Search in Google Scholar PubMed
Schmidt, R., Weihs, T., Wurm, C.A., Jansen, I., Rehman, J., Sahl, S.J., and Hell, S.W. (2021). MINFLUX nanometer-scale 3D imaging and microsecond-range tracking on a common fluorescence microscope. Nat. Commun. 12: 1478, https://doi.org/10.1038/s41467-021-21652-z.Search in Google Scholar PubMed PubMed Central
Schollenberger, L., Gronemeyer, T., Huber, C.M., Lay, D., Wiese, S., Meyer, H.E., Warscheid, B., Saffrich, R., Peranen, J., Gorgas, K., et al.. (2010). RhoA regulates peroxisome association to microtubules and the actin cytoskeleton. PLoS One 5: e13886, https://doi.org/10.1371/journal.pone.0013886.Search in Google Scholar PubMed PubMed Central
Schönle, A., Hänninen, P.E., and Hell, S.W. (1999). Nonlinear fluorescence through intermolecular energy transfer and resolution increase in fluorescence microscopy. Ann. Phys. 8: 115–133.10.1002/andp.19995110201Search in Google Scholar
Sezgin, E., Schneider, F., Galiani, S., Urbančič, I., Waithe, D., Lagerholm, B.C., and Eggeling, C. (2019). Measuring nanoscale diffusion dynamics in cellular membranes with super-resolution STED–FCS. Nat. Protoc. 14: 1054–1083, https://doi.org/10.1038/s41596-019-0127-9.Search in Google Scholar PubMed
Shaib, A.H., Chouaib, A.A., Imani, V., Chowdhury, R., Georgiev, S.V., Mougios, N., Monga, M., Reshetniak, S., Mihaylov, D., Chen, H., et al.. (2022). Expansion microscopy at one nanometer resolution. bioRxiv.Search in Google Scholar
Sharonov, A. and Hochstrasser, R.M. (2006). Wide-field subdiffraction imaging by accumulated binding of diffusing probes. Proc. Natl. Acad. Sci. U.S.A. 103: 18911–18916, https://doi.org/10.1073/pnas.0609643104.Search in Google Scholar PubMed PubMed Central
Sheppard, C.J.R. (1985). Theory and practice of scanning optical microscopy - theory and practice of scanning optical microscopy. MRS Bull. 10: 2.10.1016/0160-9327(86)90045-1Search in Google Scholar
Sheppard, C.J.R. and Kompfner, R. (1978). Resonant scanning optical microscope. Appl. Opt. 17: 2879–2882, https://doi.org/10.1364/ao.17.002879.Search in Google Scholar
Shroff, H., Galbraith, C.G., Galbraith, J.A., and Betzig, E. (2008). Live-cell photoactivated localization microscopy of nanoscale adhesion dynamics. Nat. Methods 5: 417–423, https://doi.org/10.1038/nmeth.1202.Search in Google Scholar PubMed PubMed Central
Skowyra, M.L. and Rapoport, T.A. (2022). PEX5 translocation into and out of peroxisomes drives matrix protein import. Mol. Cell 82: 3209–3225.e7, https://doi.org/10.1016/j.molcel.2022.07.004.Search in Google Scholar PubMed PubMed Central
Small, A.R. (2009). Theoretical limits on errors and acquisition rates in localizing switchable fluorophores. Biophys. J. 96: L16–L18, https://doi.org/10.1016/j.bpj.2008.11.001.Search in Google Scholar PubMed PubMed Central
Smith, J.J. and Aitchison, J.D. (2013). Peroxisomes take shape. Nat. Rev. Mol. Cell Biol. 14: 803–817, https://doi.org/10.1038/nrm3700.Search in Google Scholar PubMed PubMed Central
Soliman, K., Göttfert, F., Rosewich, H., Thoms, S., and Gärtner, J. (2018). Super-resolution imaging reveals the sub-diffraction phenotype of Zellweger Syndrome ghosts and wild-type peroxisomes. Sci. Rep. 8: 7809, https://doi.org/10.1038/s41598-018-24119-2.Search in Google Scholar PubMed PubMed Central
Staudt, T., Engler, A., Rittweger, E., Harke, B., Engelhardt, J., and Hell, S.W. (2011). Far-field optical nanoscopy with reduced number of state transition cycles. Opt. Express 19: 5644–5657, https://doi.org/10.1364/oe.19.005644.Search in Google Scholar
Strauss, S., Nickels, P.C., Strauss, M.T., Jimenez Sabinina, V., Ellenberg, J., Carter, J.D., Gupta, S., Janjic, N., and Jungmann, R. (2018). Modified aptamers enable quantitative sub-10-nm cellular DNA-PAINT imaging. Nat. Methods 15: 685–688, https://doi.org/10.1038/s41592-018-0105-0.Search in Google Scholar PubMed PubMed Central
Thiele, J.C., Helmerich, D.A., Oleksiievets, N., Tsukanov, R., Butkevich, E., Sauer, M., Nevskyi, O., and Enderlein, J. (2020). Confocal fluorescence-lifetime single-molecule localization microscopy. ACS Nano 14: 14190–14200, https://doi.org/10.1021/acsnano.0c07322.Search in Google Scholar PubMed
Tillberg, P.W., Chen, F., Piatkevich, K.D., Zhao, Y., Yu, C.-C., English, B.P., Gao, L., Martorell, A., Suk, H.-J., Yoshida, F., et al.. (2016). Protein-retention expansion microscopy of cells and tissues labeled using standard fluorescent proteins and antibodies. Nat. Biotechnol. 34: 987–992, https://doi.org/10.1038/nbt.3625.Search in Google Scholar PubMed PubMed Central
Tokunaga, M., Imamoto, N., and Sakata-Sogawa, K. (2008). Highly inclined thin illumination enables clear single-molecule imaging in cells. Nat. Methods 5: 159–161, https://doi.org/10.1038/nmeth1171.Search in Google Scholar PubMed
Truckenbrodt, S., Maidorn, M., Crzan, D., Wildhagen, H., Kabatas, S., and Rizzoli, S.O. (2018). X10 expansion microscopy enables 25-nm resolution on conventional microscopes. EMBO Rep. 19: e45836, https://doi.org/10.15252/embr.201845836.Search in Google Scholar PubMed PubMed Central
Valm, A.M., Cohen, S., Legant, W.R., Melunis, J., Hershberg, U., Wait, E., Cohen, A.R., Davidson, M.W., Betzig, E., and Lippincott-Schwartz, J. (2017). Applying systems-level spectral imaging and analysis to reveal the organelle interactome. Nature 546: 162–167, https://doi.org/10.1038/nature22369.Search in Google Scholar PubMed PubMed Central
Wang, H., Rivenson, Y., Jin, Y., Wei, Z., Gao, R., Günaydın, H., Bentolila, L.A., Kural, C., and Ozcan, A. (2019). Deep learning enables cross-modality super-resolution in fluorescence microscopy. Nat. Methods 16: 103–110, https://doi.org/10.1038/s41592-018-0239-0.Search in Google Scholar PubMed PubMed Central
Wang, Y., Yu, Z., Cahoon, C.K., Parmely, T., Thomas, N., Unruh, J.R., Slaughter, B.D., and Hawley, R.S. (2018). Combined expansion microscopy with structured illumination microscopy for analyzing protein complexes. Nat. Protoc. 13: 1869–1895, https://doi.org/10.1038/s41596-018-0023-8.Search in Google Scholar PubMed
Wassie, A.T., Zhao, Y., and Boyden, E.S. (2019). Expansion microscopy: principles and uses in biological research. Nat. Methods 16: 33–41, https://doi.org/10.1038/s41592-018-0219-4.Search in Google Scholar PubMed PubMed Central
Weber, K., Rathke, P.C., and Osborn, M. (1978). Cytoplasmic microtubular images in glutaraldehyde-fixed tissue culture cells by electron microscopy and by immunofluorescence microscopy. Proc. Natl. Acad. Sci. U.S.A. 75: 1820–1824, https://doi.org/10.1073/pnas.75.4.1820.Search in Google Scholar PubMed PubMed Central
Wong-Dilworth, L., Rodilla-Ramirez, C., Fox, E., Restel, S.D., Stockhammer, A., Adarska, P., and Bottanelli, F. (2022). Gene editing and super-resolution microscopy reveal multiple distinct roles for ARF GTPases in cellular membrane organization. bioRxiv.10.1101/2022.05.31.494106Search in Google Scholar
York, A.G., Parekh, S.H., Dalle Nogare, D., Fischer, R.S., Temprine, K., Mione, M., Chitnis, A.B., Combs, C.A., and Shroff, H. (2012). Resolution doubling in live, multicellular organisms via multifocal structured illumination microscopy. Nat. Methods 9: 749–754, https://doi.org/10.1038/nmeth.2025.Search in Google Scholar PubMed PubMed Central
Zhang, K., Liu, X., Xu, J., Yuan, J., Cai, W., Chen, T., Wang, K., Gao, Y., Nie, S., Xu, X., et al.. (2021). Deep-learning models for the detection and incidence prediction of chronic kidney disease and type 2 diabetes from retinal fundus images. Nat. Biomed Eng. 5: 533–545, https://doi.org/10.1038/s41551-021-00745-6.Search in Google Scholar PubMed
Zwettler, F.U., Reinhard, S., Gambarotto, D., Bell, T.D.M., Hamel, V., Guichard, P., and Sauer, M. (2020a). Molecular resolution imaging by post-labeling expansion single-molecule localization microscopy (Ex-SMLM). Nat. Commun. 11: 3388, https://doi.org/10.1038/s41467-020-17086-8.Search in Google Scholar PubMed PubMed Central
Zwettler, F.U., Reinhard, S., and Sauer, M. (2021). Chapter 15 - ex-dSTORM and automated quantitative image analysis of expanded filamentous structures. In: Guichard, P. and Hamel, V. (Eds.), Methods in cell biology. Academic Press, Cambridge, MA, USA/San Diego, CA, USA/Oxford, UK/London, UK, pp. 317–340.10.1016/bs.mcb.2020.05.004Search in Google Scholar
Zwettler, F.U., Spindler, M.-C., Reinhard, S., Klein, T., Kurz, A., Benavente, R., and Sauer, M. (2020b). Tracking down the molecular architecture of the synaptosomal complex by expansion microscopy. Nat. Commun. 11: 3222, https://doi.org/10.1038/s41467-020-17017-7.Search in Google Scholar PubMed PubMed Central
© 2022 the author(s), published by De Gruyter, Berlin/Boston
This work is licensed under the Creative Commons Attribution 4.0 International License.
Articles in the same Issue
- Frontmatter
- Highlight: Structure and Function of the Peroxisomal Translocon
- Highlight: structure and function of the peroxisomal translocon
- Super-resolution microscopy and studies of peroxisomes
- Good things come to those who bait: the peroxisomal docking complex
- Determining the targeting specificity of the selective peroxisomal targeting factor Pex9
- Phosphorylation of the receptor protein Pex5p modulates import of proteins into peroxisomes
- Membrane binding and pore forming insertion of PEX5 into horizontal lipid bilayer
- Dynamics of the translocation pore of the human peroxisomal protein import machinery
- Distinct conformational and energetic features define the specific recognition of (di)aromatic peptide motifs by PEX14
- Asymmetric horseshoe-like assembly of peroxisomal yeast oxalyl-CoA synthetase
- Comparison of human PEX knockout cell lines suggests a dual role of PEX1 in peroxisome biogenesis
- Research Articles/Short Communications
- Proteolysis
- Investigation of the P1′ and P2′ sites of IQF substrates and their selectivity toward 20S proteasome subunits
- Novel Techniques
- Microwave characterization of aqueous amino acid solutions using the multifrequency WGM resonator technique
- Corrigendum
- Corrigendum to: determination of free heme in stored red blood cells with an apo-horseradish peroxidase-based assay