Qualitative and quantitative microstructural investigation of Moringa oleifera wood through X-ray computed tomography
-
 and
and


Abstract
Recent advances in high-resolution X-ray computed tomography (HRXCT) enable comprehensive qualitative and quantitative analysis of wood microstructure. This study combines micro-CT imaging with advanced segmentation to characterize Moringa oleifera L. stem anatomy. Qualitative analysis revealed distinct tissue boundaries, with grayscale images differentiating xylem vessels (bright) from parenchyma (dark) based on density. Reconstructed 3D volumes showed alternating parenchyma-fiber bands, while watershed segmentation delineated pores and Kuwahara filtering preserved structural details. Quantitative results demonstrated spatial heterogeneity: total porosity measured 22.3 ± 2.9 % versus 2.4 ± 1.9 % to 3.7 ± 0.2 % in ROIs. Pore density varied inversely (0.7 ± 0.3 to 1.4 ± 1.0 μm−3), with average pore sizes ranging 0.3 ± 0.6 to 1.9 ± 0.2 μm2. Strong correlations existed between porosity and pore diameter (r = 0.99) or % area (r = 0.95), showing morphology governs void fraction. Parameters exhibited symmetric distributions (skewness ≈ 0) with light tails (kurtosis < 3). CT resolved wall thickness variations (0–15 mm), linking microstructure to mechanical properties. The non-destructive approach provides unprecedented 3D quantification of Moringa wood’s structural adaptations, supporting applications in biomaterials and fluid transport systems.
1 Introduction
Since the invention and development of microscopes, the range of human vision has greatly increased. The application of optical instruments to study cellular and subcellular architectures has substantially expanded our comprehension of the biological domain (Ovečka et al. 2018; Rousseau et al. 2015). Many microscope manufacturing businesses are devoting a significant amount of time and money to the development of better resolution microscopy equipment. These developments are intended to help researchers in various fields get increasingly complex pictures (Dumur et al. 2019). Plants display a broad diversity of morphologies to live in varied situations. From small single-celled animals like blue-green algae (Cyanobacteria) to towering giants like the hundred-meter-tall Eucalyptus, plants are diverse in their morphology (Chen et al. 2021). Therefore, it is essential in the field of plant study to use microscopy techniques to examine cellular, subcellular, and physiological properties (Piovesan et al. 2021). A detailed description of plant anatomy at various sizes is necessary to comprehend the biological processes, development, and evolution of plants. Examining the complete organism, each of its organs, the tissues inside each organ, the cells inside those tissues, the cell walls, and the organelles inside the cells are all included (Kurei et al. 2021; Mccoy et al. 2021). Different imaging devices are employed to investigate the morphology, chemical content, and spatial organization of the objects being researched, depending on their scale (Karlen et al. 2024; Liu et al.). For instance, tools like macro photography or low-resolution CT scans may be utilized to analyze whole plants or organs. Higher resolution imaging techniques like micro-CT, confocal microscopy, or scanning electron microscopy (SEM) are used to study tissues and cells (Zhang et al. 2023). Methods like super-resolution microscopy and transmission electron microscopy (TEM) are required at the subcellular level (Dierick et al. 2014; Ziegler-Rivera et al. 2021).
Within the field of plant science, high-resolution 3D images are becoming more widely available, providing a powerful means of understanding both mechanical and biological processes (Reich et al. 2020). Interestingly, X-ray computed tomography (CT) turns out to be a very useful answer to these questions (Dierickx et al. 2024). Using the penetration powers of X-rays, this diagnostic 3D imaging method allows for non-destructive multidimensional imaging over a wide field of view and a variety of resolutions, providing both qualitative and quantitative information about the internal structural characteristics of a specimen (Dierickx et al. 2024). The attenuation of X-rays changes with sample density, thickness, atomic number, and X-ray energy as they pass through a sample. As a result, variations in X-ray attenuation provide contrast in images, making it easier to distinguish between areas of a sample with low and high densities (Walker et al. 2024). In X-ray CT, while the sample rotates, many X-ray projections are produced from various angles. Virtual slices that resemble histological sections may be retrieved and shown at any depth and orientation after reconstruction (Dierick et al. 2014; Martin and Koch 2006). Moreover, X-ray computed tomography (CT) eliminates the requirement for time-consuming sample preparation and provides remarkable spatial resolution that can resolve microstructures at submicron sizes (Hanke et al. 2016). Recently, X-ray CT has become widely used in many different fields of research to study the three-dimensional structure of plants (Ekaputri and Tanaka 2024; Stock 2008). Its usefulness in xylem embolism research, anatomical analysis, wood microstructure and its characteristics, hydraulic function testing, and the characterization and quantification of plant tissues, analysis of fibers, mineral particles, structures, vessels have all been highlighted by a number of studies (Arzola-Villegas et al. 2023; Feng 2022; Guo et al. 2020; Jiang et al. 2024).
Despite rapid advances in fluorescence-based and super-resolution microscopy, applying these optical techniques to woody tissues remains problematic. Wood is rich in lignin and cellulose – molecules that scatter and absorb light – so signal strength and spatial resolution deteriorate rapidly with imaging depth. Dumur et al. (2019) highlight this limitation even for state-of-the-art confocal and multiphoton systems, noting that thick, pigmented samples demand labor-intensive clearing or physical sectioning that can distort native architecture. Compared to optical techniques such as Optical projection tomography (OPT) and confocal microscopy, HRXCT does not require sample clearing or optical transparency. This is a crucial advantage, as wood contains abundant light-scattering compounds like lignin and cellulose, which severely limit the effectiveness of optical methods due to poor signal penetration and resolution loss at depth. Although OPT can visualize gene expression patterns using colorimetric stains and is useful for small, transparent samples, its resolution and sample requirements make it unsuitable for intact woody tissues. Confocal and multiphoton microscopy offer high subcellular resolution but are constrained to shallow imaging depths and require complex, destructive sample preparation. Moreover, these techniques are incompatible with non-fluorescent contrast agents frequently used in histological wood studies. In contrast, HRXCT achieves resolutions as fine as 30–50 nm and does so in a completely non-destructive manner, preserving the native 3D architecture of samples without the need for staining or embedding. Compared to conventional micro-CT, HRXCT significantly improves both spatial resolution and contrast, enabling detailed imaging of microanatomical structures such as vessels, fibers, tracheids, and pits in wood. Other imaging modalities like micro-RI, optical coherence tomography (OCT), and ultrasonic bio-microscopy are also less effective for wood microscopy. Micro-MRI offers soft tissue contrast but lacks the resolution needed to resolve fine cellular features in lignified tissues. OCT and ultrasound can image live tissues and penetrate deeper than light-based methods, but their resolution is too low to capture detailed wood anatomy, and they cannot detect key anatomical or molecular markers.
In this study, Moringa oleifera was selected as the study material due to its unique combination of anatomical and physiological features, as well as its ecological and industrial significance. M. oleifera is recognized for its distinctive stem microstructure, which includes clearly defined tissue boundaries and a high degree of spatial heterogeneity in porosity and cell arrangement. These features make it an ideal candidate for methodological development and validation in advanced imaging techniques such as X-ray micro-computed tomography (micro-CT), as they allow for clear visualization and quantification of anatomical parameters. Additionally, Moringa is widely cultivated and easily accessible in many regions, facilitating sample collection and ensuring practical research feasibility. Its ecological and industrial significance – ranging from medicinal uses to environmental applications – further supports its selection as a model organism for plant microstructural studies. HR-XCT was employed for cellular-resolution visualization of plant structures, focusing on M. oleifera wood anatomy using CT-derived 3D images to identify interconnectivity and unique features.
2 Materials and methods
2.1 Plant material
Mature trees of M. oleifera were taken from local Moringa farm, a 1,260-ha large-scale agricultural green area that spreads roughly in the center of Saitama City, within a 20–30 km radius of the Tokyo metropolitan area. The fresh plants were kept in plastic bags and were dried at 105 °C for 7 days. To accommodate natural variability, M. oleifera stems were carefully prepared for X-ray micro-CT imaging.
2.2 X-ray computed microtomography (X-ray micro CT)
The internal architecture of Moringa stem samples was investigated using high-resolution X-ray microcomputed tomography (μCT) performed with the inspeXio SMX-225CT FPD HR Plus system at Shimadzu’s Non-Destructive Testing facility in Kawasaki (https://www.shimadzu.com) as shown in Figure 1. This advanced imaging platform features a high-performance microfocus X-ray CT system equipped with a Shimadzu microfocus X-ray generator and a large high-resolution flat panel detector and a computer with tomographic reconstruction software (Volume Graphics VGStudio Max 3.4 software; Volume Graphics, Heidelberg, Germany) that enabled detailed 3D visualization of Moringa internal structures. The system uses a high-power microfocus or nanofocus X-ray tube, capable of operating at voltages ranging from 30 kV to 225 kV, depending on the sample’s density and required penetration. Electrons are accelerated toward a metal target (typically tungsten). A CsI(Tl) scintillator was used due to its high light yield and compatibility with the system’s resolution requirements. This material converts X-rays efficiently into visible light, minimizing noise. Cesium iodide (CsI), which has excellent sensitivity characteristics, was employed as the scintillator material. A CsI(Tl) scintillator and 0.5 mm Al filter enhanced detection efficiency and reduced low-energy noise. The use of carbon (C) for detector window material enables imaging on low-density materials. The sample–source distance and camera–source distance were 40 mm and 300 mm, respectively.
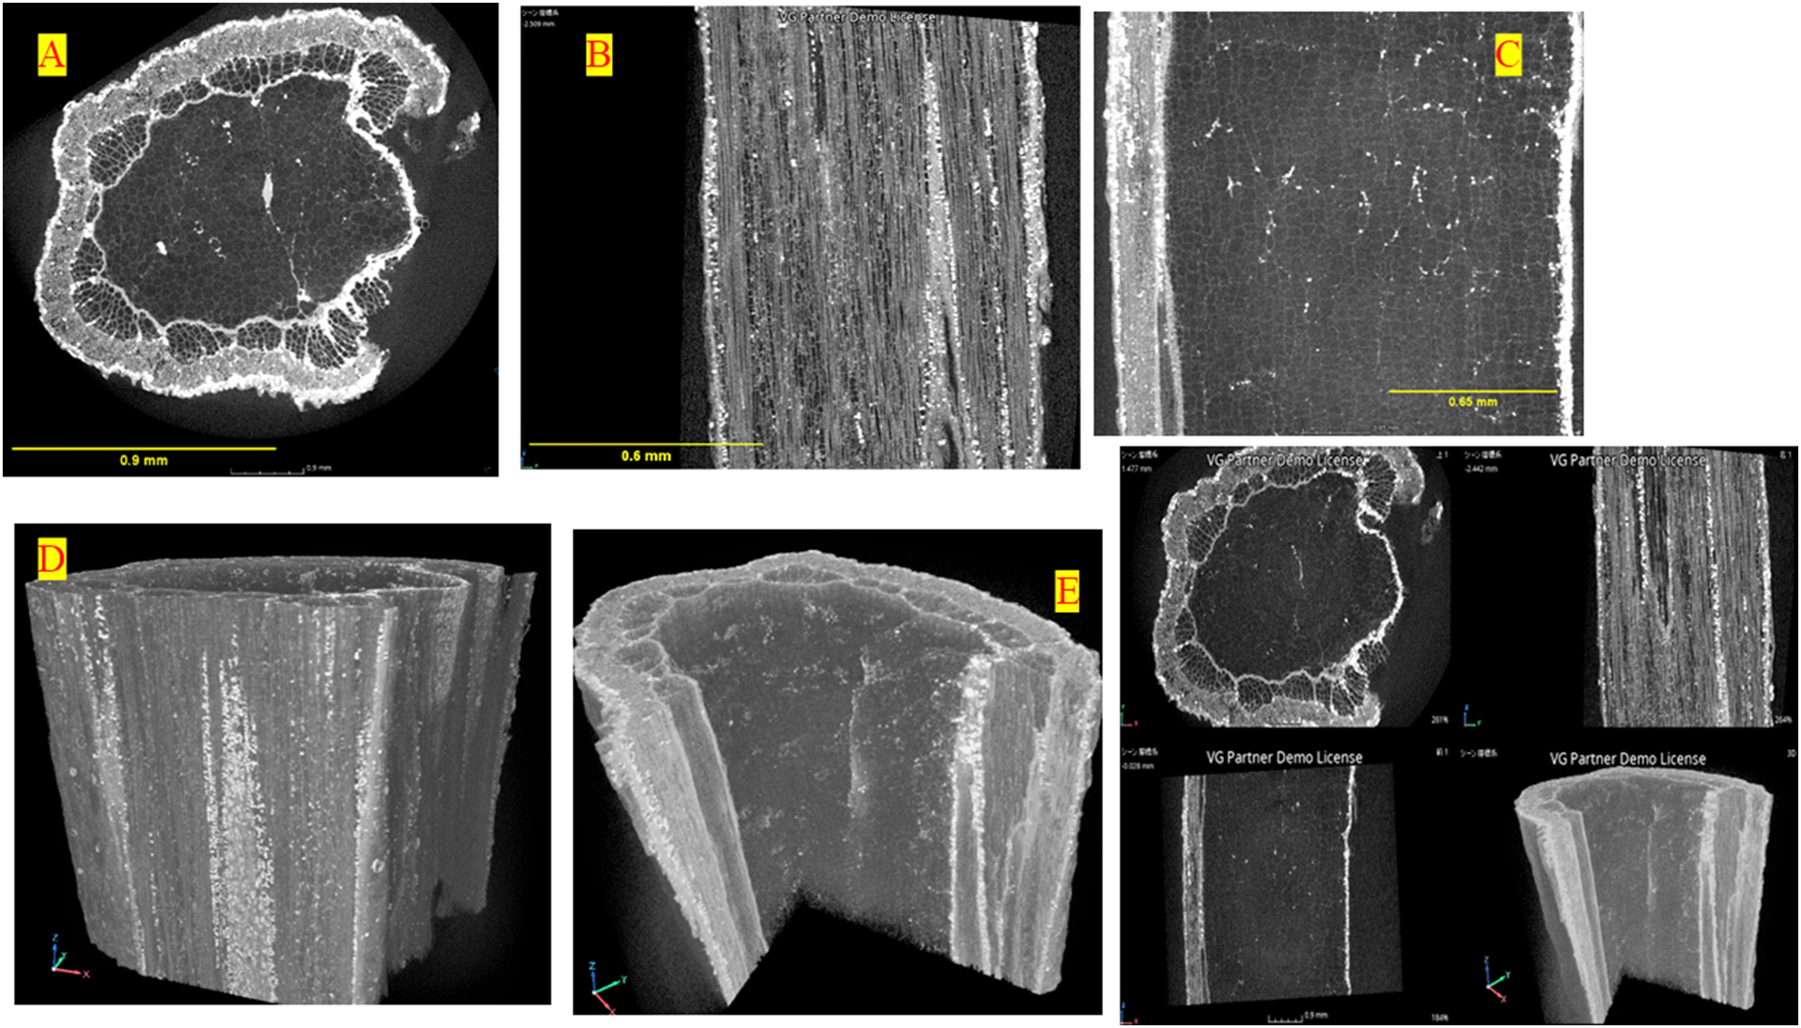
The stem’s microstructure image of the Moringa sample obtained by X-ray micro-CT: (a–c) 2D initial images of Moringa slice, (d, e) 3D initial images of Moringa slice, (f) multi-planar reconstruction images. Scale bars: (a) 0.9 mm, (b) 0.6 mm, (c) 0.65 mm.
For woody species, excised and dried samples are the simplest to scan and yield good-quality images. X-ray μCT was used to non-destructively explore stem sections to determine the internal structure of Moringa without any special treatment before scanning. Image acquisition required no sample preparation, besides sample mounting. Thus, to ensure stability and minimize motion artifacts, the Moringa stem samples were securely mounted in thin-walled PVC cylinders. This rigid support prevented vibrations and sample displacement during scanning, maintaining precise alignment with the X-ray beam and eliminating potential image distortion while preserving the internal structure throughout the micro-CT imaging process. The sample was scanned using a 40 kV X-ray beam with a 500 nm voxel size, capturing 729 radiographs at 0.225° angular steps and a 6-s exposure per shot. A 40 kV setting was chosen for optimal imaging of Moringa stems, as it maximizes contrast of boundaries of cell wall while minimizing beam hardening. This voltage enhances differentiation of xylem vessels and parenchyma without compromising resolution or causing excessive radiation exposure.
2.3 Image analysis and segmentation
Image processing and analysis involved image reconstruction, characterization, and quantification. System-supplied reconstruction software (VGSTUDIO) was used to reconstruct the 2D projection images into 3D volumes. A total of 729 virtual slices were acquired to capture the internal structure of the Moringa stem. The X-ray images were processed using gray-scale thresholding to enhance structural clarity. Reconstruction of the projection images into 3D volumes was performed using Shimadzu’s VGL software. Initially, all radiographic images were imported, and scanning parameters were configured, including a 360° rotation with 0.514° angular increments and a pixel size of 3.4 μm. Geometric calibration was conducted based on the measured source-to-sample distance (51 mm) and source-to-detector distance (281 mm). Image quality was further improved through beam hardening and ring artifact corrections. The volumetric reconstruction was carried out using the Feldkamp–Davis–Kress (FDK) algorithm with a Parzen filter, resulting in isotropic voxel resolution. The final 3D dataset was cropped up to isolate the stem region and exported as a 16-bit TIFF image stack. Adaptive Gauss filtering was applied to remove noise and to allow better determination of the boundaries between cells.
The images were processed using the open-source software ImageJ and Fiji. These tools provided advanced features for analyzing and visualizing the data effectively. After preparation, the stem segments were scanned as shown in Figure 2. The greyscale images were filtered and then further processed to identify structures in the stems (Ahmed et al. 2016; Duncan et al. 2021). Kuwahara filtering was applied for adaptive noise reduction to improve image quality and remove noise (Chinga-Carrasco 2002). Segmentation is a technique used in image processing to simplify or change the representation of an image, making it more meaningful and easier to analyze. In this context, segmentation involves converting a grey-scale image, which contains varying shades of grey, into a black and white image. Then, segmentation was operated using a threshold tool to create a mask specifically selecting the voids from the matrix (Gerth et al. 2021). A global thresholding followed by a gray morphology filter (available in Image Pro software) was used to extract the vessel elements (Mendoza et al. 2007).

2D volume renderings showing vessel relay connecting large-diameter vessels. The reconstructed projection shows the cross-section of the Moringa. The white circles represent the cell walls: (a) original and (b) filtered μ X-ray image; (c) classification of stem parts in a binary cross-section image; (d, e) distribution of grayscale intensities corresponding to different densities (e.g., voids vs. solid tissue); (f) the cellular matrix is separated in individual objects by the watershed separation; (g) image after applying Kuwahara filtering. Scale bars: (a) 0.75 mm, (b) 0.9 mm, (c) 0.9 mm and 0.65 mm, (f, g) 0.9 mm.
In order to obtain statistical data and reduce processing time, five representative areas of 1,254 pixels × 861 pixels (71.3 × 74.0 μm) were selected for geometric measurement. These regions (ROI 1, ROI 2, ROI 3, ROI 4, and ROI 5) were chosen and shown in Figure 3b. Five regions of interest (ROIs) were selectively chosen from the M. oleifera stem cross-section to capture localized microstructural variations and reduce processing time. These ROIs represent areas with distinct anatomical features, such as differences in pore distribution, tissue density, and cellular organization. By focusing on these representative zones, the analysis could reveal spatial heterogeneity that might be masked in whole-slice measurements. This approach allowed for detailed quantification of porosity, pore size, and density, providing a deeper understanding of the internal structure and functional adaptations of Moringa wood while ensuring statistical relevance and computational efficiency. The data enables quantitative analysis of plant structures, including metrics like porosity, wall thickness, pore density, and pore diameter, which can be used to evaluate and characterize plant growth traits. After processing the images, labeling was performed, and quantitative measurements were conducted within the ROI to determine the void areas. The porosity of the Moringa samples was then calculated using Equation (1):
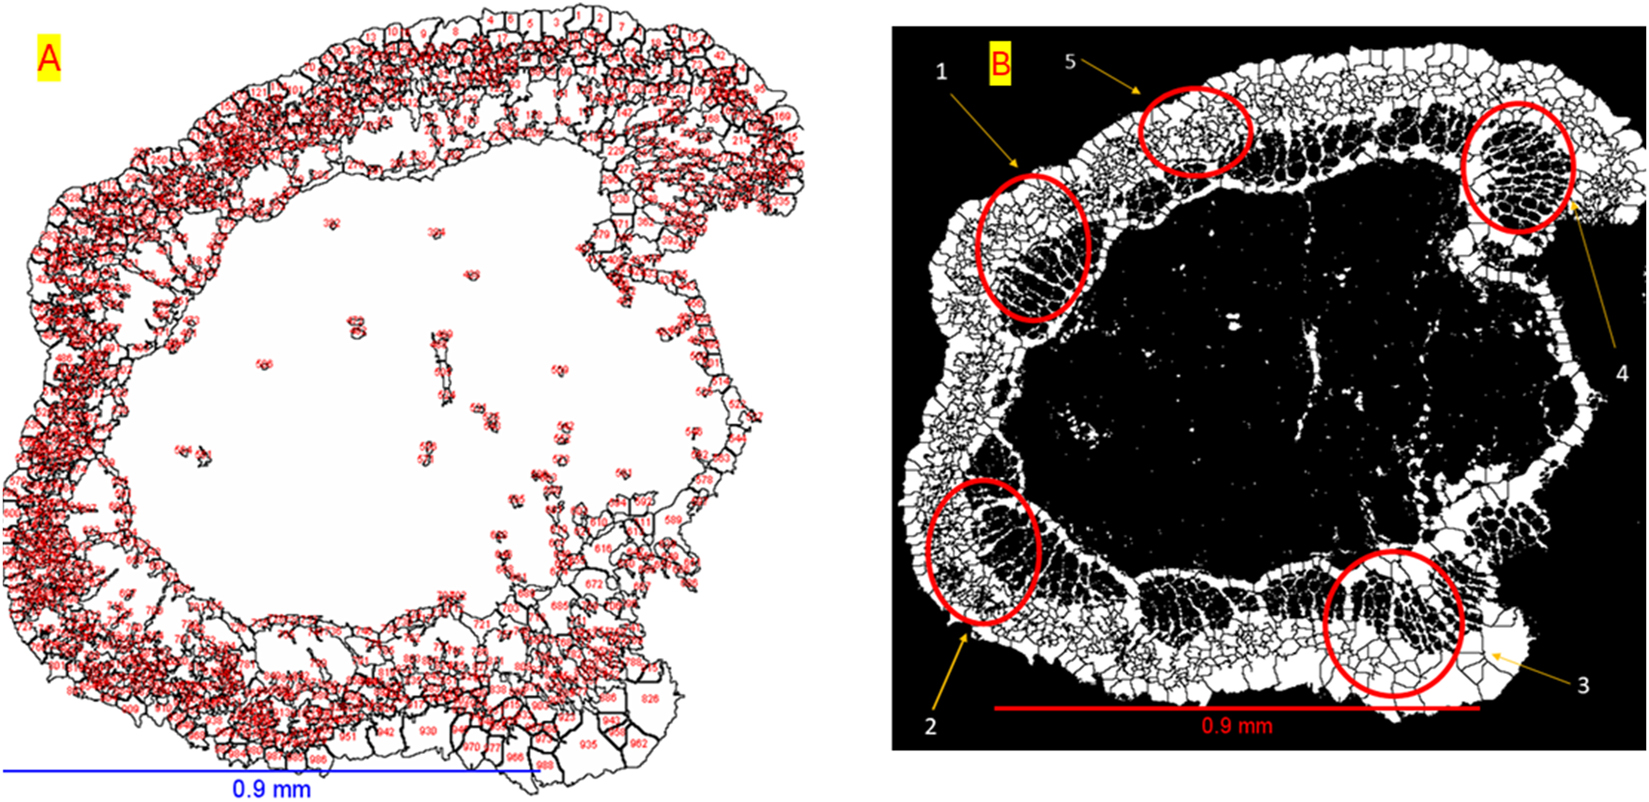
2D volume images of Moringa stem: (a) example of counting all objects; (b) selected objects for measurement (quantitative analysis, e.g., porosity, pore density etc.). Scale bars: (a, b) 0.9 mm.
The pore density was calculated using Equation (2):
The average pore size was calculated using Equation (3):
The pore diameter was calculated using Equation (4):
2.4 Statistical analysis
Descriptive statistics were applied to summarize the central tendencies and variability of microstructural parameters (porosity, pore density, average pore size, percent area, volume fraction, and pore diameter) across the five ROIs. Measures such as mean, median, standard deviation, range, skewness, and kurtosis were calculated to characterize data distributions. To explore relationships between variables, correlation analysis was performed due to the small sample size (n = 5). The correlation matrix quantified pairwise associations, with coefficients (ρ) ranging from −1 (perfect negative correlation) to +1 (perfect positive correlation).
3 Results
3.1 X-ray microtomography and classification
Typical 2D images used for determination of microstructure of Moringa stems are shown in Figure 2. Significant diversity may be seen in the X-ray absorption characteristics of the various tissues inside the stem of M. oleifera. Interestingly, because of their varying X-ray absorption levels, the borders between parenchyma cells and xylem arteries are clearly apparent. Structures like the inner longitudinal surface may be seen. Figure 2 shows transverse sections of the Moringa stem. The reconstructed 2D projections show the cross sections of the cell walls prominently as a bright circle. The anatomical organization of each compartment such as epidermis and xylem vessels could be easily identified. Within the stem section, different components can be identified and characterized in 2D. From these images it is possible to observe, with a lower level of brightness and the empty spaces. The grayscale tomography images are seen to be distinct than the conventional wood images, taken by optical microscopy, because the grayscale represents a spatial distribution of the density, which generates an attenuation in the incident X-rays.
3.2 Qualitative analysis
After segmenting the Moringa stem components, a filter was implemented to mitigate image noise, as illustrated in Figure 2a, depicting the image before and after filtering in Figure 2b. A cross-section in grayscale is shown in Figure 2c, the contrast obtained allows the distinction of the sites. Outer walls are represented by contiguous regions of white pixels, delineating the entirety of the stem’s external boundary. Inner walls are depicted as black areas within the white outer boundary, indicating void spaces within the stem structure. These inner walls demarcate the hollow or lumen of the stem, providing insights into its internal architecture. Within these lumen, central walls, depicted as white regions surrounded by black, may separate various compartments or tissues, such as vascular bundles or pith. The field of view of the stem sample contained an intact vascular bundle and a fraction of the parenchymatous tissue. The standard deviation of the brightness level histogram for both images is depicted in Figure 2d and e, respectively. The histogram of the Moringa stem provides a graphical representation of the distribution of pixel intensities within the image. Pre-filtering, a histogram peak around 76, suggests a prevalence of darker or mid-level intensity pixels, indicating potentially low contrast and noise. Post-filtering, a peak near 236 indicates an increased frequency of pixels with this intensity, reflecting alterations in pixel intensity distribution, likely enhancing contrast, reducing noise, or highlighting specific features. With the virtual segmentation of the solid and empty space phases of the Moringa stem tissue (Figure 2f), Kuwahara filtering was applied to enhance the image while preserving the details of its structural components, such as outer and inner walls. This method facilitated optimal segmentation while preserving the original architecture of the different phases in binary images. It maintained the initial continuity in all empty space phases, ensuring that the size, shape, connectivity, and existence of binary objects remained unaltered. The more superficial portion of the Moringa stem is densely packed with cells and gradually becomes more dispersed towards the center. The image in Figure 2g clearly shows the cell structure and arrangement in the Moringa stem while the watershed algorithm applied to the image of a Moringa stem obtained from ImageJ allows for the segmentation and delineation of distinct regions or features within the stem structure. The watershed segmentation facilitated the identification of specific anatomical components such as vascular bundles, parenchyma tissues, and epidermal layers. Figure 3a illustrates a processed cross-sectional slice of M. oleifera stem obtained using high-resolution X-ray micro-computed tomography (μCT). This visual example demonstrates the segmentation and primarily pores have been labeled and counted using a watershed segmentation algorithm implemented in ImageJ. Figure 3 shows each segmented object, shown with distinct boundaries or labels, represents a ROI that can be measured for quantitative parameters and contribute to the overall analysis of microstructural properties, including porosity, pore density, and pore diameter etc.
3.3 Quantitative analysis
Table 1 shows the overall measurements of porosity, pore density, average pore size, percentage area, and pore diameter. The porosity of Moringa wood was measured for the entire slice and for five different ROIs. The porosity and pore characteristics of Moringa wood were analyzed across the entire cross-section (Moringa slice) and five distinct ROIs as shown in Figure 4. The Moringa slice exhibited significantly higher porosity (22.3 ± 2.9 %) compared to the ROIs, which ranged from 2.4 ± 1.9 % (ROI 1) to 3.7 ± 0.2 % (ROI 3). This disparity suggests that pore distribution is heterogeneous, with the overall slice averaging contributions from both densely porous and less porous regions. Notably, ROI 3 displayed the highest porosity among the ROIs, whereas ROI 5 showed the lowest (2.5 ± 0.2 %), reinforcing the spatial variability in wood structure.
Overall measurements of Moringa wood.
| Porosity (%) | Pore density (μm−3) | Average pore size (μm)2 | % Area | Pore diameter (μm) | |
|---|---|---|---|---|---|
| Moringa slice | 22.3 ± 2.9 | 0.8 ± 0.2 | 1.2 ± 0.5 | 22.3 ± 1.7 | 38.7 ± 1.3 |
| ROI 1 | 2.4 ± 1.9 | 1.4 ± 1.0 | 0.7 ± 0.4 | 5.0 ± 1.6 | 12.6 ± 0.9 |
| ROI 2 | 2.8 ± 1.0 | 0.7 ± 0.3 | 0.7 ± 0.2 | 5.3 ± 1.6 | 13.7 ± 0.5 |
| ROI 3 | 3.7 ± 0.2 | 0.9 ± 0.6 | 1.9 ± 0.2 | 10.8 ± 1.9 | 15.8 ± 0.3 |
| ROI 4 | 3.5 ± 0.3 | 0.9 ± 0.5 | 0.7 ± 0.1 | 9.2 ± 2.8 | 15.4 ± 0.6 |
| ROI 5 | 2.5 ± 0.2 | 1.3 ± 0.9 | 0.4 ± 0.1 | 5.7 ± 0.5 | 12.8 ± 0.2 |
-
Porosity represents the areal percentage of pores relative to total sample area. Pore density is the number of pores per unit area (μm−3). % Area refers to the fractional area coverage of pores within each ROI, with standard deviations (SD) provided for all measurements.

Variations in porosity among different ROI’s of Moringa slice.
Pore density (μm−3) followed an inverse trend, with the Moringa slice having a lower density (0.8 ± 0.2) than most ROIs. ROI 1 and ROI 5 recorded the highest pore densities (1.4 ± 1.0 and 1.3 ± 0.9, respectively), indicating localized clusters of smaller pores. In contrast, ROI 2 had the lowest density (0.7 ± 0.3), suggesting sparser pore distribution as shown in Figure 5. The average pore size (μm2) further highlighted this trade-off: the Moringa slice contained larger pores (1.2 ± 0.5), while ROIs 2 and 5 featured smaller pores (0.7 ± 0.4 and 0.4 ± 0.1, respectively) as shown in Figure 6. This implies that smaller, more numerous pores in ROIs 1 and 5 may contribute to higher density but lower individual pore volume.

Variations in porosity among different ROI’s of Moringa slice.

Distribution of average pore size in Moringa wood slice.
The % area occupied by pores aligned with porosity trends, with the Moringa slice covering 22.3 ± 1.7 % of the total area, while ROIs accounted for 5.0 ± 1.6 % (ROI 1) to 10.8 ± 1.9 % (ROI 3) as shown in Figure 7. Pore diameters (μm) were largest in the Moringa slice (38.7 ± 1.3), whereas ROIs exhibited smaller diameters (12.6 ± 0.9 to 15.8 ± 0.3), as shown in Figure 8, consistent with their reduced pore sizes. These findings collectively underscore the structural complexity of Moringa wood, where macroscopic measurements (slice-level) mask microscale variability in pore distribution, density, and morphology.

Percent area analysis of Moringa wood.

Pore diameter analysis of Moringa wood.
The wall thickness of a Moringa stem, as observed through a CT scan as shown in Figure 9, offers valuable insights into the plant’s anatomy and structural integrity. Within the context of Moringa stem anatomy, it’s essential to understand that the stem comprises distinct layers, including the outer bark, inner bark (phloem), cambium layer, xylem, and pith at the core. When subjected to a CT scan, which utilizes X-rays to generate detailed cross-sectional images, the varying densities of these layers become apparent. Specifically, the wall thickness refers to the density and thickness of the outer layers of the stem as visualized in the scan. Thicker walls appear denser on the scan, while thinner walls exhibit lower density. This distinction in density provides valuable information about the structural composition of the stem. The purple areas on the heat map, corresponding to a wall thickness of 0–5 mm, likely indicate regions where there is no discernible thickness or very thin walls. These areas may coincide with regions such as the pith or central core of the stem, where the density of tissue is minimal. On the other hand, the red to yellowish areas, representing a wall thickness of 10–15 mm, suggest regions with significantly thicker walls. This segmentation technique aided in the precise analysis of the stems internal structure, enabling to quantify parameters such as vessel dimensions, tissue densities, and spatial distributions. As expected, the XμCT-ray scanning resolved the cell walls clearly.

Transverse and longitudinal wall thickness of Moringa wood. Scale bars: 0.9 mm and 0.65 mm.
3.4 Microstructural properties of Moringa wood: descriptive statistics
Table 2 presents the descriptive statistics of the measured parameters, including porosity, pore density, average pore size, percent area, and pore diameter. The mean values ranged from 0.6 μm for average pore size to 14.1 μm for pore diameter. The standard deviations indicate a moderate spread in the data, with pore diameter exhibiting the highest variability (SD = 1.5). Skewness values were close to zero for all variables, indicating approximately symmetric distributions. Kurtosis values were below 3 for all parameters, suggesting platykurtic distributions with lighter tails than a normal distribution. The range and confidence intervals further support moderate variation across samples. The descriptive statistics of microstructural parameters indicate generally consistent distributions across the five measured ROIs. The mean porosity was 3.0 with a standard deviation of 0.6 and showed a slight right skewness (0.4) and light-tailed distribution (kurtosis = −2.8). Pore density was nearly symmetric (skewness = 0.3), also indicating a platykurtic (light-tailed) distribution. Average pore size demonstrated very slight asymmetry (skewness = 0.2) and a relatively flat distribution (kurtosis = −0.9). Percent area had the most noticeable skew (0.8), suggesting a mild right-skew, though it too was light-tailed. The pore diameter was close to symmetric with light tails.
Descriptive statistics of microstructural properties in Moringa wood.
| Parameter | Mean | Standard deviation | Minimum | Maximum | Skewness | Kurtosis | Interpretation |
|---|---|---|---|---|---|---|---|
| Porosity | 3.0 | 0.6 | 2.4 | 3.7 | 0.4 | −2.8 | Slightly right-skewed; light-tailed |
| Pore density | 1.0 | 0.3 | 0.7 | 1.4 | 0.3 | −2.4 | Nearly symmetric; light-tailed |
| Average pore size | 0.6 | 0.3 | 0.3 | 1.0 | 0.2 | −0.9 | Nearly symmetric; slightly flatter than normal |
| Percent area | 7.2 | 2.6 | 5.0 | 10.8 | 0.8 | −2.1 | Mild right-skew; light-tailed |
| Pore diameter | 14.1 | 1.5 | 12.6 | 15.8 | 0.3 | −2.8 | Slightly right-skewed; light-tailed |
3.5 Correlation analysis
Pearson correlation analysis was performed to examine the relationships among porosity, pore density, average pore size, percentage area (% Area), and pore diameter as shown in Table 3. Porosity exhibited a strong positive correlation with pore diameter (r = 0.99) and % Area (r = 0.95), and a moderate positive correlation with average pore size (r = 0.58). A moderate negative correlation was observed between porosity and pore density (r = −0.64), indicating that increased porosity is associated with fewer but larger pores. Pore density showed a moderate negative correlation with both pore diameter (r = −0.66) and porosity, and a weak negative correlation with % Area (r = −0.40). Its correlation with average pore size was negligible (r = 0.09), suggesting limited association. Average pore size correlated moderately to strongly with % Area (r = 0.74) and moderately with pore diameter (r = 0.57), implying that larger pores contribute to greater surface coverage and diameter. % Area was strongly correlated with pore diameter (r = 0.94), porosity, and average pore size, confirming that increased pore size and porosity result in larger pore-covered surface areas. Pore diameter demonstrated near-perfect correlation with porosity and strong associations with both % Area and average pore size, reinforcing its role as a direct morphological indicator of pore structure Table 3.
Correlation matrix of all measured parameters.
| Porosity | Pore density | Average pore size | % Area | Pore diameter | |
|---|---|---|---|---|---|
| Porosity | 1.000 | −0.64 | 0.58 | 0.95 | 0.99 |
| Pore density | −0.64 | 1.00 | 0.09 | −0.40 | −0.66 |
| Average pore size | 0.58 | 0.09 | 1.00 | 0.74 | 0.57 |
| % Area | 0.95 | −0.40 | 0.74 | 1.00 | 0.94 |
| Pore diameter | 0.99 | −0.66 | 0.57 | 0.94 | 1.00 |
A moderate inverse correlation (R2 = 0.42) between porosity and pore density in Moringa wood (Supplementary Figure S1), indicating that higher pore density regions typically exhibit lower porosity. A significant negative correlation was observed between porosity and pore density (R2 = 0.42, p < 0.05), indicating that regions with higher pore density tended to exhibit lower porosity values. This inverse relationship suggests that as the number of pores per unit area increases, the total void fraction decreases, likely due to the prevalence of smaller pores in high-density regions. Linear regression analysis, (Supplementary Figure S2), revealed a moderate negative correlation between pore diameter and density (R2 = 0.44). A significant positive correlation was observed between porosity and pore size (R2 = 0.34, p < 0.05), indicating that larger pore sizes were associated with higher porosity values (Supplementary Figure S3). This direct relationship suggests that as pore dimensions increase, the total void fraction expands proportionally likely because larger individual pores contribute more substantially to overall void volume despite potential decreases in pore number density. A robust positive correlation between percent area and porosity (R2 = 0.91, p < 0.001), (Supplementary Figure S4), indicating that porosity increases. This near-perfect linear fit suggests percent area is a dominant predictor of porosity in Moringa wood. A strong positive linear relationship was observed between porosity and pore diameter, with an R2 value of 0.99, indicating that pore diameter significantly influences overall porosity (Supplementary Figure S6). As pore diameter increases, porosity also increases, highlighting the importance of vessel size in determining the internal structure and fluid transport efficiency of M. oleifera stems.
4 Discussion
To quantify the intercellular spaces – the voids or gaps between cells – in wood, several techniques have been devised. These methods seek to comprehend the wood’s structure and texture at the microscopic level since the density, strength, and general characteristics of the wood can be affected by the size and distribution of intercellular gaps. These spaces are quantified and analyzed using a variety of ways, including imaging techniques like microscopy (such as confocal or scanning electron microscopy) and computational methods. Research on plant anatomy uses X-ray micro-computed tomography (X-ray micro-CT), a potent 3D imaging method. In comparison to other approaches, it has some benefits (Atkinson et al. 2019; Karlen et al. 2024). With minimal preprocessing needed, X-ray micro-CT visualizes cells and intercellular gaps in tissue samples. For analysis of wood stems, effective labeling or segmentation of different tissue types is essential (Piovesan et al. 2021). The structural analysis of Moringa stem microstructure, facilitated by advanced imaging techniques such as micro-computed tomography (micro-CT), offers valuable insight into its anatomical features (Mcvea and Wood 2023). Lautner and Beckmann (2012) employed synchrotron radiation-based X-ray micro-computed tomography (SRμCT) to analyze the microstructure of Populus trichocarpa wood samples in three dimensions. This technique provided detailed, non-destructive visualization of cell size, volume, form, and interconnectivity, enabling precise measurements of vessel structures and water transport capacity. The 3D volume renderings provided clear contrasts between different tissue types within the stem, revealing distinct boundaries between xylem vessels and parenchyma cells. Similarly (Kitin et al. 2004) revealed the 3D structure of vessels in Fraxinus lanuginosa by applying SEM imaging to resin micro-casts. In another study, Koddenberg and Militz (2018) reported that XμCT presents an excellent example of the typical angiosperm architecture, including fibers, axial parenchyma cells, arteries, and ray parenchyma cells inside the Fraxinus excelsior wood rays. As a result, the technique can provide finely detailed photographs of these basic elements, which are crucial to the composition and functionality of angiosperm wood. Notably, the imaging results accurately reflected the intricate structures of the stem, including its inner longitudinal surface. In a study reported by Vya (2019) that mature Moringa stems have alternating bands of parenchyma cells and fibers that finally come together to create a circular band. Significant volumes of secondary xylem, which are made up of uniseriate xylem rays, spherical vessel components, and lignified thick-walled fibers, are produced by this band in a critical manner. In addition, little quantities of secondary phloem are produced by the vascular cambium. Similar results were observed by Mcvea and Wood (2023) in Moringa stem where vessel components show variation in size within each cell but retain a rather tangential diameter across different individual cells.
Rivera Ramos et al. (2021) showed that the grayscale tomography images provided a spatial distribution of density, highlighting variations in tissue composition and organization. Compared to traditional wood images obtained by optical microscopy, the grayscale tomography images seem different. This discrepancy results from attenuation in incoming X-rays caused by the grayscale’s representation of the density distribution. Utilizing X-ray attenuation, grayscale tomography depicts changes in material density. The denser locations in these photos seem lighter, while the lesser density areas, like lumens, are shown in the deepest grayscale or black. The results in this study also showed a similar pattern. According to Staedler et al. (2013), the examination of histograms using ImageJ software revealed distinct pixel density patterns in Moringa stem and the pixel density corresponds to the level of radiolucency (dark) or radiopacity (light) in the image, translated into gray values. The grayscale image in this study showed similar patterns of tissues with different brightness. Differentiated tissues within the Moringa stem, characterized by varying brightness levels in the grayscale image, can be effectively isolated and analyzed by defining specific grayscale ranges for visualization. By selecting appropriate grayscale brackets, distinct tissue components such as xylem, phloem, and parenchyma can be delineated, providing valuable insights into their distribution, morphology, and physiological functions.
Following image segmentation, a filter was applied to mitigate noise and enhance image clarity, resulting in improved visualization of structural components. Kuwahara filtering preserved the original architecture of different stem phases, maintaining continuity in empty space phases and ensuring accurate representation of binary objects. One of the simplest methods involves dividing pixels according to their grayscale values, which is called thresholding. These strategies have been effectively used by researchers in a variety of investigations. For example, to determine the intracellular space and mesophyll-exposed surface area in leaves, Mathers et al. (2018) employed automated thresholding based on Otsu’s approach. Global thresholding was also used by Matsushima et al. to investigate the distribution of calcium oxalate (CaOx) druses in rose peduncles. Using a grayscale-porosity correlation model created from combined low and high-resolution scans, Nugraha et al. (2019) used Otsu’s thresholding to construct porosity maps of fruits and vegetables. In another study, Zhang et al. (2018) developed high-throughput methods for extracting phenotypic features of maize vascular bundles using a mix of fixed threshold values and adaptive thresholding. Semi-automated local adaptive thresholding was employed by Flavel et al. (2017) to extract complicated root systems from the surrounding soil. Additionally, researchers have shown that segmentation approaches, such as applying top-hat filters after edge-preserving smoothing, may be used to separate and characterize fruit’s vascular networks (Rodrigues et al. 2024). The watershed segmentation technique further facilitated the identification and delineation of specific anatomical features within the stem structure (Herremans et al. 2015; Schlüter et al. 2014). This segmentation method aided in precise analysis, enabling quantification of parameters such as vessel dimensions and tissue densities (Chen et al. 2004; Pang et al. 2006). Ho et al. (2014) have successfully used watershed segmentation to distinguish between pores and cells in apple tissues, while (Zhao and Takhar 2017) have used it to separate and measure air holes in frozen potatoes. Similarly, Hu et al. (2020) created a 3D image analysis pipeline that extracts rice grain features using watershed segmentation and X-ray computed tomography, providing detailed 3D information on the stem.
Significant quantitative differences in porosity, pore density, average pore size, volume fraction, percentage area, and pore diameter were found throughout the sample when the porous structure of the M. oleifera L. stem was analyzed. Individual ROIs had much lower porosity values ranging from 2.4 ± 1.9 % (ROI 1) to 3.7 ± 0.2 % (ROI 3), whereas the Moringa slice’s total porosity was determined to be 22.3 ± 2.9 %. This indicates that most of the porosity is concentrated in specific places, which most likely correlates to areas where vascular systems are more developed. Indicating an area of improved pore formation, ROI 3 had the maximum porosity (3.7 ± 0.2 %), which may be consistent with functional adaptations for fluid conduction inside the stem. Pore density varies spatially across the sample. ROI 1 had the greatest pore density, measuring 1.4 ± 1.0 μm−3, whereas the total density was 0.8 ± 0.2 μm−3. This distribution identifies regions of dense pore networks that may improve transport or adsorption capabilities. On the other hand, ROI 2’s comparatively lower density (0.7 ± 0.3 μm−3) indicates a more compact structure, which may have an impact on mechanical strength.
With values ranging from 0.3 ± 0.6 μm2 (ROI 2) to 1.0 ± 0.2 μm2 (ROI 3), the average pore size varied considerably amongst the ROIs. When compared to other ROIs, ROI 3’s higher average pore size (1.0 ± 0.2 μm2) indicates a less compact microstructure, which might allow for increased permeability or fluid retention. The smaller average pore size (0.7 ± 0.4 μm2) in ROI 1, on the other hand, suggests a denser, maybe more mechanically robust area. These results are further supported by the volume fraction of pores in the stem, which at 22.3 ± 1.7 % nearly matches the porosity overall. Higher volume fraction ROIs, such ROI 3 (10.8 ± 1.9 %), support the findings that these areas have improved porous structure. On the other hand, ROI 1’s compact character is reflected in its smaller volume fraction (5.0 ± 1.6 %). The detailed variation in pore diameters, which is essential for applications needing exact control over fluid dynamics, was discovered by the pore diameter analysis. The area that was most suited for fluid transfer was indicated by ROI 3, which had the biggest average pore diameter (15.8 ± 0.3 μm). The lowest diameter (12.6 ± 0.9 μm) was found in ROI 1, which may indicate a higher resilience to mechanical stress.
The data presented in this study highlight that biological organs cannot be considered uniform structures (Dražeta et al. 2004; Guelpa et al. 2015). The analyzed parameter in this study plays a significant role in various biological and functional processes, such as facilitating respiratory gas exchange in plants aiding water transport during osmotic dehydration and enhancing ultrasonic drying efficiency (Ho et al. 2011; Lech et al. 2018). Mathers et al. (2018) conducted a study to analyze porosity among the dicots and Arabidopsis exhibited the highest porosity (26.0 % ± 0.6), significantly surpassing pea (20.5 % ± 1.6) and tomato (21.1 % ± 1.6). In monocots, barley showed the greatest porosity (27.4 % ± 1.8), while rice had the lowest (11.8 % ± 0.6), with oat intermediate (18.2 % ± 1.1). Similarly, in another study, Moghaddam et al. (2017) showed that total porosity and the porosity of different cell types, as well as cell wall thickness in maple and pine samples and reported that the total porosities values of 38.9 ± 1.3 % and 73.8 ± 1.8 % respectively and cell wall thickness of pine samples were 14.3 ± 6 μm. The microstructural features are critical in determining the heterogeneity of pore distribution in fruits and vegetables. According to Puig et al. (2012), eggplant’s epicarp (EPC) and endocarp (EDC) have different tissue architectures. While the epicarp is made up of four to five layers of spherical cells that are 10–25 μm in size and have few intercellular gaps, the endocarp is made up of tubular, interconnected cells that form extremely porous networks. All of these structural variations contribute to eggplant’s high porosity, which is 41.8 ± 1.0 %. Moghaddam et al. (2017) examined and evaluated the total porosity, porosity of various cell types, and cell wall thickness of maple and pine samples and showed that maple samples had total porosity of 73.8 ± 1.8 % and pine samples had 38.9 ± 1.3 % whereas the cell wall thickness were calculated as 14.3 ± 6.9 %. According to Zhao et al. (2023) that the structure and permeability of larch wood were investigated using XCT, a well-used method for studying porous materials, and reported that the porosity 0.638 µm2. In another study by Guo et al. (2020), an oak sample was utilized to characterize the pore structure and reported that pore diameters ranged from 8.56 µm to 1,262.84 µm, the pore volume was 1.01 × 1010 μm3, and the pore area and volume porosity were 1.12 × 109 μm2 and 37.6 %, respectively, for the 27 mm3 oak sample. The range of surface porosity was from 36.1 % to 39.1 %. For axial connections, the pore diameter ranged from 164.57 µm to 1,262.84 µm, and the pore area and volume fractions were around 74.4 % and 67.3 %, respectively. Sun et al. (2021) reported that an envelope porosity of 74.9 % for loblolly pine wood chips, which falls within the typical range for natural wood. This value highlights the highly porous nature of the material, making it suitable for applications requiring fluid transport or chemical penetration, such as bioenergy or material modification.
The descriptive analysis of the microstructural properties of Moringa wood ROIs revealed that all measured parameters exhibited skewness values close to zero, indicating approximately symmetric distributions. Additionally, kurtosis values were below 3 for all parameters, suggesting platykurtic distributions with lighter tails than normal distribution. Similarly, research on the microstructure of wood using 3D imaging techniques has provided insights into the symmetric and platykurtic nature of wood cell structures (Sandak et al. 2024; Saudreau et al. 2017; Trtik et al. 2007).
This study introduces a novel workflow for analyzing M. oleifera wood microstructure using high-resolution X-ray micro-computed tomography (micro-CT), combined with advanced image processing techniques such as Kuwahara filtering and watershed segmentation. Unlike traditional methods that require destructive sample preparation, this approach enables non-destructive 3D visualization and quantification of anatomical features, overcoming limitations posed by lignin and cellulose interference in optical techniques. The study provides the first comprehensive dataset on Moringa wood, revealing a total porosity of 22.3 ± 2.9 %, with localized ROIs ranging from 2.4 ± 1.9 % (ROI 1) to 3.7 ± 0.2 % (ROI 3), pore density of 0.8 ± 0.2 μm−3, and pore diameters between 12.6 ± 0.9 μm (ROI 1) and 15.8 ± 0.3 μm (ROI 3). Notably, strong correlations were identified between pore diameter (r = 0.99) and % Area (r = 0.95), while pore density showed a negative correlation with porosity (r = −0.64). These findings highlight how pore morphology, rather than quantity, dominates porosity, offering new insights into the material’s fluid transport capabilities. Additionally, spatial heterogeneity in wall thickness (0–15 mm) was linked to structural reinforcement, with denser regions likely corresponding to xylem and phloem tissues.
The methodology aligns with advancements in micro-CT applications for wood science, such as studies on F. excelsior (Koddenberg and Militz 2018) and P. trichocarpa (Lautner and Beckmann 2012), but extends these techniques to M. oleifera, a species with unique anatomical traits like alternating bands of parenchyma and fibers. The porosity values bridge gaps between dense angiosperms e.g., oak at 37.6 % (Guo et al. 2020) and highly porous conifers e.g., pine at 73.8 %, (Moghaddam et al. 2017), positioning Moringa as an intermediate case. The correlation results corroborate earlier observations that pore size governs hydraulic efficiency (Sun et al. 2021) but provide species-specific data for Moringa, which had not been quantitatively characterized before. Furthermore, the use of ImageJ for segmentation and statistical analysis refines approaches applied to other woods, addressing spatial heterogeneity more systematically.
5 Conclusions
Moringa oleifera, often referred to as the “miracle tree” due to its wide range of medicinal, nutritional, and purifying properties. The use of X-ray micro-computed tomography (X-ray micro-CT) in plant anatomy research has proven to be a powerful tool for visualizing and analyzing the intricate structures of plant tissues, such as those found in the Moringa stem. This method offers several advantages over traditional imaging techniques, including minimal preprocessing requirements and the ability to generate high-resolution 3D images in a matter of minutes. The application of various image processing techniques, such as thresholding and watershed segmentation, has further enhanced the utility of X-ray micro-CT by enabling precise delineation of different tissue types within the stem structure.
Significant data on the porosity, pore density, average pore size, volume fraction, pore diameter, and wall thickness of the stem microstructure of M. oleifera L. was obtained by the use of ImageJ. The pore density of 0.8 ± 0.2 μm−3 and total porosity of 22.3 ± 2.9 % demonstrate the ability of Moringa stem to facilitate fluid movement and adsorption, which is essential for uses including water filtration and the creation of biochar. The localized formation of porous structures, which may be related to functional changes within the stem, is highlighted by the variability shown across several areas of interest (ROIs), with ROI 3 showing the largest porosity (3.7 ± 0.2 %) and pore diameter (15.8 ± 0.3 μm).
The intricate interaction between the Moringa stem’s structural and functional characteristics is highlighted by the variance in average pore size and pore diameter, with ROI 3 displaying the greatest values. The possibility of customized applications where certain pore sizes and distributions are crucial is suggested by this variability. By displaying regions of different densities that correspond with the stem’s anatomical and functional responsibilities, the wall thickness as seen by CT scans offered a comprehensive insight of the structural integrity of the stem.
By establishing M. oleifera as a model for micro-CT-based analysis, this study advances understanding of its microstructural adaptations and potential biomaterial applications. The workflow and findings bridge gaps between traditional wood studies and modern imaging, offering a replicable pipeline for future research on understudied species. The strong correlations between pore metrics and porosity also provide a foundation for predictive models in biomaterial design, while the non-destructive approach sets a precedent for ecological and industrial studies of plant tissues.
All things considered, the study shows the promise of the Moringa stem as a biomaterial with a variety of uses in industrial and environmental settings. To further increase the usefulness of Moringa wood in the creation of sustainable materials, future studies might concentrate on connecting these microstructural characteristics with performance indicators in practical applications. These advancements have provided valuable insights into the distribution, morphology, and physiological functions of these tissues, contributing significantly to the understanding of plant anatomy.
6 Future challenges
Future studies should extend the application of X-ray micro-CT for plant anatomical investigations to a larger variety of plant species and tissue types, beyond the initial focus on Moringa stems, in order to fully realize it’s potential. High-throughput and automated quantification of anatomical characteristics will be made possible by combining X-ray micro-CT with complementary imaging methods and utilizing sophisticated image analysis pipelines, such as machine learning and deep learning algorithms. The grasp of the links between plant structure and function will be strengthened by connecting the reported anatomical features with functional implications through computer modeling and simulations. Standardized procedures, best practices, and publicly accessible databases will also promote data exchange, cooperation, and reproducibility among scientists. Researchers may fully utilize X-ray micro-CT for thorough and quantitative examinations by following these guidelines. By following these suggestions, scientists may fully utilize X-ray micro-CT for in-depth, quantitative analyses of plant morphology, expanding the understanding of plant biology, ecology, and agriculture.
Acknowledgments
We sincerely extend our heartfelt gratitude to Shimadzu Corporation, Japan for providing us with their advanced X-ray CT machines. Their cutting-edge technology has significantly enhanced our research capabilities, enabling us to achieve precise and reliable results. We deeply appreciate their support and commitment to innovation.
-
Research ethics: This research was conducted ethically, ensuring accuracy, transparency, and reproducibility. All procedures were environmentally responsible, and resources were used efficiently. Proper acknowledgment and respect for intellectual property were upheld throughout.
-
Informed consent: Not applicable.
-
Author contributions: Naseer Ullah conducted the analysis, wrote the original draft, and performed the review and editing of the manuscript. Takeshi Fujino provided research ideas, conceptualization, and overall guidance throughout the study. Both authors contributed to the interpretation of the results and approved the final manuscript for submission. All authors have accepted responsibility for the entire content of this manuscript and approved its submission.
-
Use of Large Language Models, AI and Machine Learning Tools: Not applicable.
-
Conflict of interest: The authors declare that there are no competing interests associated with this research.
-
Research funding: This research did not receive any specific grant from funding agencies in the public, commercial, or not-for-profit sectors.
-
Data availability: The data supporting the findings of this study are available from the corresponding author upon reasonable request.
References
Ahmed, S., Klassen, T.N., Keyes, S., Daly, M., Jones, D.L., Mavrogordato, M., Sinclair, I., and Roose, T. (2016). Imaging the interaction of roots and phosphate fertiliser granules using 4D X-ray tomography. Plant Soil 401: 125–134.10.1007/s11104-015-2425-5Search in Google Scholar
Arzola-Villegas, X., Báez, C., Lakes, R., Stone, D.S., O’dell, J., Shevchenko, P., Xiao, X., De Carlo, F., and Jakes, J.E. (2023). Convolutional neural network for segmenting micro-X-ray computed tomography images of wood cellular structures. Appl. Sci. 13: 8146.10.3390/app13148146Search in Google Scholar
Atkinson, J.A., Pound, M.P., Bennett, M.J., and Wells, D.M. (2019). Uncovering the hidden half of plants using new advances in root phenotyping. Curr. Opin. Biotechnol. 55: 1–8.10.1016/j.copbio.2018.06.002Search in Google Scholar PubMed PubMed Central
Chen, K., Zhang, W., La, T., Bastians, P.A., Guo, T., and Cao, C. (2021). Microstructure investigation of plant architecture with X-ray microscopy. Plant Sci. 311: 110986.10.1016/j.plantsci.2021.110986Search in Google Scholar PubMed
Chen, Q., Yang, X., and Petriu, E.M. (2004). Watershed segmentation for binary images with different distance transforms. In: Proceedings of the 3rd IEEE international workshop on haptic, audio and visual environments and their applications, Vol. 2004, pp. 111–116.Search in Google Scholar
Chinga-Carrasco, G. (2002). Microscopy and computerized image analysis of wood pulp fibres multi-scale structures. In: Microscopy: science, technology, applications and education. Formatex, Badajoz, pp. 2182–2189.Search in Google Scholar
Dierick, M., Van Loo, D., Masschaele, B., Van Den Bulcke, J., Van Acker, J., Cnudde, V., and Van Hoorebeke, L. (2014). Recent micro-CT scanner developments at UGCT. Nucl. Inst. Methods Phys. Res. Section B: Beam Interact. Mater. Atoms 324: 35–40.10.1016/j.nimb.2013.10.051Search in Google Scholar
Dierickx, S., Genbrugge, S., Beeckman, H., Hubau, W., Kibleur, P., and Van Den Bulcke, J. (2024). Non-destructive wood identification using X-ray µCT scanning: which resolution do we need? Plant Methods 20: 98.10.1186/s13007-024-01216-0Search in Google Scholar PubMed PubMed Central
Dražeta, L., Lang, A., Hall, A.J., Volz, R.K., and Jameson, P.E. (2004). Air volume measurement of ‘Braeburn’apple fruit. J. Exp. Bot. 55: 1061–1069.10.1093/jxb/erh118Search in Google Scholar PubMed
Dumur, T., Duncan, S., Graumann, K., Desset, S., Randall, R.S., Scheid, O.M., Bass, H.W., Prodanov, D., Tatout, C., and Baroux, C. (2019). Probing the 3D architecture of the plant nucleus with microscopy approaches: challenges and solutions. Nucleus 10: 181–212.10.1080/19491034.2019.1644592Search in Google Scholar PubMed PubMed Central
Duncan, K.E., Czymmek, K.J., Jiang, N., Thies, A.C., and Topp, C.N. (2021). X-ray microscopy enables multiscale high-resolution 3D imaging of plant cells, tissues, and organs. Plant Physiol. 188: 831–845.10.1093/plphys/kiab405Search in Google Scholar PubMed PubMed Central
Ekaputri, T.S. and Tanaka, T. (2024). Quantitative analysis of commercial coating penetration into Fagus crenata wood using X-ray microtomography. Sci. Rep. 14: 13925.10.1038/s41598-024-64892-xSearch in Google Scholar PubMed PubMed Central
Feng, D. (2022). Visualizing inorganics in wood and wood composites using X-ray micro-CT (Doctoral dissertation). University of British Columbia, Canada.Search in Google Scholar
Flavel, R.J., Guppy, C.N., Rabbi, S.M., and Young, I.M. (2017). An image processing and analysis tool for identifying and analysing complex plant root systems in 3D soil using non-destructive analysis. Root1. PloS one 12: e0176433.10.1371/journal.pone.0176433Search in Google Scholar PubMed PubMed Central
Gerth, S., Claußen, J., Eggert, A., Wörlein, N., Waininger, M., Wittenberg, T., and Uhlmann, N. (2021). Semiautomated 3D root segmentation and evaluation based on X-ray CT imagery. Plant Phenomics 2021.10.34133/2021/8747930Search in Google Scholar PubMed PubMed Central
Guelpa, A., Du Plessis, A., Kidd, M., and Manley, M. (2015). Non-destructive estimation of maize (Zea mays L.) kernel hardness by means of an X-ray micro-computed tomography (μCT) density calibration. Food Bioprocess Technol. 8: 1419–1429.10.1007/s11947-015-1502-3Search in Google Scholar
Guo, L., Cheng, H., Chen, J., Chen, W., and Zhao, J. (2020). Pore structure characterization of oak via X-ray computed tomography. BioResources 15.10.15376/biores.15.2.3053-3063Search in Google Scholar
Hanke, R., Fuchs, T., Salamon, M., and Zabler, S. (2016). X-ray microtomography for materials characterization. In: Materials characterization using nondestructive evaluation (NDE) methods. Woodhead Publishing, Cambridge, UK, pp. 45–79.10.1016/B978-0-08-100040-3.00003-1Search in Google Scholar
Herremans, E., Verboven, P., Hertog, M.L., Cantre, D., Van Dael, M., De Schryver, T., Van Hoorebeke, L., and Nicolaï, B.M. (2015). Spatial development of transport structures in apple (Malus× domestica Borkh.) fruit. Front. Plant Sci. 6: 679.10.3389/fpls.2015.00679Search in Google Scholar PubMed PubMed Central
Ho, Q.T., Verboven, P., Verlinden, B.E., Herremans, E., Wevers, M., Carmeliet, J., and Nicolaï, B.M. (2011). A three-dimensional multiscale model for gas exchange in fruit. Plant Physiol. 155: 1158–1168.10.1104/pp.110.169391Search in Google Scholar PubMed PubMed Central
Ho, Q.T., Verboven, P., Fanta, S.W., Abera, M.K., Retta, M.A., Herremans, E., Defraeye, T., and Nicolaï, B.M. (2014). A multiphase pore scale network model of gas exchange in apple fruit. Food Bioprocess Technol. 7: 482–495.10.1007/s11947-012-1043-ySearch in Google Scholar
Hu, W., Zhang, C., Jiang, Y., Huang, C., Liu, Q., Xiong, L., Yang, W., and Chen, F. (2020). Nondestructive 3D image analysis pipeline to extract rice grain traits using X-ray computed tomography. Plant Phenomics 2020.10.34133/2020/3414926Search in Google Scholar PubMed PubMed Central
Jiang, X., Van Den Bulcke, J., Van Acker, J., and De Ligne, L. (2024). An X-ray CT assessment of fungal growth in spruce, poplar and thermally-modified poplar. Wood Mater. Sci. Eng. 19: 357–365.10.1080/17480272.2023.2243464Search in Google Scholar
Karlen, C., Turberg, P., Buttler, A., Martin, O., Schweingruber, F., and Vassilopoulos, A.P. (2024). Combining X-ray micro-CT and microscopy-based images of two lianas species to derive structural, mechanical and functional relationships. Plant Systemat. Evol. 310: 10.10.1007/s00606-024-01889-zSearch in Google Scholar
Kitin, P.B., Fujii, T., Abe, H., and Funada, R. (2004). Anatomy of the vessel network within and between tree rings of Fraxinus lanuginosa (Oleaceae). Am. J. Bot. 91: 779–788.10.3732/ajb.91.6.779Search in Google Scholar PubMed
Koddenberg, T. and Militz, H. (2018). Morphological imaging and quantification of axial xylem tissue in Fraxinus excelsior L. through X-ray micro-computed tomography. Micron 111: 28–35.10.1016/j.micron.2018.05.004Search in Google Scholar PubMed
Kurei, T., Tsushima, R., Okahisa, Y., Nakaba, S., Funada, R., and Horikawa, Y. (2021). Creation and structural evaluation of the three-dimensional cellulosic material “White-Colored Bamboo”. Holzforschung 75: 180–186.10.1515/hf-2020-0030Search in Google Scholar
Lautner, S. and Beckmann, F. (2012). Analysis of wood microstructure by synchrotron radiation-based X-ray microtomography (SRµCT). In: Developments in X-Ray tomography VIII, 8506. SPIE, pp. 68–73.10.1117/12.929571Search in Google Scholar
Lech, K., Michalska, A., Wojdyło, A., Nowicka, P., and Figiel, A. (2018). The influence of physical properties of selected plant materials on the process of osmotic dehydration. LWT 91: 588–594.10.1016/j.lwt.2018.02.012Search in Google Scholar
Liu, L.-L., Fang, H., Wei, X.-Q., Liu, Y.-T., Gao, W.-D., Li, B.-G. and Zhou, H. Research advances on using X-ray CT in the study of 3-D root architecture. J. Nutr. Fertil.Search in Google Scholar
Martin, T. and Koch, A. (2006). Recent developments in X-ray imaging with micrometer spatial resolution. J. Synchrotron Radiat. 13: 180–194.10.1107/S0909049506000550Search in Google Scholar PubMed
Mathers, A.W., Hepworth, C., Baillie, A.L., Sloan, J., Jones, H., Lundgren, M., Fleming, A.J., Mooney, S.J., and Sturrock, C.J. (2018). Investigating the microstructure of plant leaves in 3D with lab-based X-ray computed tomography. Plant Methods 14: 1–12.10.1186/s13007-018-0367-7Search in Google Scholar PubMed PubMed Central
Mccoy, V.E., Boom, A., Wings, O., Wappler, T., Labandeira, C.C., and Gee, C.T. (2021). Fossilization of the Eocene “monkeyhair” laticifer tree from Geiseltal, Germany: a deeper understanding using micro-CT and pyrolysis GC/MS. Palaios 36: 1–14.10.2110/palo.2020.052Search in Google Scholar
Mcvea, H.M. and Wood, L.J. (2023). Anatomical and chemical analysis of Moringa oleifera stem tissue grown under controlled conditions. Horticulturae 9: 213.10.3390/horticulturae9020213Search in Google Scholar
Mendoza, F., Verboven, P., Mebatsion, H.K., Kerckhofs, G., Wevers, M., and Nicolaï, B. (2007). Three-dimensional pore space quantification of apple tissue using X-ray computed microtomography. Planta 226: 559–570.10.1007/s00425-007-0504-4Search in Google Scholar PubMed
Moghaddam, M.S., Bulcke, J.V.D., Wålinder, M.E.P., Claesson, P.M., Acker, J.V., and Swerin, A. (2017). Microstructure of chemically modified wood using X-ray computed tomography in relation to wetting properties. Holzforschung 71: 119–128.10.1515/hf-2015-0227Search in Google Scholar
Nugraha, B., Verboven, P., Janssen, S., Wang, Z., and Nicolaï, B.M. (2019). Non-destructive porosity mapping of fruit and vegetables using X-ray CT. Postharvest Biol. Technol. 150: 80–88.10.1016/j.postharvbio.2018.12.016Search in Google Scholar
Ovečka, M., Von Wangenheim, D., Tomančák, P., Šamajová, O., Komis, G., and Šamaj, J. (2018). Multiscale imaging of plant development by light-sheet fluorescence microscopy. Nat. Plants 4: 639–650.10.1038/s41477-018-0238-2Search in Google Scholar PubMed
Pang, Q., Yang, C., Fan, Y. and Chen, Y. (2006). Overlapped cell image segmentation based on distance transform. In: 6th world congress on intelligent control and automation. IEEE, pp. 9858–9861.10.1109/WCICA.2006.1713922Search in Google Scholar
Piovesan, A., Vancauwenberghe, V., Van De Looverbosch, T., Verboven, P., and Nicolaï, B. (2021). X-ray computed tomography for 3D plant imaging. Trends Plant Sci. 26: 1171–1185.10.1016/j.tplants.2021.07.010Search in Google Scholar PubMed
Puig, A., Perez-Munuera, I., Carcel, J., Hernando, I., and Garcia-Perez, J.V. (2012). Moisture loss kinetics and microstructural changes in eggplant (Solanum melongena L.) during conventional and ultrasonically assisted convective drying. Food Bioprod. Process. 90: 624–632.10.1016/j.fbp.2012.07.001Search in Google Scholar
Reich, D., Berger, A., Von Balthazar, M., Chartier, M., Sherafati, M., Schönenberger, J., Manafzadeh, S., and Staedler, Y.M. (2020). Modularity and evolution of flower shape: the role of function, development, and spandrels in Erica. New Phytol. 226: 267–280.10.1111/nph.16337Search in Google Scholar PubMed PubMed Central
Rivera Ramos, J., Espinoza Herrera, R., Arteaga, D., Cruz De León, J., and Olmos, L. (2021). Microstructural analysis of Eucalyptus nitens wood through computed microtomography. Wood Mater. Sci. Eng. 16: 344–357.10.1080/17480272.2020.1774926Search in Google Scholar
Rodrigues, A.M.B., Torres, M.F.O., Nunes, V.V., Souza, J.L., Santana, N.A., and Silva-Mann, R. (2024). Unveiling the structure of Spondias tuberosa dispersal units through X-ray imaging. Genetic Res. Crop Evolution 71: 947–956.10.1007/s10722-023-01751-0Search in Google Scholar
Rousseau, D., Chéné, Y., Belin, E., Semaan, G., Trigui, G., Boudehri, K., Franconi, F., and Chapeau-Blondeau, F. (2015). Multiscale imaging of plants: current approaches and challenges. Plant Methods 11: 1–9.10.1186/s13007-015-0050-1Search in Google Scholar PubMed PubMed Central
Sandak, A., Gordobil, O., Poohphajai, F., and Herrera Diaz, R. (2024). Weathering of wood modified with acetic anhydride: physical, chemical, and aesthetical evaluation. Forests 15: 1097.10.3390/f15071097Search in Google Scholar
Saudreau, M., Ezanic, A., Adam, B., Caillon, R., Walser, P., and Pincebourde, S. (2017). Temperature heterogeneity over leaf surfaces: the contribution of the lamina microtopography. Plant, Cell & Environ. 40: 2174–2188.10.1111/pce.13026Search in Google Scholar PubMed
Schlüter, S., Sheppard, A., Brown, K., and Wildenschild, D. (2014). Image processing of multiphase images obtained via X‐ray microtomography: a review. Water Resour. Res. 50: 3615–3639.10.1002/2014WR015256Search in Google Scholar
Staedler, Y.M., Masson, D., and Schönenberger, J. (2013). Plant tissues in 3D via X-ray tomography: simple contrasting methods allow high resolution imaging. PloS One 8: e75295.10.1371/journal.pone.0075295Search in Google Scholar PubMed PubMed Central
Stock, S. (2008). Recent advances in X-ray microtomography applied to materials. Int. Mater. Rev. 53: 129–181.10.1179/174328008X277803Search in Google Scholar
Sun, Q., Xia, Y., Klinger, J., Seifert, R., Kane, J., Thompson, V., and Chen, Q. (2021). X-ray computed tomography-based porosity analysis: algorithms and application for porous woody biomass. Powder Technol. 388: 496–504.10.1016/j.powtec.2021.05.006Search in Google Scholar
Trtik, P., Dual, J., Keunecke, D., Mannes, D., Niemz, P., Stähli, P., Kaestner, A., Groso, A., and Stampanoni, M. (2007). 3D imaging of microstructure of spruce wood. J. Struct. Biol. 159: 46–55.10.1016/j.jsb.2007.02.003Search in Google Scholar PubMed
Vya, M.K. (2019). A contribution on the anatomical characters of Moringa oleifera Lamk. and their significance. J. Pharmacogn. Phytochem. 8: 576–578.Search in Google Scholar
Walker, N.C., Ruiz, S.A., Ferreira, T.R., Coletta‐Filho, H.D., Le Houx, J., Mckay Fletcher, D., White, S.M., and Roose, T. (2024). A high‐throughput analysis of high‐resolution X‐ray CT images of stems of olive and citrus plants resistant and susceptible to Xylella fastidiosa. Plant Pathol. 73: 630–643.10.1111/ppa.13835Search in Google Scholar
Zhang, H., He, H., Gao, Y., Mady, A., Filipović, V., Dyck, M., Lv, J., and Liu, Y. (2023). Applications of computed tomography (CT) in environmental soil and plant sciences. Soil Tillage Res. 226: 105574.10.1016/j.still.2022.105574Search in Google Scholar
Zhang, Y., Ma, L., Pan, X., Wang, J., Guo, X., and Du, J. (2018). Micron-scale phenotyping techniques of maize vascular bundles based on X-ray microcomputed tomography. J. Vis. Exp.: JoVE 58501.10.3791/58501Search in Google Scholar PubMed PubMed Central
Zhao, J., Li, L., Lv, P., Sun, Z., and Cai, Y. (2023). A comprehensive evaluation of axial gas permeability in wood using XCT imaging. Wood Sci. Technol. 57: 33–50.10.1007/s00226-022-01449-zSearch in Google Scholar
Zhao, Y. and Takhar, P.S. (2017). Micro X-ray computed tomography and image analysis of frozen potatoes subjected to freeze-thaw cycles. LWT-Food Sci. Technol. 79: 278–286.10.1016/j.lwt.2017.01.051Search in Google Scholar
Ziegler-Rivera, F.R., Prado, B., Gastelum-Strozzi, A., Márquez, J., Mora, L., Robles, A., and González, B. (2021). Computed tomography assessment of soil and sediment porosity modifications from exposure to an acid copper sulfate solution. J. South Am. Earth Sci. 108: 103194.10.1016/j.jsames.2021.103194Search in Google Scholar
Supplementary Material
This article contains supplementary material (https://doi.org/10.1515/hf-2025-0011).
© 2025 the author(s), published by De Gruyter, Berlin/Boston
This work is licensed under the Creative Commons Attribution 4.0 International License.
Articles in the same Issue
- Frontmatter
- Wood Growth/Morphology
- Qualitative and quantitative microstructural investigation of Moringa oleifera wood through X-ray computed tomography
- Wood Chemistry
- Assessing the softening behavior of rosin during heating using variable-temperature low-field nuclear magnetic resonance
- Wood Physics/Mechanical Properties
- From forestry schools to wood physics as a scientific discipline: a review of historical milestones and future directions of wood science
- Directional anisotropy of wood surface wettability: morphological dynamics of droplet behavior observed from different directions
- Wood Technology/Products
- Impact of determination method and sample type on basic wood density analysis and its implications for Eucalyptus pulp production
- Green and efficient deep eutectic solvent strategy for rapid aging of Castanopsis sclerophylla wood: a sustainable approach to restore ancient wooden architecture
- Mechanistic insights into enhanced fire and smoke resistance in surface densified wood: a chemical-free thermophysical approach
- Effective joining of partially delignified wood without additional adhesives using a parchmentising approach with zinc dichloride solution