Machine learning-assisted spectrometric method for pulp extractive analysis based on model pulps
-
Julia Chrząstowska
 ,
Tomasz Sokalski
,
Tomasz Sokalski

Abstract
Extractives in wood, despite being vital in plant survival in adverse environmental conditions, can cause issues in pulping and papermaking, leading to significant financial losses within the forest industry. Conventional analysis is time consuming due to the challenging sample preparation, data interpretation and complex nature of extractives. There is a clear need for the development of a quick, non-destructive method for on-line pulp extractives monitoring. In this work, a machine learning-supported procedure for classification and prediction of extractives based on near infrared (NIR) and Raman spectroscopies was proposed. To avoid the influence of many variables, the method was developed and validated using a model compound approach, where cellulose was spiked with model extractives compounds. The accuracy of sample classification depending on the extractive added was 92.4 % based on NIR. The accuracy of classification of six samples containing different concentrations of the model compound using NIR data was 89.5 %. Partial least squares calibration model applied to pretreated NIR spectra yielded R2 and root standard error of 0.78 and 0.35, respectively This means that the method could be used for non-selective quick estimation of extractive content with potential application to forest industry in process and fiber quality control in pulp and paper.
1 Introduction
Extractives are various compounds found in plants, but they are not part of the plant structure and can be removed from the samples using organic solvents or water. One of their functions is to protect the plants against hostile environmental conditions and factors such as ultraviolet radiation, oxidation, pests, fungi and other microbes. The extractive family consists of a wide array of compounds and is traditionally classified into two main groups: lipophilic (waxes, fats, fatty acids, fatty alcohols, terpenes and terpenoids) and hydrophilic extractives (sugars, phenolic compounds). The extractive content and composition can vary significantly between different plant species. The variance within extractives of one species of plant can originate from different growth conditions and even within one plant from several sampling spots (Fardim 2011; Valette et al. 2017). Recently, plenty of research has focused on the unique properties of plant extractives and their possible applications. For instance, antioxidative, antimicrobial and antidiabetic activity of some extractive compounds was examined for potential use in medicine, pharmacy and cosmetic or food industries (N’Guessan et al. 2023; Piccand et al. 2019; Valette et al. 2017).
However, when it comes to pulping and papermaking processes, the presence of some of the lipophilic extractives, known as pitch, is often deemed negative. The accumulation of pitch in pulp and paper mills can result in disrupted wet-end chemistry, deposits on machinery, spots or holes in the paper, impairment of the mechanical properties, odorization and colouring of products, decreased paper wettability and printability. Other possible effects of pitch presence include impaired bleachability of pulps, lowered brightness or increased consumption of bleaching chemicals. Kraft pulping of birch wood is especially problematic, because birch bark is rich in very lipophilic pentacyclic triterpene compounds such as betulinol and betulinic acid. These compounds often contaminate the process waters, despite debarking being performed ahead of pulping, and lead to many production issues (Bergelin and Holmbom 2003; Ek et al. 2009; Gutiérrez 2001).
It is vital for mills to be able to follow the content of extractives in their process waters, intermediate products and final products – whether the final product is pulp or paper. The usual analytical approach includes many steps: sample grinding, solvent extraction of the biomass followed by gravimetric analysis, which can only yield quantitative and non-selective results. In order to determine the extract composition, it is necessary to derivatize the extract by silylation and then perform chromatographic analysis. Gas chromatography with flame ionization detection (GC-FID) and gas chromatography mass spectrometry (GC-MS) are commonly jointly used to quantify and identify single compounds in extracts. Additionally, size-exclusion liquid chromatography (LC-SEC) can be used to quantify the content of high molecular mass and polymerized extractives, which cannot be detected by GC (Ekman and Holmbom 1989; Fardim 2011; Holmbom 1999; Holmgren et al. 1999; Lehr et al. 2021; Wagner et al. 2020). This approach is destructive, very time-consuming, requires trained personnel, expensive analytical devices, big quantities of solvents and toxic reagents. A novel, faster, easier and non-destructive method, which could be easily applied at the pulp and paper production lines and allow for constant process monitoring, is needed.
The solution considered in this work is based on near infrared (NIR) and Raman spectroscopies in combination with a machine learning tool. Both of the spectroscopic methods can be non-destructive and fast, they require no sample pretreatment and can be quantitative as long as a reference method is used (Antti et al. 1996; Holmgren et al. 1999). Both spectroscopies are sensitive to different types of molecules and bonds – NIR to polar and asymmetrical and Raman to non-polar and symmetrical (Stewart et al. 1995), and they provide complementary structural information. Both methods have previously been applied to wood, pulp and paper industry and are suitable for analysing the composition of lignocellulosic materials without isolating the components of interest. NIR spectroscopy was used to determine extractive content in Larix sp. Heartwood (Gierlinger et al. 2002), Eucalyptus globulus (Poke et al. 2005; Poke and Raymond 2006) and Astronium graveolens (Taylor et al. 2008), while Raman spectroscopy in Pinus sylvestris (Belt et al. 2017; Holmgren et al. 1999; Nuopponen et al. 2004a,b) and Eucalyptus sp. The reported application of NIR to pulp analysis included prediction of pulp quality properties (Antti et al. 1996), determination of pentosans in wood pulp (Márquez et al. 2023) and monitoring the effects of pulping process parameters on pulp properties (Henriksen et al. 2005). Raman was successfully employed in prediction of bleaching effects on oxygen-delignified softwood kraft pulp (Wójciak et al. 2014) and in characterization of lignin in pulps (Ibrahim et al. 1997). To authors’ best knowledge, neither NIR, nor Raman have been used in quantification of pulp extractives so far.
The main challenges restricting potential usage of NIR and Raman are sensitivity to moisture and sample fluorescence, respectively (Kenton and Rubinovitz 1990; Stewart et al. 1995). Additionally, the interpretation of spectra and direct extraction of sample information are not always straightforward, especially in NIR, where the bands are overlapping (Gierlinger et al. 2002; Li et al. 2015). The solution proposed in the previous research was to apply machine learning methods, which could find nonlinear correlations between spectral data and sample compositions. Some of the suitable methods reported in literature included principal component analysis (PCA) and artificial neural networks (ANN) for sample classification and partial least squares (PLS) for calibrations (Gowen et al. 2008; Márquez et al. 2023; Poke et al. 2005).
In this work, the model compound approach was adopted to mitigate the difficulties related to developing a predictive model on such a complex biobased material as pulp. The bleached kraft pulps are heterogenous and contain multiple different extractive compounds at very small quantities. Additional sources of variation in pulp include the structure of cellulose fibres, polysaccharide composition, lignin and random contaminant contents (Asikainen et al. 2010). Instead of building the novel analytical method on industrially sourced pulps, cellulose sheets spiked with known amounts of chosen extractive compounds (betulinol and stearic acid) were used. The method is to be applied to analysis of the industrially sourced kraft pulps in the future work.
2 Materials and methods
2.1 Reagents and materials
Acetone (≥99.8 %), heneicosanoic acid (99 %), cholesteryl heptadecanoate (≥95 %), 1,3-dipalmitoyl-2-oleyl glycerol (99 %), cholesterol (≥99 %) were purchased from Sigma-Aldrich (St. Louis, MO, USA) and stearic acid (99 %) from Fluka Chemie GmbH, Sigma-Aldrich (Buchs, Switzerland), while glacial acetic acid (≥99.7 %) and pyridine (≥99.5 %) from Fisher Scientific (Loughborough, UK). Chlorotrimethylsilane (TMCS, 98 %) and N,O-Bis-(trimethylsilyl)trifluoroacetamide (BSTFA, ≥99 %) were obtained from Acros Organics (Geel, Belgium) and Apollo Scientific (Bredbury, UK) respectively. Distilled and deionized water (resistivity 18.2 MΩm) was prepared using ELGA Purelab Ultra purification system (ELGA LabWater, Lane End, UK). Betulinol (≥99.9 %) was isolated from outer birch bark and purified through several re-crystallizations. The bases used for preparing the model pulps were: Machery-Nagel 640d quantitative filter paper (<0.01 % ash content) and cellulose sheets made of softwood dissolving pulp provided by the forest industry.
2.2 Methods
2.2.1 Preparation of model pulps
The model pulps contained only cellulose and either one or both of the chosen extractive model compounds (betulinol and stearic acid). The concentrations of the extractives in model pulps were higher by several orders of magnitude compared to extractives concentrations in industrially sourced pulps.
Thirty five model pulp samples were prepared, where either a Machery-Nagel quantitative filter paper or cellulose sheets were used as bases. The fabrication included cutting the base into approximately 5 × 5 cm pieces, placing them in beakers and spiking with solution of one or both extractive model compounds in acetone (concentration range of the stearic acid solutions: 0.04–10 mg/mL; betulinol solutions: 0.025–2.5 mg/mL). The solvent was then removed through evaporation. The composition of used samples is illustrated in Figure 1.
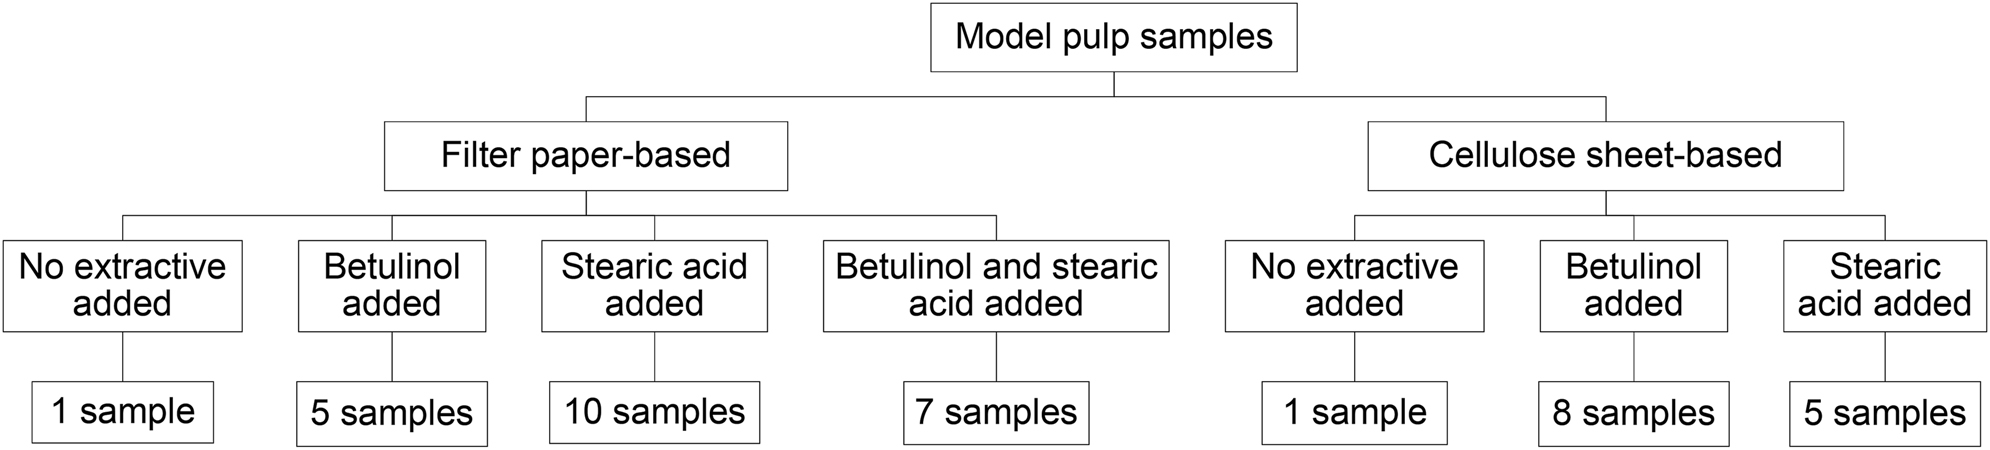
Types of model pulp samples.
2.2.2 Extraction and chromatographic analysis of model pulp samples
Prior to the extraction, the model pulps were cut into smaller pieces, then the extraction was performed using Dionex 350 Accelerated Solvent Extractor (Dionex Corp., Sunnyvale, CA, USA), where acidified acetone (95 % acetone, 4 % water, 1 % acetic acid v/v) was the extraction solvent. The extraction was completed in three 5-min cycles at 100 °C and 13.8 MPa according to Willför et al. (2003).
Before the chromatographic analysis, the model pulp extracts were silylated using pyridine, N,O-Bis-(trimethylsilyl)trifluoroacetamide and chlorotrimethylsilane (1:4:1). The long-column extractive analysis was performed using AutoSystem XL GC-FID (PerkinElmer Inc., Waltham, MA, USA) where the column (length: 25 m, internal diameter 0.20 mm) was coated with cross-linked methyl polysiloxane with a film thickness of 0.11 µm (HP-1). Heinecosanoic acid, betulinol, cholesterol, cholesteryl heptadecanoate and 1,3-dipalmitoyl-2-oleyl glycerol were used as internal standards according to Ekman and Holmbom (Ekman and Holmbom 1989); betulinol was used as a standard in the samples which were spiked with stearic acid, while cholesterol in samples spiked with betulinol or with both model extractive compounds. The individual components in the silylated extracts were identified using HP 6890-5973 GC-MSD device. The column used was identical as the one used in the long-column GC analysis.
2.3 Spectroscopic measurements
2.3.1 Near infrared spectroscopy (NIR)
The NIR spectra were recorded using Lambda 1050 + UV/Vis/NIR Spectrometer (PerkinElmer, Waltham, MA, USA) in a single scan at 750–2,200 nm range with 10 nm resolution. The total diffuse reflectance of solid samples was measured using PerkinElmer 150 mm InGaAs integrating sphere detector with Spectralon® used as a 100 % reflectance reference. A baseline spectrum was acquired once before every measurement series. Each sample was measured eight times in randomized order and on the randomly chosen spots.
2.3.2 Raman spectroscopy
The Raman spectra were recorded with a single scan using Qontor in Via Raman confocal microscope (Renishaw, Wotton-under-Edge, UK) equipped with Leica microscope and CCD detector. The range of measurement was 3,200–150 cm−1. Solid samples were scanned using a 785 nm laser at 100 % power setting and 50× magnification objective for 10 s using 1,200 l/mm grating. The axes were calibrated using silica as a reference. Each sample was measured four times in randomized order and on the randomly chosen spots.
2.4 Spectra preprocessing
It was necessary to perform preprocessing of both NIR and Raman spectra to effectively extract the chemical data from them. In NIR, the main issues are baseline shift, scattering and non-linearities and the data needs to be transformed, so that it follows Lambert–Beer’s law. One of the most suitable methods for pretreatment of NIR spectra is Savitzky–Golay filter, which smooths the spectra and performs differentiation of the data to reduce the multiplicative and additive effects without reducing the signal-to-noise ratio. Several normalization methods such as standard normal variate (SNV), multiplicative scatter correction, mean-centering or Euclidean distances are used to remove the baseline shifts and variability caused by samples (Peris-Díaz and Krężel 2021).
In Raman spectroscopy it is necessary to mitigate the effects caused by Raileigh scattering, fluorescence and the experimental conditions, in particular the presence of cosmic radiation. These result in baseline drift, peak shifting, random noise, cosmic spikes and poor signal-to-noise ratio. The main strategies of reducing these effects in Raman spectra include intensity and wavenumber axis calibrations, removal of baseline and cosmic peaks, smoothing through Savitzky–Golay filter and various normalization techniques (SNV, vector, area or min–max normalization) (Mostafapour et al. 2023). Peaks in Raman spectroscopy caused by cosmic rays were removed and baseline correction was applied using WiRE software (Renishaw, Wotton-under-Edge, UK). The spectra of reference samples were subtracted ahead of the data analysis.
The following spectra preprocessing methods were investigated: Savitzky–Golay filter (0, 1st, 2nd and 3rd derivatives; window 5) and normalization (SNV, vector, min-max, area). The most suitable method for each dataset was chosen based on the lowest relative standard error of cross-validation and prediction (RSE, Equation (1)) (Goodarzi et al. 2009) and highest coefficient of determination for cross-validation and prediction (R2, Equation (2)). (Renaud and Victoria-Feser 2010) in predictive modelling of extractive compounds.
where: n - dataset size; yi - observed value;
Orange Data Mining software version 3.36.2 (University of Ljubljana, Ljubljana, Slovenia) was used to apply these preprocessing methods to the NIR and Raman spectra.
The spectra used for building the classification models were not normalized or treated with Savitzky–Golay filter, as spectral pretreatment is not particularly essential for classification (Geladi and Dåbakk 2017).
2.5 Machine learning
Orange Data Mining software version 3.36.2 (University of Ljubljana, Ljubljana, Slovenia) was used for machine learning.
The spectral data was divided into subsets displayed in Table 1, to investigate how the following factors influence the predictive models: (a) using two different bases to fabricate the model pulps and (b) adding either one or both extractive compounds to the bases.
Subsets of spectral data used for building predictive models (classification and calibration).
| Sample subsets for calibration and classification | Number of model pulp spectra + number of reference base spectra | ||
|---|---|---|---|
| NIR | Raman | ||
| 1. | Filter paper-based model pulps – samples containing one extractive compound | 84 + 8 | 40 |
| 2. | Filter paper-based model pulps – mix of samples containing one extractive compound or two extractive compounds | 140 + 8 | 68 |
| 3. | Cellulose sheet-based model pulps – samples containing one extractive compound | 88 + 8 | 34 |
| 4. | All model pulps – samples containing one extractive compound | 172 + 16 | 74 |
| 5. | All model pulps – mix of samples containing one extractive compound or two extractive compounds | 228 + 16 | 102 |
Reference samples were not used in the calibrations or classifications based on the Raman spectra, because all model pulp spectra were pretreated by subtracting the spectra of reference bases.
Additionally, two data subsets were used for semi-quantitative prediction of betulinol and stearic acid contents in the cellulose sheet-based model pulps (Table 2). In this case the Raman spectra were not pretreated by subtracting the spectra of reference samples – the reference samples were included in the classification.
Subsets of spectral data used for building semi-quantitative prediction models.
| Sample subsets for calibration and classification | Number of model pulp spectra + number of reference base spectra | ||
|---|---|---|---|
| NIR | Raman | ||
| 1. | Cellulose sheet-base model pulps containing betulinol | 19 + 8 | 9 + 2 |
| 2. | Cellulose sheet-base model pulps containing stearic acid | 30 + 8 | 15 + 2 |
The following classification models were used and compared: artificial neural network (ANN), logistic regression (LR), random forest (RF), naïve Bayes (NB) and k-nearest neighbors (k-NN). The models were subjected to a threefold stratified cross-validation. The best model for each dataset was chosen according to the highest classification accuracy (CA) score, which is the ratio of correct predictions (Opitz 2024).
When building a calibration model, partial least squares (PLS), linear regression (LnR) and supporting vector machines (SVM) algorithms were examined. After performing the threefold cross-validation, the best model for each dataset was selected on the basis of lowest root standard error of cross-validation (RSECV) and highest coefficient of determination for cross-validation (RCV2). The spectroscopic data was also split into calibration set and test set in 3:2 proportion and the training and testing sequence was repeated 10 times to examine the predictive ability of the models. The best predictive ability was determined by the highest coefficient of determination of prediction (R P 2) and lowest root standard error of prediction (RSEP).
3 Results and discussion
3.1 GC-FID extractive analysis
The GC-FID analysis of filter paper and cellulose sheet reference samples revealed that they contained 63.04 and 67.74 mg/kg of impurities, respectively. The content ranges and mean content of stearic acid and betulinol in the model pulp samples are shown in Table 3.
The extractive compounds content in model pulps according to GC-FID.
| Sample subset | Extractive compound | Number of samples | Extractive content (mg/kg) | Mean absolute deviation | ||
|---|---|---|---|---|---|---|
| Median | Min | Max | ||||
| Filter paper-based model pulps containing one extractive compound | Betulinol | 5 | 1,345.97 | 270.81 | 1,945.57 | 567.78 |
| Stearic acid | 10 | 109.97 | 1.80 | 449.11 | 164.76 | |
| Filter paper-based model pulps containing two extractive compounds | Betulinol | 7 |
1,376.40 | 73.93 | 2,266.80 | 673.67 |
| Stearic acid | 1,385.30 | 91.88 | 2,446.05 | 772.04 | ||
| Total | 2,598.12 | 2,191.75 | 2,828.80 | 167.15 | ||
| Cellulose sheet-based model pulps containing one extractive compound | Betulinol | 8 | 2,409.79 | 59.60 | 3,082.74 | 1,024.77 |
| Stearic acid | 5 | 987.77 | 22.98 | 2,342.85 | 573.00 | |
3.2 Spectroscopic measurements
3.2.1 Near infrared spectroscopy
The bands in spectra of betulinol and stearic acid considerably differ from the other spectra (Figure 2). Both have absorption bands around 1,200 nm (C–H), 1,390 nm (O–H and C–H) and 1720 (C–H). Additionally, in the stearic acid spectrum the bands at 930 nm and 1,030 nm caused by C–H are observed and the band from O–H and C–H at 2,100 nm appears in the betulinol spectrum (Streamer 2013).
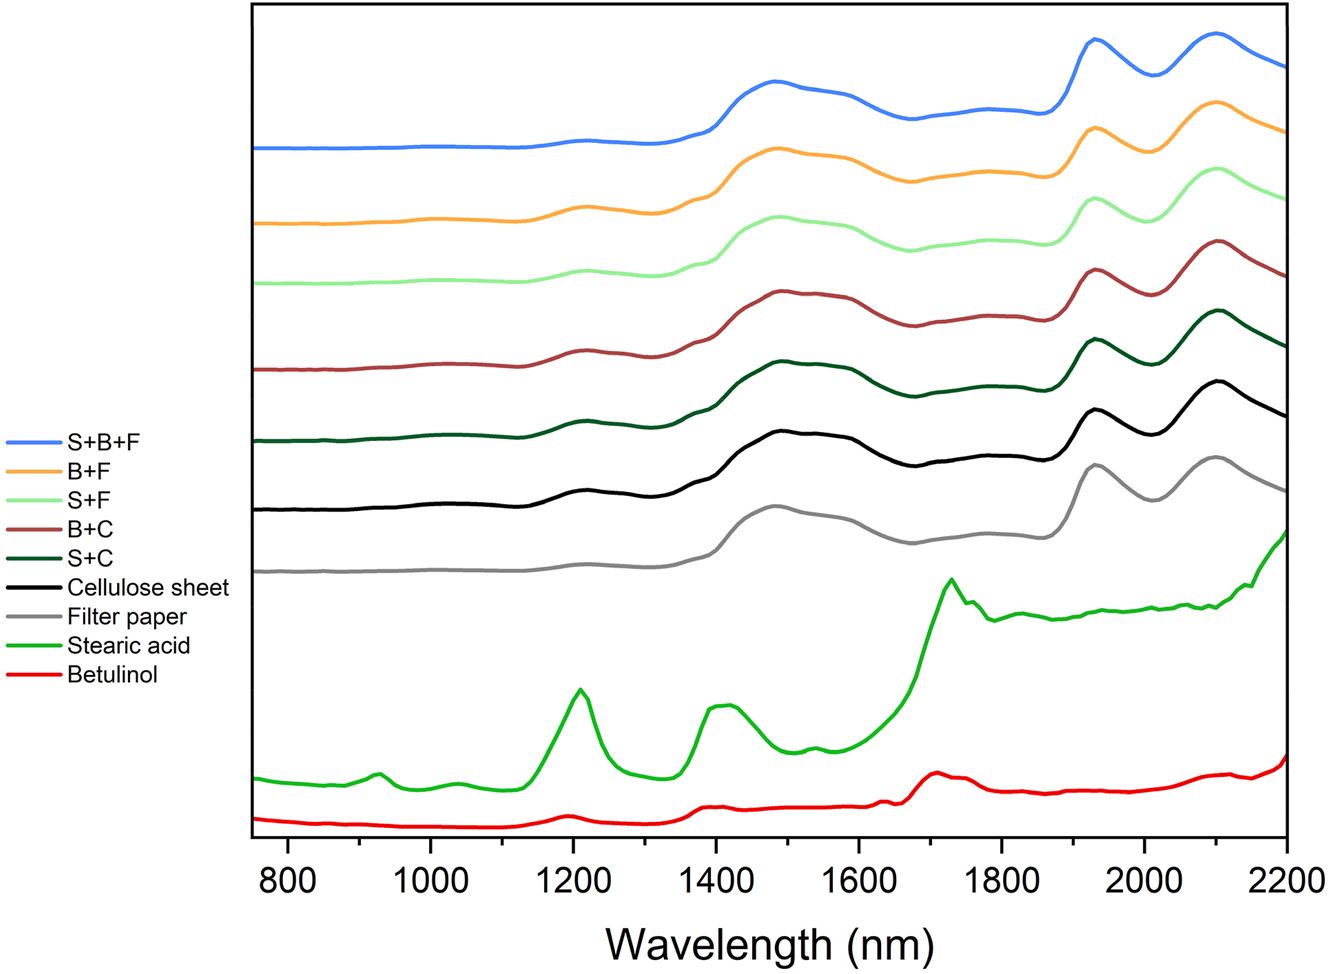
Averaged raw NIR absorption spectra of model compound powders (betulinol and stearic acid), filter paper, cellulose sheet and different model pulp types (F - filter paper base; C - cellulose sheet base; S - stearic acid added; B - betulinol added).
There are no significant differences between the spectra of filter paper, cellulose sheet and all model pulps. The absorption band at 1,220 nm can be attributed to C–H stretching, while the band at 1,490 is most probably related to the O–H stretching in cellulose. In the 1st overtone region, there are two absorption bands: the weak one at 1780 is caused by C–H stretch in cellulose and H–O–H deformation in water, while the one at 1930 by O–H in water and by C=O. In the combination region 1900–2,500 nm the bands are a result of overlapping – the band at 2,100 nm is caused by O–H and C–H stretching in cellulose and polysaccharides (Fardim et al. 2002; Gierlinger et al. 2002; Hayes 2011; Li et al. 2015). It is impossible to directly observe the absorption bands in the model pulp spectra which are directly caused by the addition of betulinol and stearic acid, because the spectra of all model types are very similar to the reference samples.
3.2.2 Raman spectroscopy
Figure 3 shows that the spectrum of betulinol yields much weaker Raman effect than the model pulps, filter paper or cellulose sheets. Many small peaks between 1,640 cm−1 and 150 cm−1 were observed in the betulinol spectrum. The spectrum of stearic acid is typical for long-chain saturated fatty acids with bands at around 1,050 cm−1 and 1,150 cm−1 related to C–C stretching, a very intense band at 1,300 cm−1 caused by CH2 twisting and a cluster of peaks between 1,400 and 1,500 cm−1 resulting from CH2 wagging, deformation and scissoring or CH3 deformation (Saggu et al. 2015). The broad peak at 2,900 cm−1 appears in every spectrum and is related to C–H or C–H2 stretching in cellulose, alkyl chain of stearic acid or in the rings of betulinol. The same peak groups can be observed in all spectra of model pulps as well as in the filter paper and in the cellulose reference spectra. The peak group around 380 cm−1 can be seen in every model pulp and base spectrum, which suggests that it originates from cellulose. The group at 1,380 cm−1 is a result of C–H2 or C–H3 deformation or C–O–H bending. The peaks observed at 1,100 cm−1 can be caused by C–C skeletal mode vibrations, C–O–C glycosidic vibration, C–O stretching or C–C stretching from either cellulose or polysaccharides (Belt et al. 2017; Dou et al. 2023; Ibrahim et al. 1997; Ji et al. 2013).
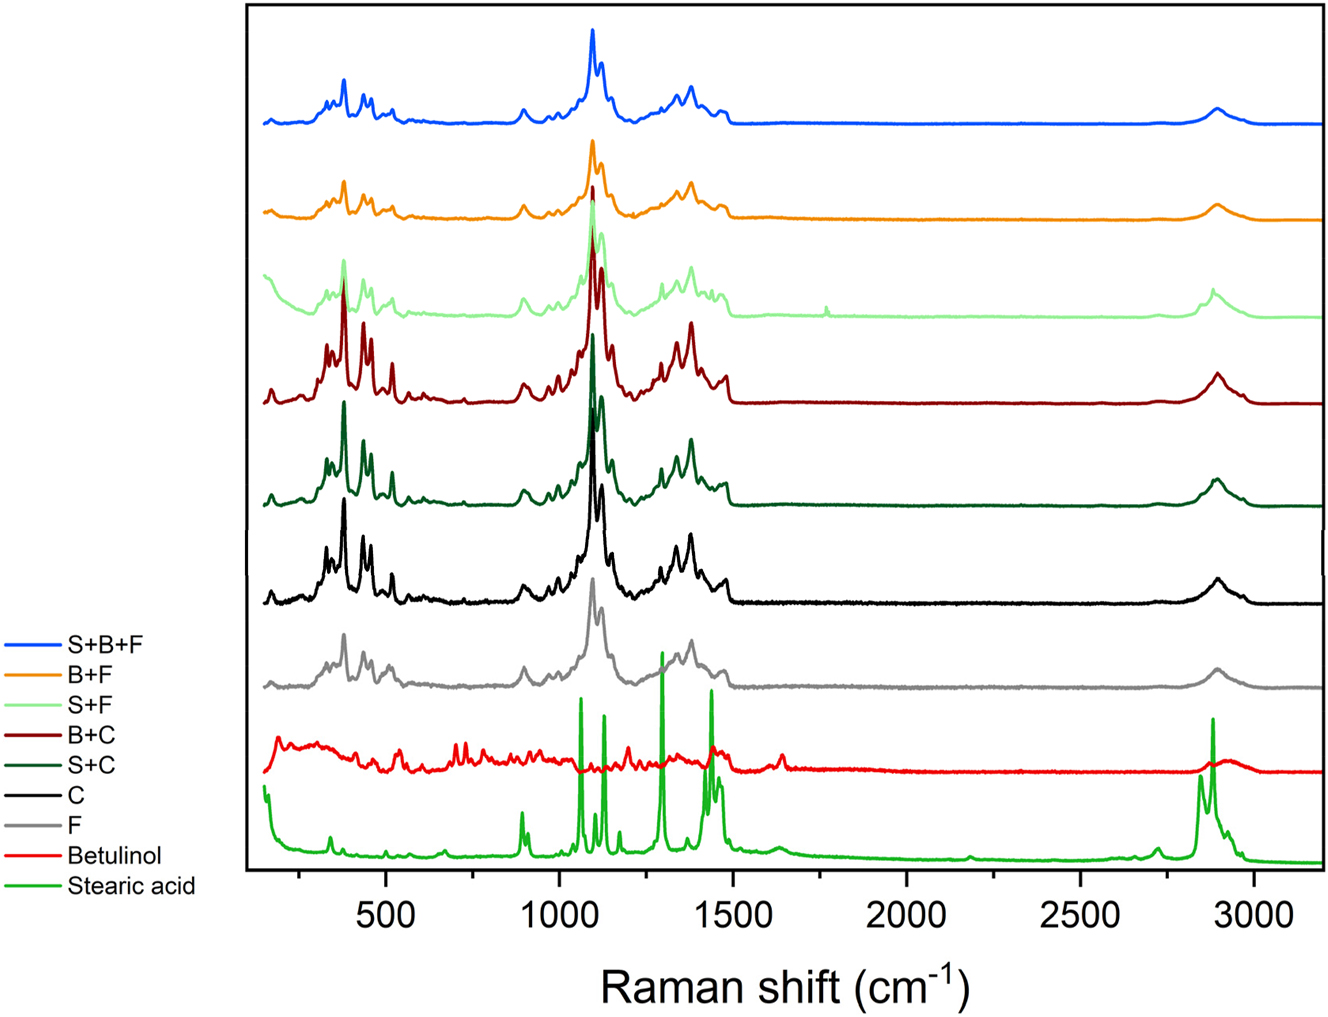
Averaged Raman spectra of model compound powders (betulinol and stearic acid), filter paper, cellulose sheet and different model pulp types (F - filter paper base; C - cellulose sheet base; S - stearic acid added; B - betulinol added). The spectra pretreatment included baseline correction and cosmic peak removal.
3.3 Machine learning
3.3.1 Classification
The qualitative classification was performed on data subsets as shown in Table 1, while the samples used for semi-quantitative classification are listed in Table 2.
3.3.1.1 Qualitative classification
Table 4 depicts the results of classification of samples in five subsets depending on the classification algorithm used. The aim was to classify the samples into the following categories based on the spectra: model pulps containing betulinol, model pulps containing stearic acid, model pulps containing both extractive compounds, references (and whether it was a filter paper or a cellulose sheet in subsets 4 and 5; only applies to NIR).
Classification accuracy scores of five different algorithms used to classify model pulp samples within five subsets based on NIR and Raman spectra.
| Sample subset | Classification accuracy (%) | ||||||||||
|---|---|---|---|---|---|---|---|---|---|---|---|
| NIR | Raman | ||||||||||
| k-NN | LR | NB | ANN | RF | k-NN | LR | NB | ANN | RF | ||
| 1. | Filter paper-based model pulps – samples containing one extractive compound | 92.4 | 92.4 | 42.4 | 91.3 | 91.3 | 86.0 | 86.0 | 76.0 | 80.0 | 92.0 |
| 2. | Filter paper-based model pulps – mix of samples containing one extractive compound or two extractive compounds | 87.8 | 89.2 | 43.9 | 86.5 | 84.5 | 71.4 | 80.5 | 62.3 | 68.8 | 74.0 |
| 3. | Cellulose sheet-based model pulps – samples containing one extractive compound | 63.9 | 73.2 | 37.1 | 81.4 | 70.0 | 62.9 | 68.6 | 68.6 | 65.7 | 62.9 |
| 4. | All model pulps – samples containing one extractive compound | 80.4 | 82.5 | 22.8 | 83.1 | 78.8 | 74.1 | 75.3 | 61.2 | 76.5 | 71.8 |
| 5. | All model pulps – mix of samples containing one extractive compound or two extractive compounds | 85.7 | 86.9 | 27.3 | 84.9 | 83.3 | 59.8 | 70.5 | 53.6 | 64.3 | 64.3 |
-
k-NN - k-nearest neighbors; LR - logistic regression; NB - naïve Bayes; ANN - artificial neural network; RF - random forest.
According to Table 4, naïve Bayes was generally the worst performing method both in classification based on NIR spectra and Raman spectra. The algorithm which most successfully classified the samples based on either type of spectra was usually logistic regression.
In Figure 4, the details on performance of the best algorithm in each subset can be seen for classifications based on both types of spectroscopies. According to Table 4 and Figure 4, on average, the first sample subset had the highest scores of CA for both types of spectroscopies, which can be attributed to the fact that the first subset contained one type of reference and did not contain any samples which were spiked with both extractive compounds. Interestingly, the third subset also contained only one type of reference and no model pulps spiked with both extractives, but on average the CA in this subset was the lowest out of all subsets both based on NIR and Raman spectra. The reason might be that the cellulose sheets contained more impurities than the filter paper, which could negatively affect the outcome of classification. This data subset also had the most variation, according to the mean absolute deviation values in Table 3. Another interesting tendency was that for NIR the classification in the last subset was more successful than in the fourth subset, even though the last subset contained one more category (the model pulps spiked with both betulinol and stearic acid). Overall, the classifications based on NIR were always more accurate than those based on Raman, which could be related to the fact that fewer spectra were used for the Raman classifications. On the other hand, the NIR classifications always contained one or two more categories for reference samples.
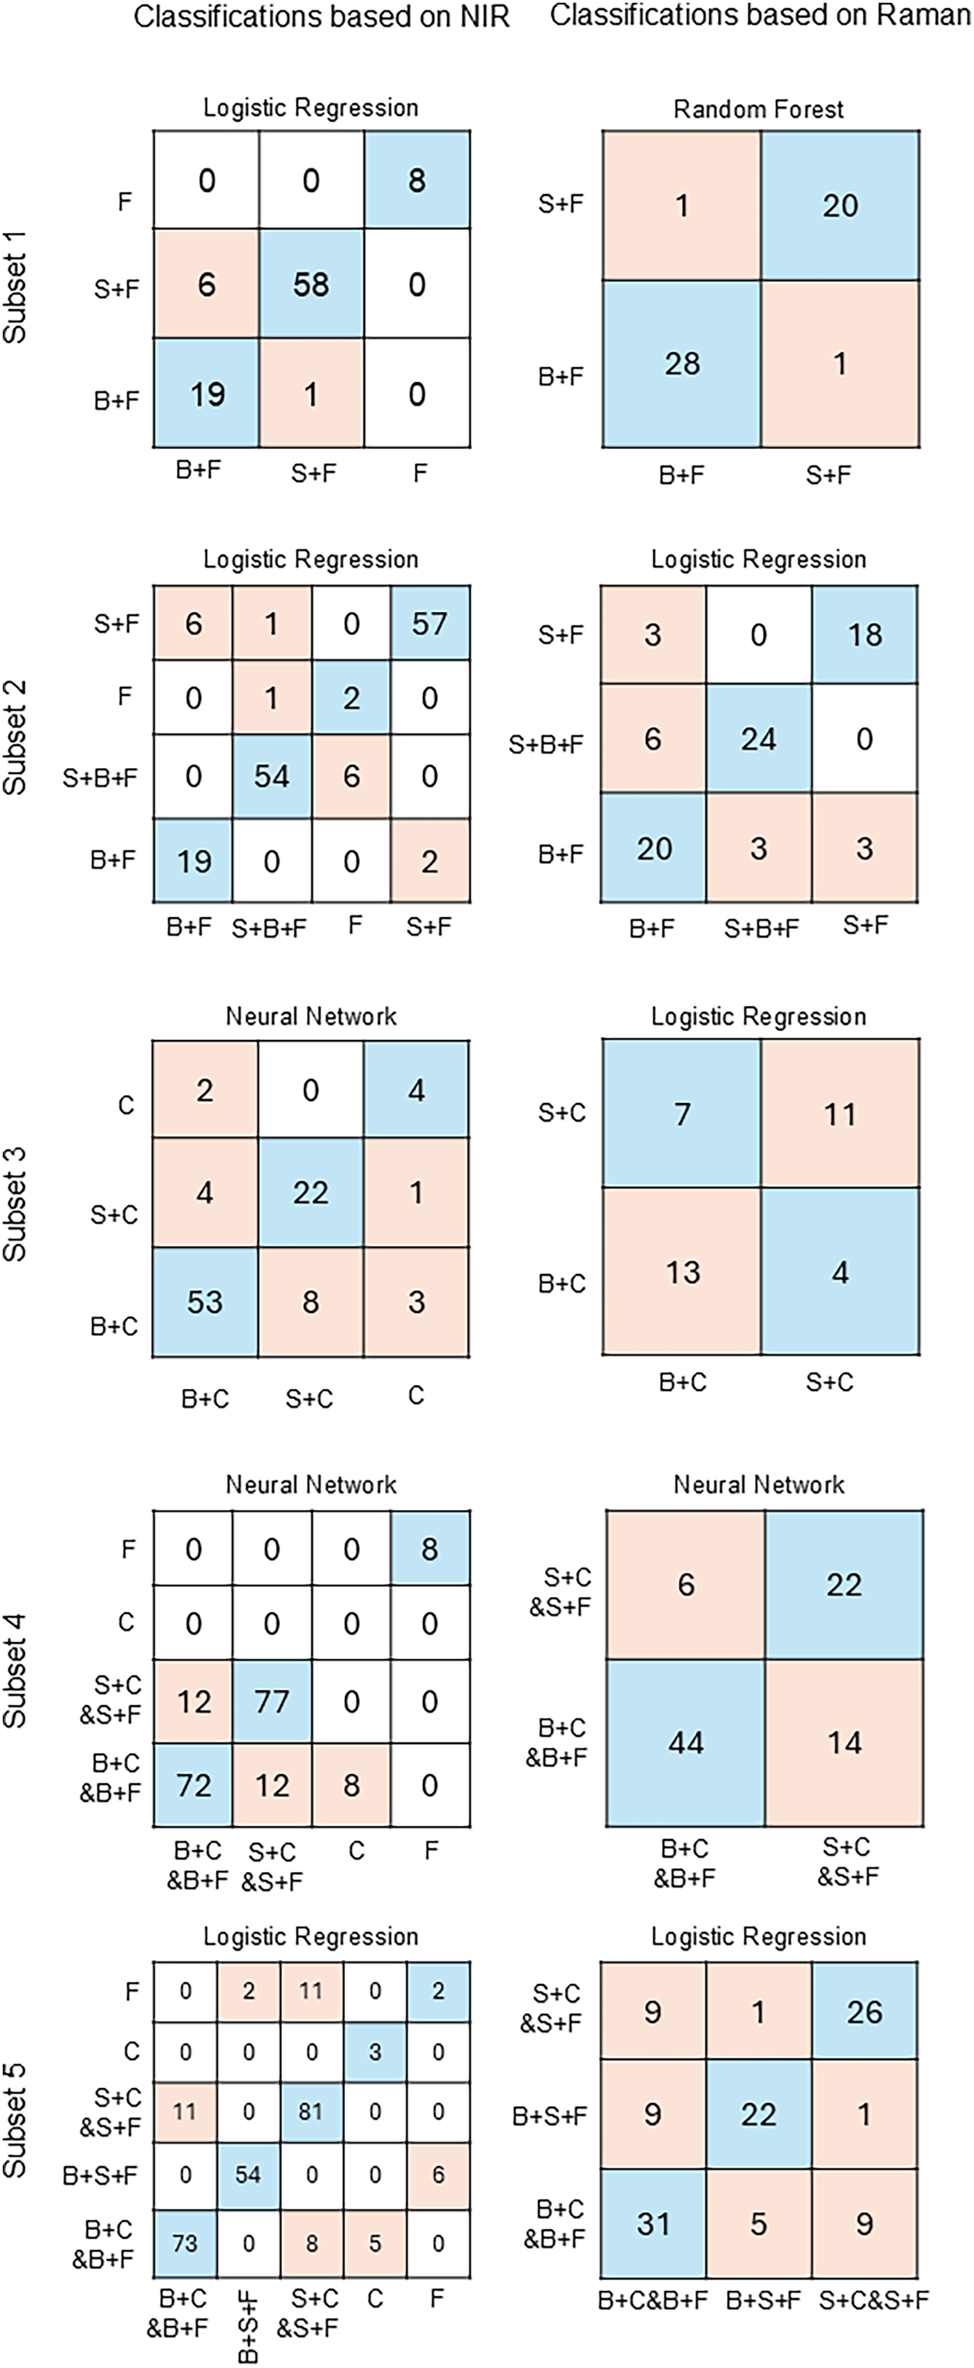
Graphs illustrating the details of most successful classification in each sample subset for both spectroscopic methods. F - filter paper base; C - cellulose sheet base; S - stearic acid added; B - betulinol added.
3.3.1.2 Semi-quantitative classification
To develop a semi quantitative model, the model pulps produced with the cellulose sheet bases were divided into two subsets: model pulps, where different amounts of betulinol were added to the samples and model pulps containing different amounts of stearic acid. Additionally, reference samples were included in each subset (see Table 2). The goal was to check if the algorithms are capable of distinguishing between samples containing different quantities of the same model extractive compound. The results of the classification are shown in Table 5.
Comparison of results of semi-quantitative classification of model pulps and reference samples within two data subsets using five different algorithms and two spectroscopic methods.
| Sample subset | Classification accuracy (%) | ||||||||||
|---|---|---|---|---|---|---|---|---|---|---|---|
| NIR | Raman | ||||||||||
| k-NN | LR | NB | ANN | RF | k-NN | LR | NB | ANN | RF | ||
| 1. | Cellulose sheet-base model pulps containing betulinol | 63.0 | 77.8 | 81.5 | 70.4 | 66.7 | 9.1 | 9.1 | 36.4 | 18.2 | 0.0 |
| 2. | Cellulose sheet-base model pulps containing stearic acid | 76.3 | 73.7 | 86.8 | 89.5 | 84.2 | 23.5 | 23.5 | 29.4 | 23.5 | 5.9 |
-
k-NN - k-nearest neighbors; LR - logistic regression; NB - naïve Bayes; ANN - artificial neural network; RF - random forest.
The CA for the classification based on NIR spectra was significantly higher than based on Raman spectra, but it can be partially caused by the lower number of Raman spectra used for building the models. Interestingly, the best CA for the samples containing different quantities of betulinol was obtained when applying NB for both types of spectroscopies, even though this algorithm performed the worst when used for qualitative classification. Meanwhile, the classification of samples containing stearic acid was the most successful when ANN and NB were used on NIR and Raman spectral data, respectively. The performance of models was usually better when classifying the samples in the second subset.
In Figure 5a, it can be seen that the NB algorithm was always correct when classifying the reference and the sample containing the highest quantity of betulinol. The sample B1 was misclassified half of the time – as either B2 or B3, and the sample B2 was misclassified twice as B3.
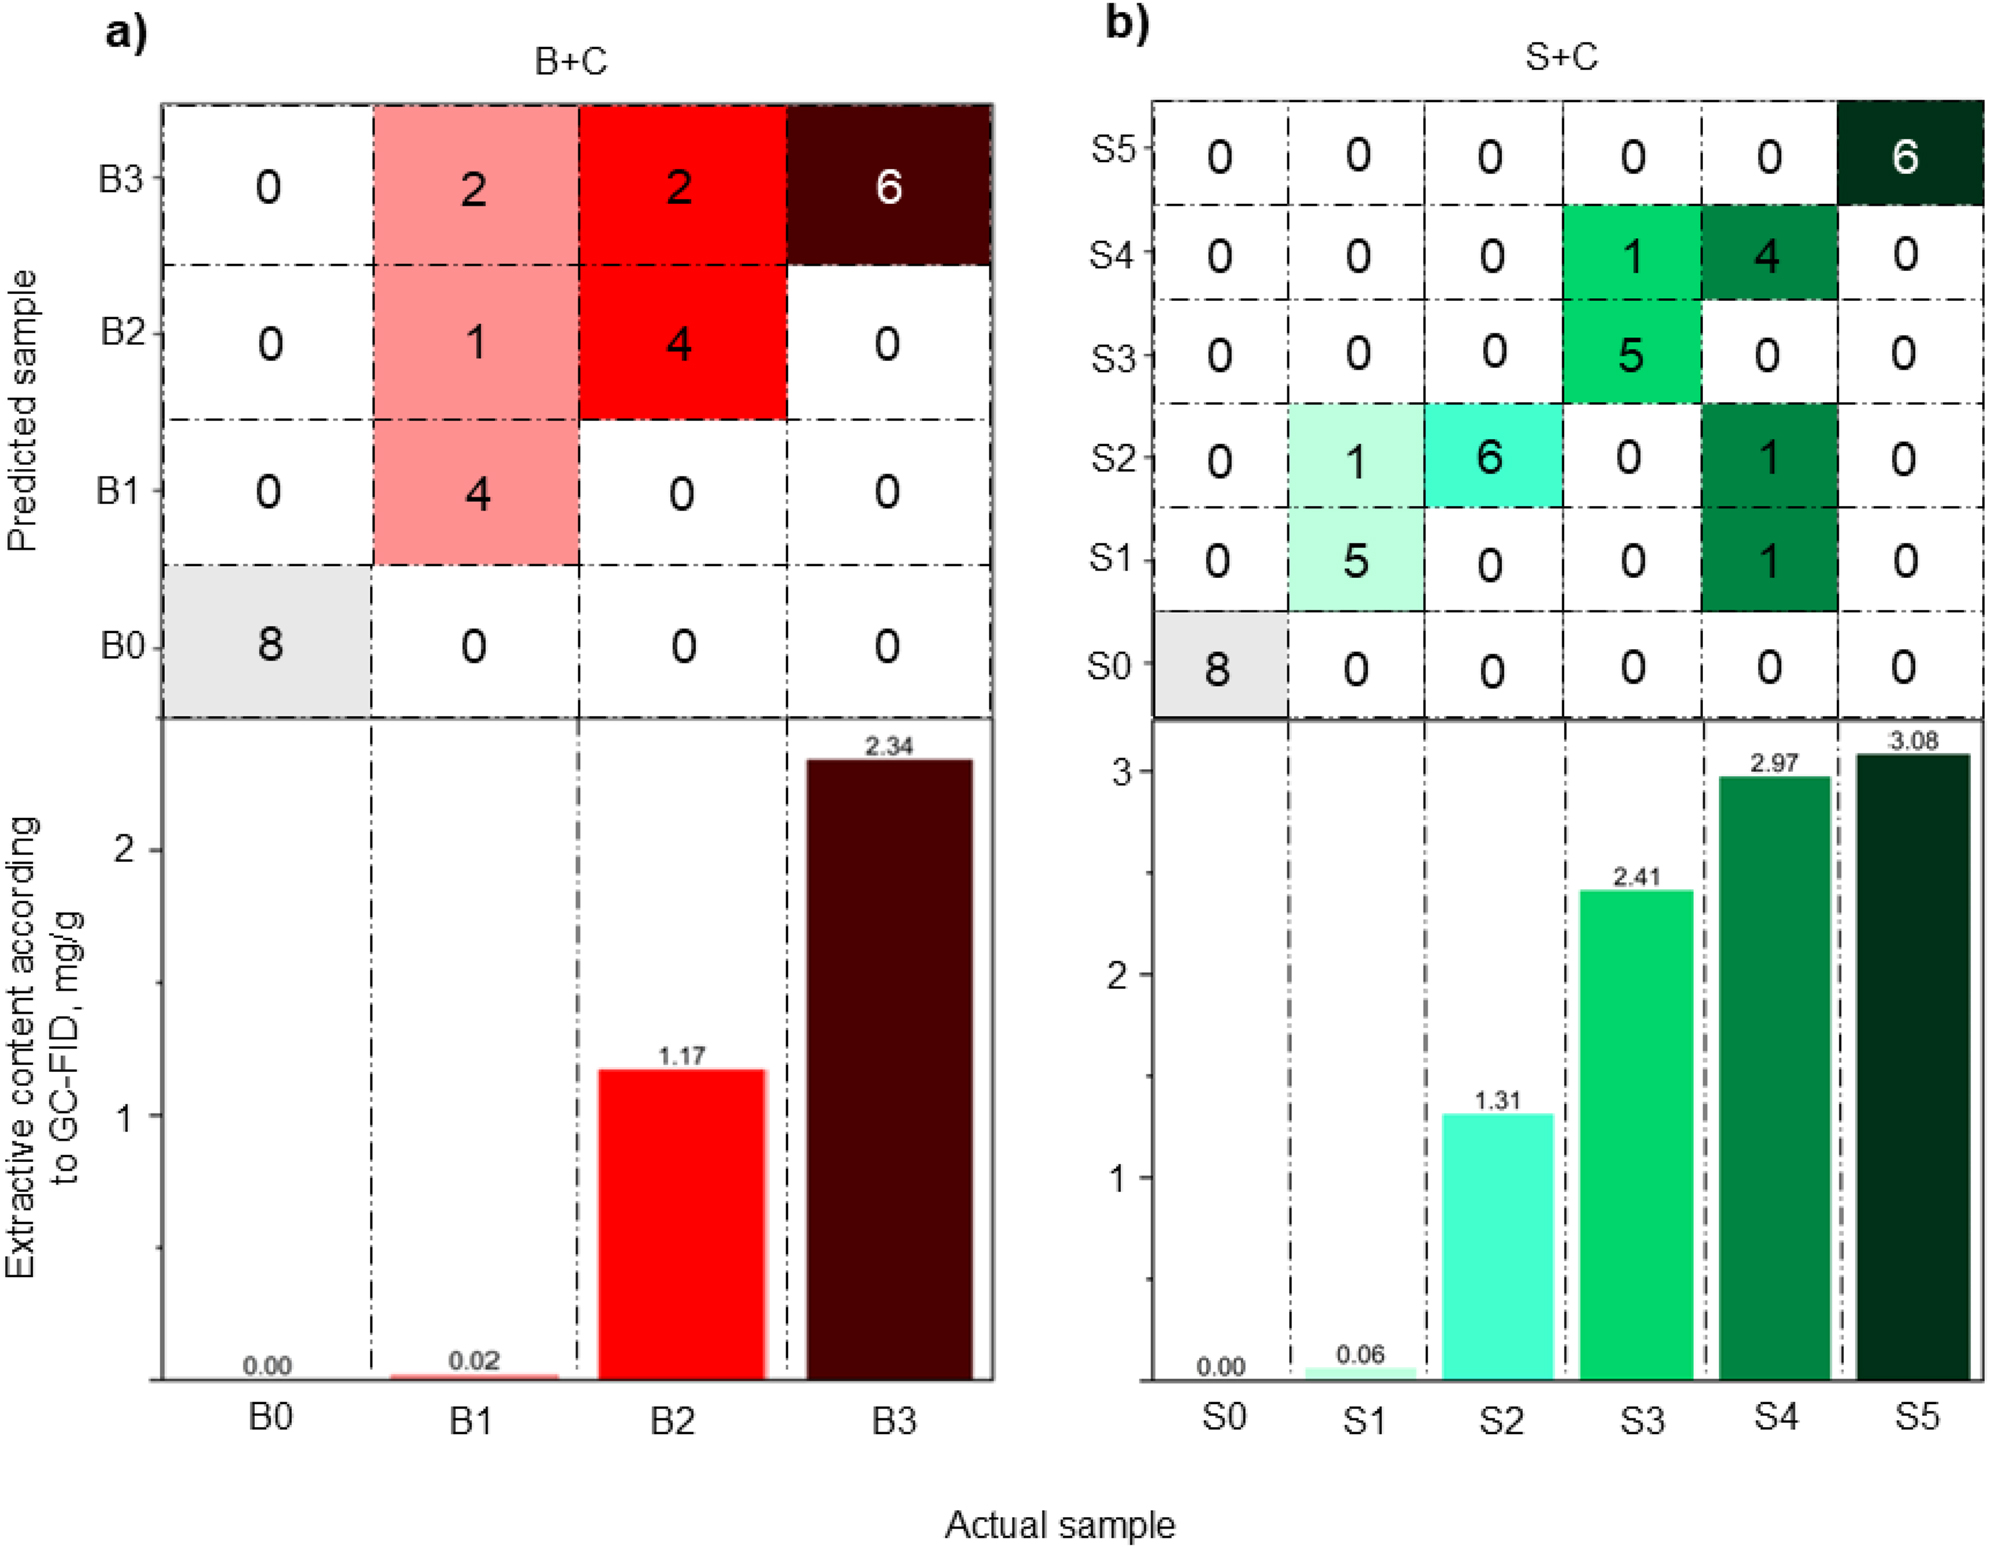
Details of classification by the best performing model for each sample subset and concentrations of extractive compounds added to the model pulps based on NIR spectra. Classification of betulinol-containing model pulps using naïve Bayes (a) and stearic acid-containing model pulps using artificial neural network (b).
As displayed by Figure 5b, it is noticeable that misclassification happened only four times – S4 was misclassified twice: as S1 and S2, while S3 was misclassified as S4 once and S1 was misclassified as S2 once. Surprisingly, the CA of samples containing stearic acid is higher than CA of samples containing betulinol (89.5 % and 81.5 % respectively), despite the fact that there are two more categories in SA-containing sample subset and that there is no large difference in concentrations of the extractive compound between S4 and S5.
3.4 Calibration
In order to choose the optimal combination of pretreatment methods and algorithm for building the model for prediction of extractive content in model pulps, all possible combinations for every sample subset and analyte were tested. The best approach was chosen based on the highest RCV2 and lowest RSECV.
Based on Table 6, it can be noticed that the optimal pretreatment method almost always included normalization combined with Savitzky–Golay filter. In case of NIR, each normalization method was optimal for at least one of the calibrations, while in Raman SNV performed the best in most calibrations. Using Savitzky–Golay filter to smoothen and derivate the spectra was beneficial for all calibration sets and, in the calibrations, based on NIR spectra usually the 2nd or 3rd derivative led to the best results, while 1st derivative was the optimal choice in three calibrations. In Raman-based calibrations S1D is clearly the most favorable smoothing and derivatization method.
Best pretreatment method and algorithm for calibration of the extractives (B - betulinol; S - stearic acid; T - sum of both extractive compounds in a sample) content in each sample subset. R2 and RSE scores for cross-validation (CV) and prediction (P) for each model.
| Sample subset | Analyte | NIR | Raman | ||||||||
|---|---|---|---|---|---|---|---|---|---|---|---|
| Optimal pretreatment and algorithm | R cv 2 | R p 2 | RSECV | RSEP | Optimal pretreatment and algorithm | R cv 2 | R p 2 | RSECV | RSEP | ||
| 1 | B | ANa + S3Db + PLSc | 0.66 | 0.60 | 0.50 | 0.56 | S1D + LnRd | 0.23 | 0.12 | 0.67 | 0.73 |
| S | S1D + MMNe + PLS | 0.64 | 0.66 | 0.46 | 0.45 | S1D + SNVf + LnR | 0.44 | 0.34 | 0.59 | 0.67 | |
| B | SNV + S1D + PLS | 0.47 | 0.53 | 0.62 | 0.55 | S1D + SNV + PLS | 0.11 | 0.01 | 0.66 | 0.69 | |
| 2 | S | S2D + VNg + PLS | 0.35 | 0.42 | 0.65 | 0.61 | S1D + SNV + LnR | 0.41 | 0.37 | 0.59 | 0.65 |
| T | S3D + SNV + PLS | 0.78 | 0.78 | 0.35 | 0.35 | S1D + VN + LnR | 0.33 | 0.25 | 0.44 | 0.49 | |
| 3 | B | S1D + MMN + PLS | 0.22 | 0.09 | 0.67 | 0.75 | – | – | – | – | – |
| S | S3D + PLS | 0.39 | 0.33 | 0.68 | 0.71 | SG0D + MMN + LnR | 0.70 | 0.71 | 0.70 | 0.71 | |
| 4 | B | S2D + SNV + PLS | 0.21 | 0.21 | 0.77 | 0.76 | S1D + SNV + PLS | 0.22 | 0.04 | 0.73 | 0.80 |
| S | S1D + VN + PLS | 0.08 | 0.11 | 0.86 | 0.85 | S1D + VN + LnR | 0.47 | 0.44 | 0.58 | 0.67 | |
| B | S3D + MMN + PLS | 0.30 | 0.28 | 0.69 | 0.71 | S3D + SNV + PLS | 0.43 | 0.24 | 0.58 | 0.68 | |
| 5 | S | S2D + MMN + PLS | 0.29 | 0.30 | 0.71 | 0.70 | S1D + SNV + LnR | 0.35 | 0.43 | 0.62 | 0.60 |
| T | S2D + ANh + PLS | 0.51 | 0.54 | 0.50 | 0.48 | S1D + PLS | 0.33 | 0.31 | 0.56 | 0.58 | |
-
aArea normalization; bSxD, Savitzky–Golay filter (x = 0, 1st, 2nd or 3rd derivative); cpartial least squares; dlinear regression; emin–max normalization; fstandard normal variate; gvector normalization; harea normalization.
PLS was the best-performing algorithm in all calibrations based on NIR spectra, while LnR rather than PLS led to the most accurate prediction of extractives based on Raman spectra most of the time.
The only case, in which it was not possible at all to correlate the spectral data with extractive content was in the third set in the attempt of calibrating betulinol content in the cellulose sheet-based model pulps based on Raman spectroscopy.
Table 6 also summarizes the results of predictive modelling of extractives in model pulp sample subsets. The coefficient of determination (R2) and root standard error (RSE) of cross-validation and prediction are depicted only for the best performing model in each calibration. Generally, high R2 and low RSE indicate that the model can accurately predict the extractive content in the model pulp samples.
As seen in Table 6, all values of R2 for all calibrations are between 0 and 0.78, while RMSE is between 0.35 and 0.86. The highest R2 and lowest RSE values were obtained in the NIR-based prediction of total extractive content in the 2nd subset, which contained filter-paper models spiked with either betulinol, stearic acid or both compounds. Meanwhile, the calibration of betulinol in the 2nd sample subset based on Raman yielded the lowest R2 (0.11 and 0.01 for cross-validation and prediction, respectively). The biggest errors of prediction and of cross-validation, 0.86 and 0.85 respectively, were a result of calibrating the stearic acid content in the 4th sample subset based on Raman.
NIR performed better in the 1st, 2nd and 3rd subsets, while the calibrations in 4th and 5th subset were more accurate when based on Raman. This indicates that Raman could be less affected by the base used for fabricating the model pulps and more selective towards the analytes. The predictions of betulinol content and total extractives in the sample were usually more accurate if based on NIR, but the predictions of stearic acid were more accurate if the model was built using Raman spectra. The reason for that could be that NIR is more sensitive to the two hydroxyl groups in betulinol, while Raman detects the long aliphatic chain of stearic acid better. It also seems that selectivity of NIR towards total extractive content is significantly better than towards betulinol or stearic acid separately.
4 Conclusions
According to authors’ knowledge, this was the first study, that attempted the application of spectroscopic methods for non-destructive detection and quantification of extractives in cellulosic matrices using GC-FID as a reference method. The classification of samples based on the type of cellulosic material used as a sample base and type of extractive added was generally successful, with the best results obtained when using logistic regression on the NIR spectra of the least varied sample subset. The accuracy of the semi-quantitative classification of samples of different extractive contents was higher when the model was developed using NIR spectra (81.5 % and 89.5 % for samples containing betulinol using naïve Bayes and stearic acid using artificial neural network, respectively), rather than Raman. The datasets used to build the classifications based on Raman spectra were significantly smaller than NIR datasets, which could partially explain the worse performance of Raman in the classification. The best calibration result was obtained for quantification of total extractive content based on NIR after pre-treating the spectra with Savitzky–Golay filter 3rd derivative followed by SNV and performing the calibration using PLS algorithm. The coefficient of determination and the RSE for both cross-validation and prediction were 0.78 and 0.35 respectively, meaning that this method could be used for non-selective estimation of extractive content in samples.
Further work must be done to develop a model for predicting the extractive content in commercial pulps using NIR and Raman combined with machine learning. The current work proved that a large variation within a sample subset often leads to poor performance of predictive models. For this reason, the future work will focus on dividing samples into sets, within which the variation is low, and developing a separate model for each set.
Funding source: UPM-Kymmene Oyj
Acknowledgments
The authors would like to express their gratitude towards Jarl Hemming and Andrey Pranovich for their valuable advice on extractive analysis. The authors would also like to thank Pia Damlin for help in establishing the Raman spectroscopy-based analytical method. The authors extend their thanks to Pia Nilsson, Tom Hultholm, Matti Ristolainen, Harri Kosonen and the late Mats Backman for their priceless input in project shaping.
-
Research ethics: Not applicable.
-
Informed consent: Not applicable.
-
Author contributions: All authors have accepted responsibility for the entire content of this manuscript and approved its submission. Julia Chrząstowska: formal analysis, investigation, data curation, writing – original draft, visualization; Tomasz Sokalski: conceptualization, methodology, writing – review & editing; Ekaterina Korotkova: conceptualization, methodology, resources, writing – review & editing; Johan Bobacka: conceptualization, writing – review & editing, supervision, funding acquisition; Anna Sundberg: conceptualization, writing – review & editing; Chunlin Xu: conceptualization, writing – review & editing, supervision, project administration, funding acquisition.
-
Use of Large Language Models, AI and Machine Learning Tools: Orange Data Mining version 3.36.2 (University of Ljubljana, Slovenia) machine learning software was used to pretreat the spectral data and to develop the predictive models based on the spectral data.
-
Conflict of interest: The authors state no conflict of interest.
-
Research funding: This work was funded by UPM-Kymmene Oyj under the Fate of Extractives in Fiber Lines (DETEX) project.
-
Data availability: The data is not available.
References
Antti, H., Sjöström, M., and Wallbäcks, L. (1996). Multivariate calibration models using NIR spectroscopy on pulp and paper industrial applications. J. Chemom. 10: 591–603, https://doi.org/10.1002/(SICI)1099-128X(199609)10:5/6<591::AID-CEM474>3.0.CO;2-L.10.1002/(SICI)1099-128X(199609)10:5/6<591::AID-CEM474>3.3.CO;2-CSearch in Google Scholar
Asikainen, S., Furhmann, A., Robertsén, L., and Robertsén, L. (2010). Effect of birch kraft pulp primary fines on bleaching and sheet properties. BioResources 5: 2173–2183, https://doi.org/10.15376/biores.5.4.2173-2183.Search in Google Scholar
Belt, T., Keplinger, T., Hänninen, T., and Rautkari, L. (2017). Cellular level distributions of Scots pine heartwood and knot heartwood extractives revealed by Raman spectroscopy imaging. Ind. Crops Prod. 108: 327–335, https://doi.org/10.1016/j.indcrop.2017.06.056.Search in Google Scholar
Bergelin, E. and Holmbom, B. (2003). Deresination of birch kraft pulp in bleaching. J. Pulp Pap. Sci. 29: 29–34.Search in Google Scholar
Dou, J., Kögler, M., Kesari, K.K., Pitkänen, L., and Vuorinen, T. (2023). Seasonal dynamics in structural characteristics within bark stems of cultivated willow (Salix sp.) by NMR and time-gated Raman spectroscopy. Green Chem. 25: 1908–1919, https://doi.org/10.1039/D2GC04476E.10.1039/D2GC04476ESearch in Google Scholar
Ek, M., Gellerstedt, G., and Henriksson, G. (2009). Wood chemistry and wood biotechnology, 1st ed. Berlin: De Gruyter.10.1515/9783110213409Search in Google Scholar
Ekman, R. and Holmbom, B. (1989). Analysis by gas chromatography of the wood extractives in pulp and water samples from mechanical pulping of spruce. Nord. Pulp Pap. Res. J. 4: 16–24, https://doi.org/10.3183/npprj-1989-04-01-p016-024.Search in Google Scholar
Fardim, P. (Ed.) (2011). Fibre chemistry and technology. Paper Engineers’ Association, Helsinki.Search in Google Scholar
Fardim, P., Ferreira, M.M.C., and Durán, N. (2002). Multivariate calibration for quantitative analysis of eucalypt kraft pulp by NIR spectrometry. J. Wood Chem. Technol. 22: 67–81, https://doi.org/10.1081/WCT-120004435.Search in Google Scholar
Geladi, P. and Dåbakk, E. (2017) Computational methods and chemometrics in near infrared spectroscopy. In: Lindon, J.C., Tranter, G.E., and Koppenaal, D.W. (Eds.). Encyclopedia of spectroscopy and spectrometry, 3rd ed. Elsevier, pp. 350–355.10.1016/B978-0-12-803224-4.00352-6Search in Google Scholar
Gierlinger, N., Schwanninger, M., Hinterstoisser, B., and Wimmer, R. (2002). Rapid determination of heartwood extractives in Larix sp. by means of Fourier transform near infrared spectroscopy. J. Infrared Spectrosc. 10: 203–214, https://doi.org/10.1255/jnirs.336.Search in Google Scholar
Goodarzi, M., Shahbazikhah, P., Reza Sohrabi, M., Fathabadi, M., and Hassan Nouri, S. (2009). Direct orthogonal signal correction: partial least squares for simultaneous spectrophotometric determination of sulfamethoxazole and trimethoprim in pharmaceutical formulations and synthetic samples. J. Chil. Chem. Soc. 54: 309–313, https://doi.org/10.4067/S0717-97072009000300022.Search in Google Scholar
Gowen, A.A., O’Donnell, C.P., Cullen, P.J., and Bell, S.E.J. (2008). Recent applications of Chemical Imaging to pharmaceutical process monitoring and quality control. Eur. J. Pharm. Biopharm. 69: 10–22, https://doi.org/10.1016/j.ejpb.2007.10.013.Search in Google Scholar PubMed
Gutiérrez, A. (2001). The biotechnological control of pitch in paper pulp manufacturing. Trends Biotechnol. 19: 340–348, https://doi.org/10.1016/S0167-7799(01)01705-X.Search in Google Scholar PubMed
Hayes, D.J. (2011). Analysis of lignocellulosic feedstocks for biorefineries with a focus on the development of near infrared spectroscopy as a primary analytical tool, PhD thesis. Limerick: University of Limerick.Search in Google Scholar
Henriksen, H., Næs, T., Segtnan, V., and Aastveit, A. (2005). Using near infrared spectroscopy for predicting process conditions. a laboratory study from pulp production. J. Infrared Spectrosc. 13: 265–276, https://doi.org/10.1255/jnirs.557.Search in Google Scholar
Holmbom, B. (1999) Extractives. In: Sjöström, E., and Alén, R. (Eds.). Analytical methods in wood chemistry, pulping, and papermaking. Springer, Berlin, pp. 125–148.10.1007/978-3-662-03898-7_5Search in Google Scholar
Holmgren, A., Bergström, B., Gref, R., and Ericsson, A. (1999). Detection of pinosylvins in solid wood of Scots pine using Fourier transform Raman and infrared spectroscopy. J. Wood Chem. Technol. 19: 139–150, https://doi.org/10.1080/02773819909349604.Search in Google Scholar
Ibrahim, A., Oldham, P.B., Conners, T.E., and Schultz, T.P. (1997). Rapid characterization of wood pulp lignin by Fourier transform Raman spectroscopy. Microchem. J. 56: 393–402, https://doi.org/10.1006/mchj.1996.1455.Search in Google Scholar
Ji, Z., Ma, J.-F., Zhang, Z.-H., Xu, F., and Sun, R.-C. (2013). Distribution of lignin and cellulose in compression wood tracheids of Pinus yunnanensis determined by fluorescence microscopy and confocal Raman microscopy. Ind. Crops Prod. 47: 212–217, https://doi.org/10.1016/j.indcrop.2013.03.006.Search in Google Scholar
Kenton, R.C. and Rubinovitz, R.L. (1990). FT-Raman investigations of forest products. Appl. Spectrosc. 44: 1377–1380, https://doi.org/10.1366/000370290789619658.Search in Google Scholar
Lehr, M., Miltner, M., and Friedl, A. (2021). Removal of wood extractives as pulp (pre-) treatment: a technological review. SN Appl. Sci. 3: 886, https://doi.org/10.1007/s42452-021-04873-1.Search in Google Scholar
Li, X., Sun, C., Zhou, B., and He, Y. (2015). Determination of hemicellulose, cellulose and lignin in Moso bamboo by near infrared spectroscopy. Sci. Rep. 5: 17210, https://doi.org/10.1038/srep17210.Search in Google Scholar PubMed PubMed Central
Márquez, K., Jiménez-Aspee, F., Márquez, N., Salgado, P., and Contreras, D. (2023). Use of NIR spectroscopy and multivariate regression for prediction of pentosan content in wood pulp. Eur. J. Wood and Wood Prod. 81: 547–555, https://doi.org/10.1007/s00107-022-01896-2.Search in Google Scholar
Mostafapour, S., Dörfer, T., Heinke, R., Rösch, P., Popp, J., and Bocklitz, T. (2023). Investigating the effect of different pre-treatment methods on Raman spectra recorded with different excitation wavelengths. Spectrochim. Acta Part A: Mol. Biomol. Spectrosc. 302: 123100, https://doi.org/10.1016/j.saa.2023.123100.Search in Google Scholar PubMed
N’Guessan, J.L.L., Niamké, B.F., Yao, N.J.C., and Amusant, N. (2023). Wood extractives: main families, functional properties, fields of application and interest of wood waste. For. Prod. J. 73: 194–208, https://doi.org/10.13073/FPJ-D-23-00015.Search in Google Scholar
Nuopponen, M., Willför, S., Jääskeläinen, A.-S., Sundberg, A., and Vuorinen, T. (2004a). A UV resonance Raman (UVRR) spectroscopic study on the extractable compounds of Scots pine (Pinus sylvestris) wood. Part I: lipophilic compounds. Spectrochim. Acta Part A: Mol. Biomol. Spectrosc. 60: 2953–2961, https://doi.org/10.1016/j.saa.2004.02.008.Search in Google Scholar PubMed
Nuopponen, M., Willför, S., Jääskeläinen, A.-S., and Vuorinen, T. (2004b). A UV resonance Raman (UVRR) spectroscopic study on the extractable compounds in Scots pine (Pinus sylvestris) wood. Part II. Hydrophilic compounds. Spectrochim. Acta Part A: Mol. Biomol. Spectrosc. 60: 2963–2968, https://doi.org/10.1016/j.saa.2004.02.007.Search in Google Scholar PubMed
Opitz, J. (2024). A closer look at classification evaluation metrics and a critical reflection of common evaluation practice. Trans. Assoc. Comput. Linguist. 12: 820–836, https://doi.org/10.1162/tacl_a_00675.Search in Google Scholar
Peris-Díaz, M.D. and Krężel, A. (2021). A guide to good practice in chemometric methods for vibrational spectroscopy, electrochemistry, and hyphenated mass spectrometry. Trends Anal. Chem. 135: 116157, https://doi.org/10.1016/j.trac.2020.116157.Search in Google Scholar
Piccand, M., Bianchi, S., Halaburt, E.I., and Mayer, I. (2019). Characterization of extractives from biomasses of the alpine forests and their antioxidative efficacy. Ind. Crops Prod. 142: 111832, https://doi.org/10.1016/j.indcrop.2019.111832.Search in Google Scholar
Poke, F.S. and Raymond, C.A. (2006). Predicting extractives, lignin, and cellulose contents using near infrared spectroscopy on solid wood in Eucalyptus globulus. J. Wood Chem. Technol. 26: 187–199, https://doi.org/10.1080/02773810600732708.Search in Google Scholar
Poke, F.S., Wright, J.K., and Raymond, C.A. (2005). Predicting extractives and lignin contents in Eucalyptus globulus using near infrared reflectance analysis. J. Wood Chem. Technol. 24: 55–67, https://doi.org/10.1081/WCT-120035944.Search in Google Scholar
Renaud, O. and Victoria-Feser, M.-P. (2010). A robust coefficient of determination for regression. J. Stat. Plann. Inference 140: 1852–1862, https://doi.org/10.1016/j.jspi.2010.01.008.Search in Google Scholar
Saggu, M., Liu, J., and Patel, A. (2015). Identification of subvisible particles in biopharmaceutical formulations using Raman spectroscopy provides insight into polysorbate 20 degradation pathway. Pharm. Res. 32: 2877–2888, https://doi.org/10.1007/s11095-015-1670-x.Search in Google Scholar PubMed PubMed Central
Stewart, D., Wilson, H.M., Hendra, P.J., and Morrison, I.M. (1995). Fourier-transform infrared and Raman spectroscopic study of biochemical and chemical treatments of oak wood (Quercus rubra) and barley (Hordeum vulgare) straw. J. Agric. Food Chem. 43: 2219–2225, https://doi.org/10.1021/jf00056a047.Search in Google Scholar
Streamer, R.W. (2013) What NIR instruments to use. In: Commercial application of IR spectroscopies to solid wood, Auckland, Australia, 11 June. https://www.researchgate.net/publication/261100154_Workshop_on_commercial_application_of_IR_spectroscopies_to_solid_wood (Accessed 20 November 2024).Search in Google Scholar
Taylor, A.M., Freitag, C., Cadot, E., and Morrell, J.J. (2008). Potential of near infrared spectroscopy to assess hot-water-soluble extractive content and decay resistance of a tropical hardwood. Holz als Roh- und Werkst. 66: 107–111, https://doi.org/10.1007/s00107-007-0214-4.Search in Google Scholar
Valette, N., Perrot, T., Sormani, R., Gelhaye, E., and Morel-Rouhier, M. (2017). Antifungal activities of wood extractives. Fungal Biol. Rev. 31: 113–123, https://doi.org/10.1016/j.fbr.2017.01.002.Search in Google Scholar
Wagner, K., Musso, M., Kain, S., Willför, S., Petutschnigg, A., and Schnabel, T. (2020). Larch wood residues valorization through extraction and utilization of high value-added products. Polymers 12: 359, https://doi.org/10.3390/polym12020359.Search in Google Scholar PubMed PubMed Central
Willför, S., Hemming, J., Reunanen, M., Eckerman, C., and Holmbom, B. (2003). Lignans and lipophilic extractives in Norway spruce knots and stemwood. Holzforschung 57: 27–36, https://doi.org/10.1515/HF.2003.005.Search in Google Scholar
Wójciak, A., Kasprzyk, H., Sikorska, E., Krawczyk, A., Sikorski, M., and Wesełucha-Birczyńska, A. (2014). FT-Raman, FT-infrared and NIR spectroscopic characterization of oxygen-delignified kraft pulp treated with hydrogen peroxide under acidic and alkaline conditions. Vib. Spectrosc. 71: 62–69, https://doi.org/10.1016/j.vibspec.2014.01.007.Search in Google Scholar
© 2025 the author(s), published by De Gruyter, Berlin/Boston
This work is licensed under the Creative Commons Attribution 4.0 International License.
Articles in the same Issue
- Frontmatter
- Editorial
- The 17th European Workshop on Lignocellulosics and Pulp (EWLP) in Turku/Åbo, Finland (August 26–30, 2024)
- Wood Chemistry
- Exploring the potential of ammoxidation of lignins to enhance amide-nitrogen for wood-based peat alternatives and its impact on plant development
- Supercritical carbon dioxide extraction of crude tall oil: an alternative upgrading approach
- Wood Technology/Products
- Swelling of cellulose stimulates etherification
- Machine learning-assisted spectrometric method for pulp extractive analysis based on model pulps