Flexural behavior of wood in the transverse direction investigated using novel computer vision and machine learning approach
-
Shuoye Chen
 ,
Tatsuya Awano
,
Tatsuya Awano


Abstract
A deep-learning-based semantic segmentation approach (U-Net) was used to partition the anatomical features in the cross-section of hinoki (Chamaecyparis obtusa) wood during a micro three-point bending test. Using the Crocker–Grier linking algorithm, thousands of cells were successfully extracted, and several parameters (area, eccentricity, fitted ellipse aspect ratio, bounding box aspect ratio) were used to evaluate the intensity of the cells’ deformation. Thus, the 2D map of the deformation intensity distribution was constructed. By analyzing flat-sawn, quarter-sawn, and rift-sawn specimens, it was confirmed that the annual ring orientation affects the flexural behavior of wood in the transverse direction. The quarter-sawn specimens exhibited the largest modulus of elasticity (MOE) and modulus of rupture (MOR). The ray tissue aligned against the load may have contributed to the restriction of cell deformation. The rift-sawn specimens exhibited the smallest MOE and MOR, possibly owing to the loading of the specimen in the in-plane off-axial direction, which induced the shear deformation of the cell wall. For all three specimen types, the fracture had high occurrence probability in the tension part of the specimen, which exhibited large cell deformation. Therefore, the proposed method can be adapted to the prediction of wood specimen fractures. With different test wood species, this approach can be of great help in elucidating the relationship between the anatomical features and the mechanical behavior of wood to improve the effective utilization of wood resources.
1 Introduction
Wood is a natural cellular material with complex structure and different cell types (anatomical features) acting together to serve the needs of the living tree (Robert 2010). As an anisotropic material, wood has excellent mechanical properties parallel to the grain (longitudinal direction), while its mechanical properties perpendicular to the grain (transverse direction) are relatively weak and vary among different wood species in accordance with the species’ unique anatomical features (Gibson and Ashby 1998; Robert 2010).
Since ancient times, humans have used wood as a construction material and considered the microstructure of wood in the transverse direction. A relevant example is the traditional Japanese roofing method called kokerabuki (Harada 1999; Yokoyama 2016). In this method, quarter-sawn boards with a thickness of 2–3 mm, width of 90–150 mm, and length of 300 mm are stacked on the flat part of the roof, while rift-sawn boards are used for the curved surface of the roof, owing to their excellent flexibility in the transverse direction, of which Japanese artisans are aware through empirical knowledge. Understanding the relationship between the anatomical features and the mechanical behavior of wood is important for improving the effective utilization of wood resources. To clarify this relationship, wood scientists have developed several approaches from two main perspectives.
The first perspective is the top-down one, which refers to the direct microscopic observation of the deformation of anatomical features during or after a mechanical test. Ando and Onda (1999a) used a wet-type scanning electron microscope (SEM) to observe the compression of wood cell walls. Combined with image analysis, they found that the first fracture of the cell wall occurred in one tangential row of the earlywood tracheid just after the load–displacement curve exceeded the proportional limit. Müller et al. (2003) observed the cell deformation of both softwood (spruce) and hardwood (oak and beech) at different yielding stages of the compression test using a SEM and a light microscope to obtain the different fracture patterns of the anatomical features of these species. Murata et al. (1999) used the digital image correlation (DIC) approach to analyze the video taken during compression test of wood in the radial direction by microscope. By applying a random speckle on the surface of the cross-section, the strain distribution was successfully calculated, which suggests the DIC is a useful method for understanding the mechanical behavior of wood. Hwang et al. (2021) used the replica method to intermittently analyze the cell wall deformation of flat-sawn, quarter-sawn, and rift-sawn specimens in the transverse direction of wood subjected to a three-point bending test. The rift-sawn softwood specimen exhibited a unique deformation pattern of the earlywood cell wall, which contributed to extremely large flexural deformation. These direct microscopic observation methods combined with image analysis have provided important information that improve our understanding of the in-situ deformation of wood microstructures.
The second perspective is the bottom-up one, which refers to the mechanical simulation of wood properties with consideration to its hierarchical structure. Watanabe et al. (1999, 2000, 2002 first used fast Fourier transform (FFT) to extract the axial length of the tangential and radial cell wall, cell wall thickness, and so on, of several conifer wood species to simulate the tangential Young’s modulus through cell wall modeling. Ando and Onda (1999b) used the generalized cell wall model to simulate the first buckling mechanism of the conifer wood cell wall under radial compression. Holmberg et al. (1999) employed the finite element method (FEM) to simulate the nonlinear mechanical behavior with consideration to the irregular cell shape, anisotropic layer structure of the cell walls, and periodic variations of wood density. The simulated deformation and fracture of wood were similar to those observed in the process of wood refinement. De Magistris and Salmén (2008) used FEM models to investigate the compression and combined shear and compression deformation of a cell wall with anisotropic one-layer cell walls and an orthotropic multi-layer cell wall. They found that cell structures are key factors influencing the deformation pattern. Recently, the multi-scale FEM was used to simulate the compression behavior of wood under both axis and transverse loading (Zhong et al. 2021). It was found that the transverse deformation of wood is gradual and uniform, while the loading velocity greatly affects the wood microstructure failure modes under loading in the axial direction. The above-mentioned approaches are useful in elucidating the mechanical behavior of wood.
Computer vision technologies have become quite prevalent even in wood science, and those techniques have been usually used to address wood species identification and property prediction problems. Recently, they have been used for semantic segmentation, such as the automatic extraction of individual cell types (Hwang and Sugiyama 2021). With the advent of deep-learning-based semantic segmentation approaches, such as U-Net (Ronneberger et al. 2015), LinkNet (Chaurasia and Culurciello 2017), and Feature Pyramid Network (Lin et al. 2017), Garcia-Pedrero et al. (2020) successfully segmented xylem vessels from cross-sectional micrographs by using U-Net, a multi-scale encoder-decoder model based on convolutional neural network (CNN). If such semantic segmentation can be adapted to the analysis of wood cell deformation, it will be able to simultaneously analyze almost all local changes in the anatomical features and their interaction during a mechanical test. The obtained information can enable us more accurate and quantitative image analysis in the top-down approaches, while the collected cell wall geometry will contribute to parameter settings for mechanical simulation in the bottom-up approaches. This study presents a flow to achieve individual cell tracking to accurately analyze the morphological changes of the individual tracheid of hinoki wood that are extracted by semantic segmentation and their local deformation during a micro three-point bending test.
2 Materials and methods
2.1 Specimen preparation
This study investigated mature Hinoki (Chamaecyparis obtusa) wood. Three sample types (flat-sawn, rift-sawn, and quarter-sawn) were first prepared only from sapwood with consideration to the orientation of the annual ring, which was confirmed by visual observation. The angle of the annual ring aligned in the horizontal direction and vertical direction was 0° and 90°, respectively. The sample with an annual ring angle of 0°–30° was defined as flat-sawn, that with a ring angle of 30°–60° was defined as rift-sawn, and that with a ring angle of 60°–90° was defined as quarter-sawn. Five flat-sawn, quarter-sawn, and rift-sawn, specimens were prepared with the dimensions of 10 mm (longitudinal) × 20 mm (width) × 1.5 mm (thickness), respectively. The cross-section of all specimens was smoothed by a sliding microtome (TU-213, Yamato Kohki industrial Co., Ltd., Japan). Then, all specimens were conditioned in a plastic glove box at 60% relative humidity (RH) and 25 °C using sodium bromide solution for more than two weeks. The average density and moisture content of specimens with standard deviation (SD) in parenthesis were 399 (17) (kg/m3) and 11.1 (0.3) %, respectively.
2.2 Micro three-point bending test
After the conditioning, all specimens were subjected to the micro three-point bending test. A customized metal jig (Figure1a) was used for testing. A motor (BLM230P-GFV2, ORIENTAL MOTOR Co., Ltd., Japan) with a test speed of 1 mm/min was used to horizontally bend the specimens. A 200-N load cell (LUR-A-200NSA1, Kyowa Electronic Instruments Co., Ltd., Japan) with a sensor interface (PCD-320 A, Kyowa Electronic Instruments Co., Ltd., Japan) was used to record the force; the sampling speed was 1 Hz. During the test, a stereo-microscope (Leica DMS300, Leica Camera AG, Germany) was set perpendicularly to the cross-section to record the deformation of the tracheid cells on video at 30 fps. The resolution was 1080p; the length of one pixel is equal to approximately 2.09 µm. All experiments were conducted at 60% RH and 25 °C.

Illustration of micro three-point bending test: (a) Illustration of mechanical test apparatus: (b) cross-section of wood specimen observed with stereo-microscope.
2.3 Deep learning based semantic segmentation model
To prepare the model training dataset, after capturing the video during the bending test, the first image at every second of the video was captured to compile an image sequence. Twelve original images with 256 × 256 pixels were randomly cropped from the image sequence. The watershed segmentation implemented by the Python Mahotas package was first applied to label the boundary of the tracheid cells (Figure 2b) (Coelho 2013; Vincent and Soille 1991). The unlabeled part was manually modified to make the corresponding ground truth masks. The boundaries were labeled at the centerline of the adjacent cell walls. For a tracheid cell wall adjacent to the ray parenchyma cells, owing to the low contrast of the ray parenchyma cell lumen, the boundaries were always labeled at the center part of the ray parenchyma cell, which means that part of a ray parenchyma cell was recognized as a tracheid cell (Figure 2b). In future work, the parenchyma cell walls should be labeled separately and the microscopic observation method should be improved.

Preparation of dataset for semantic segmentation model training: (a) cropped patch of wood cross-section; (b) trachied cell boundary mask labeled by watershed segmentation algorithm; (c) manually corrected image mask. The scale bar indicates a length of 100 μm.
Twelve sets of original images, and the corresponding ground truth masks with the cell boundaries labeled in white and the background labeled in black, were used to build the semantic segmentation model. For model training, the symmetric U-Net architecture, which is achieved by using the “same” padding instead of “valid” in the original model (Ronneberger et al. 2015) was used. The network was implemented using the Tensorflow framework (ver. 1.5.0) and Keras (ver. 2.2.4). The binary cross-entropy was used as the loss function, and Adam was used as the optimizer. The learning rate was 0.0001. During model training, the images were augmented by the image generator. The details of augmentation parameters were shown in Supplementary Table S1.
2.4 Model evaluation metrics
Four metrics, namely, precision, recall, F1, and accuracy, were used to evaluate the trained model. These metrics were calculated from the true positive (TP), false positive (FP), true negative (TN), and false negative (FN) obtained from the confusion matrix for the binary classification of the cell boundary and background. The following equations were used:
2.5 Image prediction and individual cell tracking
After model training, the trained model assisted by a patch blending algorithm (Chevalier 2017) was used to partition all potential cells in the image sequence with 1920 pixels × 1080 pixels. After predicting all image sequences, watershed segmentation was used to achieve the instance segmentation of all cells. Finally, the coordinates of the centroid of the segmented cells were collected, and a tracking algorithm (Crocker and Grier 1996) implemented using the Python Trackpy package was used to link the same cell walls in each image (Allan et al. 2021). Figure 3 is the sample data indicating the processes of watershed segmentation (Figure3a), coordinate extraction of centroids (Figure3b), and individual cell tracking (Figure3c) described above with 256 X 256 pixels image.

Tracking of cell deformation during mechanical test: (a) watershed segmentation of predicted image by trained U-Net model to achieve instance segmentation; (b) centroid coordinates for each cell extracted as features for individual cell tracking; (c) centroid trajectories obtained by Crocker–Grier linking algorithm; the color of each trajectory was randomly generated.
2.6 Parameter measurement for cell deformation analysis
After tracking the individual cells that existed in every image sequence, the area, eccentricity, major and minor axis length of the fitted ellipse (Figure 4 ① ②), and the vertical and horizontal length of the bounding box (Figure 4 ③ ④) for each cell wall were measured. The eccentricity was calculated from the fitted ellipse with the same second moments as the cell wall. The eccentricity of a circle is zero, while the eccentricity of an ellipse is greater than zero but less than one. These measurements were made using the Python scikit-image package (Van Der Walt et al. 2014). The fitted ellipse aspect ratio and bounding box aspect ratio were calculated based on the following equations:

Measurement parameters for evaluating intensity of cell deformation.
To evaluate the intensity of the cell deformation, the changes in the area, eccentricity, fitted ellipse aspect ratio, and bounding box aspect ratio were calculated based on the following equation:
where n indicates the order of the observed image sequence and i indicates the type of the measured parameters shown in Figure 4.
3 Results and discussion
3.1 Flexural behavior of flat-sawn, quarter-sawn, and rift-sawn specimens in the transverse direction
Figure 5 shows the difference in the mechanical properties of the flat-sawn, quarter-sawn, and rift-sawn specimens in the transverse direction. During the micro three-point bending test, the rift-sawn specimens exhibited the smallest load values with the largest displacement of approximately 3.3 mm, which resulted in the smallest modulus of elasticity (MOE) and modulus of rupture (MOR) (Figure 5a). Assuming that the linear stage of calculated stress-strain is the elastic region and the nonlinear stage is the plastic region, the rift-sawn specimens had the largest plastic region. In contrast, the quarter-sawn specimens exhibited the largest MOE and MOR (Figure 5b) and had the smallest plastic region. These results are consistent with the results obtained by a previous study (Hwang et al. 2021), which suggests that the orientation of the annual ring contributes significantly to the flexural behavior of wood in the transverse direction, and also demonstrates that the micro three-point bending test system is reliable for the investigation of the mechanical properties of wood in the transverse direction.

Mechanical properties of flat-sawn, quarter-sawn, and rift-sawn hinoki specimens in the transverse direction: (a) load–displacement curve of three types of hinoki specimens during micro three-point test; (b) MOE and MOR of three specimen types. The error bars indicate the standard deviation.
3.2 Validation of U-Net model and large image prediction
With the development of artificial intelligence, fully convolutional network (FCN) models have been proposed for semantic segmentation (Long et al. 2015). The U-Net architecture was proposed by Ronneberger et al. 2015 as an improvement of FCN and is designed to use fewer training samples for model training. The U-Net architecture is a U-shaped architecture consisting of encoder blocks, decoder blocks, and skip connections, and has become a popular approach for semantic segmentation tasks. Recently it was extensively investigated to conduct even 3D segmentation of several kinds of plant tissues and achieved excellent accuracy (Wonly et al. 2020).
Figure 6a shows the evolution of the binary cross-entropy loss during training for 100 epochs with the U-Net architecture. After training for approximately 40 epochs, the validation loss tended to become approximately constant and training loss continued to decrease to approximately 0.1. The average values (SD) of precision, recall, F1, and accuracy of five test images are 0.82 (0.02), 0.82 (0.02), 0.82 (0.02), and 0.92 (0.01), respectively, which indicates that the constructed semantic segmentation model is accurate. Figure 6b shows an example of the original input image, and Figure 6c shows the image predicted by the trained model. The large image of the cross-section was satisfactorily predicted by combining the patch blending algorithm and the trained model Supplementary Figure S1. Most tracheid cells appeared to be satisfactorily segmented, whereas the partition of the latewood tracheid cells and some earlywood cell walls were not satisfactorily predicted, owing to the low contrast of the cell wall lumen. To overcome this problem, the microscopic observation method must be improved to increase the contrast of the cell wall lumen.
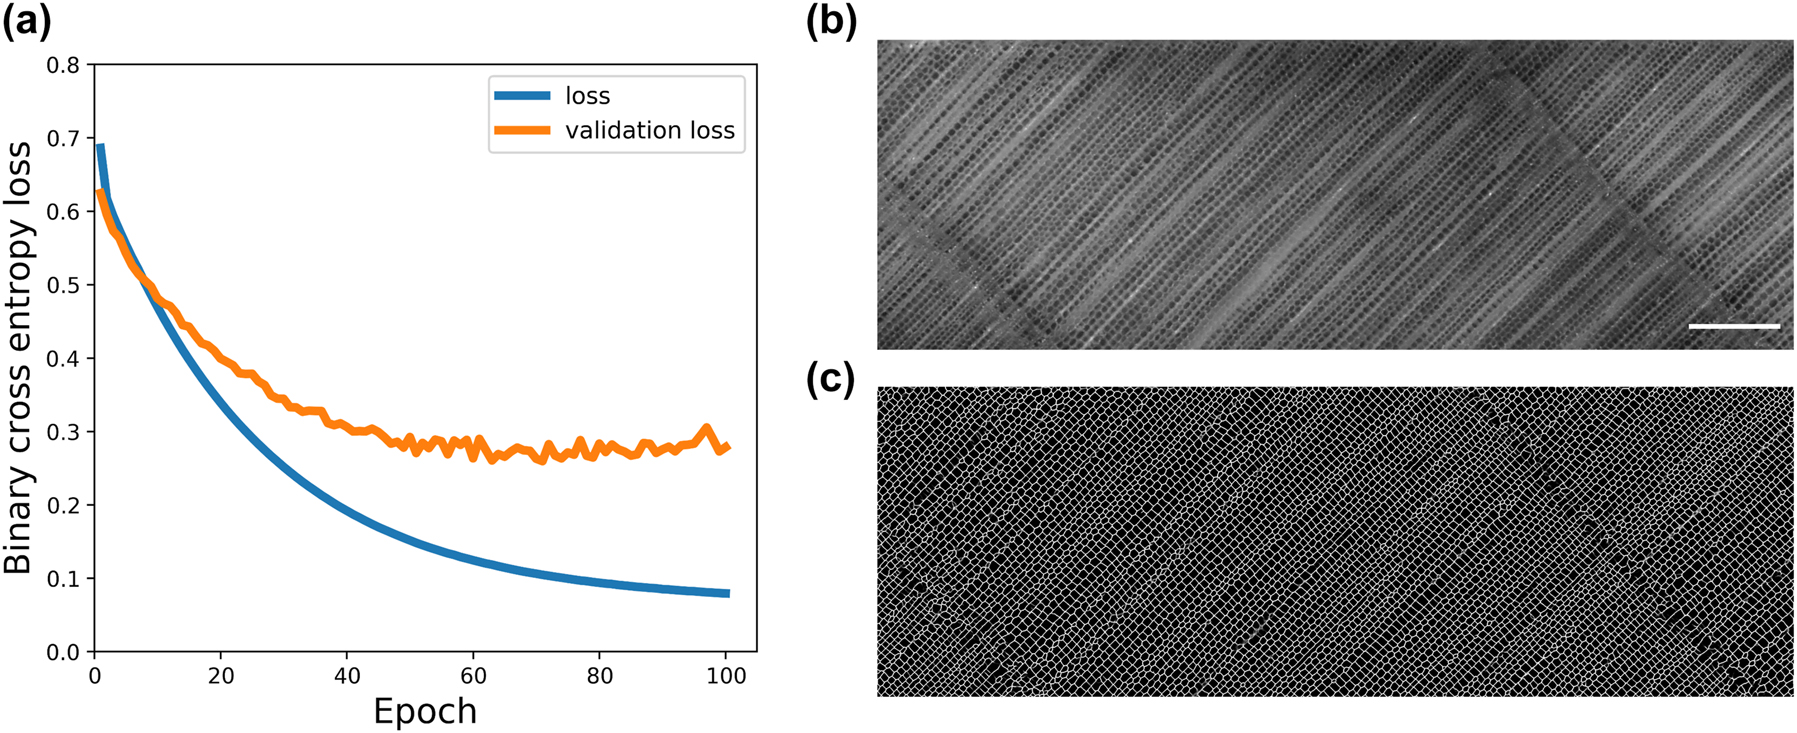
Tracheid cell boundary prediction by trained U-Net model: (a) binary cross-entropy loss plotted against training epochs; (b) original image input; (c) predicted image. The scale bar indicates the length of 400 μm.
The geometrical parameters of a flat-sawn specimen were measured to further confirm the segmentation accuracy. The vertical bounding box and horizontal bounding box were considered as the cell radial diameter and cell tangential diameter. Figure 7 shows the distribution of the typical parameters measured from the segmented cells. The averaged values (SD) of the area, cell eccentricity, cell radial diameter, and cell tangential diameter are 955 μm (306), 0.60 (0.15), 37.5 μm (7.6), and 34.8 μm (6.6), respectively. These parameters are consistent with the geometrical parameters reported by a previous study (Saiki 1963).

Histogram and density plot indicating the distribution of typical parameters measured from flat-sawn specimen before mechanical test: (a) cell area (µm2); (b) cell eccentricity; (c) cell diameter (µm) (yellow: cell radial diameter; gray: cell tangential diameter).
3.3 Typical deformation patterns of tracheid cell in three specimen types
Figure 8 shows the typical deformation patterns of a tracheid earlywood cell wall located in both compression and tension part of the three specimen types during the micro three-point bending test. For the flat-sawn specimens, the compressive and tensile stress likely induced the uniaxial compression and elongation of the cell in the tangential direction, respectively. Due to the Poisson effect, the radial cell width of the cell located at the tension part decreased (Figure 8a). Owing to the orthogonal orientation of the cell, similar deformation seems to be observed in the radial direction of quarter-sawn specimens. Because the quarter-sawn specimens fractured at the early stage of the bending test, when the displacement was only approximately 1 mm, the dimensional changes of the cell were much smaller than those of the flat-sawn specimens while the Poisson effect was confirmed at both compression and tension part (Figure 8b).

Typical deformation pattern of tracheid cell for (a) flat-sawn, (b) quarter-sawn, and (c) rift-sawn specimens before fracture. The scale bar indicates a length of 50 μm.
Unlike the flat-sawn and quarter-sawn specimens, the cell wall in the rift-sawn specimens exhibited different deformation patterns. The shear deformation of the cell walls was both observed in compression part and tension part (Figure 8c). Murata and Masuda (2003) analyzed the strain distribution of softwood in transverse compression by DIC method. And the large shear strain was observed in the case of the compression of rift-sawn type specimen, and they proposed the rolling shear of the cell wall contributed to such large shear strain distribution, which is consistent with our observation. Furthermore, this orientation of the tracheid cells is somewhat similar to the uniaxial loading of honeycombs in the in-plane off-axial direction. Li et al. (2018) simulated the in-plane yield strength of square honeycombs in different directions under compression using a theoretical approach and the FEM method. They concluded that square honeycombs exhibit strong anisotropy when loaded in different orientations. Their numerical simulation results revealed that the axial yield strength of the square honeycomb has minimum values at an angle of orientation of 37°–38°, which is in the range of the orientation of the annual ring of the rift-sawn specimens. Therefore, it is thought that the shear deformation induced by the off-axis loading of the tracheid cell is responsible for the large displacement and low MOE and MOR of rift-sawn specimens.
3.4 Visualization of distribution of tracheid cell deformation
Using the Crocker–Grier linking algorithm, the coordinates of the centroids for each common tracheid cell that existed in each frame of the image sequence were linked, and thousands of common cells were extracted. These common cells were mainly the earlywood cells, which had sufficient cell wall lumen contrast. The latewood cells and earlywood cells, which had low cell wall lumen contrast along the radial direction, were not linked owing to their bad segmentation.
After evaluating the intensity of the deformation by calculating the changes in the four parameters (area, eccentricity, fitted ellipse aspect ratio, and bounding box aspect ratio) described in Section 2, suitable parameters for evaluating cell deformation were selected by considering the different types of cell deformation in three specimen types. The area and bounding box aspect ratio were selected for evaluating the cell deformation of flat-sawn and quarter-sawn specimens, respectively. As the rift-sawn specimens exhibited the relatively large shear deformation of cell, area, eccentricity, and fitted ellipse aspect ratio are promising parameters for the evaluation of deformation. Among them, the fitted ellipse aspect ratio was selected for further analysis in this study. A detailed discussion of parameter selection was summarized in Supplementary Figures S2, S3, S4, and S5.
After parameter selection, the 2D mapping of the cell deformation intensity for the three specimen types at the elastic region, plastic region and before fracture was constructed (Figure 9). The white color indicates that the measured parameters were unchanged; the darker red and darker blue color indicate larger increase and larger decrease in the measured parameters, respectively. In the elastic region, all specimens exhibited relative slight and varied deformation for all parameters (Figure 9a, d, g), which suggests the force was uniformly transferred to each cell wall. In the plastic region, the cell deformation distribution was different (Figure 9b, e, h). And the intensity of the deformation reached the maximum before fracture of specimen (Figure 9c, f, i).

Intensity of cell deformation of flat-sawn, quarter-sawn and rift-sawn specimens during micro three-point bending test evaluated by three selected parameters and their distribution: (a, b, c) changes in area (%); (d, e, f) changes in bounding box aspect ratio (%); (g, h, i) changes in fitted ellipse aspect ratio (%); (a, d, g) elastic region; (b, e, h) plastic region; (c, f, i) before fracture.
For the flat-sawn specimens, the area appears to be the most suitable parameter for deformation evaluation. As shown in Figure 9b, c, the cell area increased in the tension part and decreased in the compression part of the specimen. Those results might be owing to the existence of latewood at the compression part, which contributed to the restriction of cell deformation. On the whole, it was found that 60% of the cells showed increases in cell area while 39% of the cells showed decreases in cell area in the observed cross-section.
For the quarter-sawn specimen, the bounding box appears to be a promising parameter. Because the specimen exhibited minor curvature during the bending test, the compressive stress caused the ratio to increase, whereas the tensile stress caused the ratio to decrease. The neutral axis seems to be approximately located at the central part of the specimen with the smallest intensity of the changes. Overall, 50% of the observed cells showed increases in the ratio and 50% of the cells showed decreases in the ratio.
For the rift-sawn specimen, the fitted ellipse aspect ratio was selected for the evaluation of deformation. An increase in the fitted ellipse aspect ratio was observed both in the compression part and tension part (Figure 9h, j) Rather than in the flat-sawn and quarter-sawn specimens, the more concentrated and intensive deformation was observed at the innermost area of the compression part and outermost area of the tension part of the rift-sawn specimens. In the observed area, 70% of the cells showed increases in fitted ellipse ratio and 30% of the cells showed decreases in the ratio. The reason for this is that the shear formation of the cell was the dominant deformation pattern and responsible for the increase major axis length, and the decrease in the minor axis length.
3.5 Clustering analysis of deformation pattern of individual cells
To summarize the deformation pattern of each individual cell, the k-means clustering algorithm was implemented through the Python scikit-learn package (Pedregosa et al. 2011). According to Figure 10a, e, i, the clustering algorithm effectively summarized eight clusters corresponding to the intensity of cell deformation for the three specimen types. Figure 10b, f, j showed the fracture pattern of specimens after three-point bending test. The fractures of the three specimen types had high occurrence probability in the corresponding tension part of their clustered color that exhibited large cell deformation. The cluster distribution for the three specimen types is shown in Figure 10c, d, g, h, k, l showed the relationship between the eight summarized deformation patterns and the strain of specimen during the three-point bending test. In the elastic region with the light green color, linear changes in the cell area, bounding box, and fitted ellipse aspect ratio for the flat-sawn, quarter-sawn, and rift-sawn specimens were observed as the strain increased. However, the cell deformation pattern of those specimens was different in the plastic region with skyblue color.

Results of k-means clustering for deformation patterns and their relationship with fracture pattern and strain of specimens: (a, e, i) clusterized images of flat-sawn, quarter-sawn, and rift-sawn specimens, respectively. The yellow circle in (i) points out the blue-colored cells of rift-sawn located at the outermost area of tension part showing minor deformation; (b, f, j) fracture pattern of flat-sawn, quarter-sawn and rift-sawn specimens, respectively. The scale bar indicates a length of 400 μm; (c, g, k) distribution of clusters of changes in area, bounding box aspect ratio, and fitted ellipse aspect ratio for flat-sawn, quarter-sawn, and rift-sawn specimens, respectively; (d, h, l) clusterized changes in area, bounding box aspect ratio, and fitted ellipse aspect ratio during mechanical test for flat-sawn, quarter-sawn, and rift-sawn specimens, respectively, and their relationship with strain. The light green and skyblue areas indicate the assumed elastic and plastic regions, respectively.
For the flat-sawn specimens, almost linear changes in cell area with the evolution of strain were observed in plastic region (Figure 10d). The clustered cells with red color were located at the outermost area of tension part to finally have around a 9% increase in cell area. And the area of cell with vermillion color located at innermost area of compression part showed about 5% decrease. As shown in Figure 10b, the ray parenchyma cells appear to be a defect that facilitates fractures, and the detachment between cells along the radial direction was also observed.
The linear changes in the bounding box aspect ratio were also observed in the plastic region of quarter-sawn specimen (Figure 10h). The significant increase and decrease in the bounding box aspect ratio mainly occurred in the earlywood region near the previous latewood region, which was colored with red and vermilions, respectively (Figure 10e). With the evolution of strain, the bounding box aspect ratio of the cells with those two colors showed 12% increase and 8% decrease, respectively. The earlywood cell wall located in that region exhibited a thinner cell wall with a large cell area, which resulted in weaker mechanical properties. This is assumed to be the reason for the initiation of the fracture of the specimen, which possibly induced the detachment between cells in the earlywood region of the tension part (Figure 10f). Because the ray parenchyma cells of the quarter-sawn specimens were aligned against the mechanical load, the ray parenchyma cells may have contributed significantly to the restriction of the cell deformation, which resulted in larger MOE and MOR compared with that of the flat-sawn specimens.
For the rift-sawn specimens, with the increases in strain, pink colors showed a logarithmic increase while two clusters with red and vermilion colors along the radial files typically exhibited exponential increase (Figure 10l). When the strain reached around 5%, changes in fitted ellipse aspect ratio for the pink-colored cells tend to become almost constant and finally reached 21%. And the red- and vermilion-colored cells showed a drastic increase in the changes in fitted ellipse aspect ratio and finally reached 28 and 43% before the fracture, respectively. Such large shear deformation contributed significantly to the flexibility of the rift-sawn specimens. Owing to the orientation of the annual ring at approximately 44.5°, the ray tissue appeared to impose a minor restriction on the cell walls. Interestingly, as in Figure 10i, the blue cells in the yellow circle were located at the outermost area of the tension part. Although those cells remained relatively unchanged, they were surrounded by red and vermillion-colored cells that had been largely deformed. Such a restricted blue area is possibly involved in the initiation of the cell detachment in Figure 10j. Closer observation of the fractured surface allows us to conclude that the detachment between cells along the radial direction dominated the fracture pattern of the specimens.
4 Conclusions
This study constructed a deep-learning-based semantic segmentation model with U-Net architecture to partition tracheid cells in the cross-section of hinoki wood during a micro three-point bending test. Using the Crocker–Grier linking algorithm, thousands of cells were extracted. Then, several parameters (area, eccentricity, major/minor axis length, vertical/horizontal bounding box length) were used to evaluate the intensity of the cells’ deformation, and the 2D mapping of the deformation intensity distribution at the cellular level was constructed. The following conclusions were drawn:
The area and bounding box aspect ratio are suitable for evaluating the cell deformation of flat-sawn and quarter-sawn specimens, respectively. Because the rift-sawn specimens exhibited the relatively large shear deformation of the cell wall, the area, eccentricity, and fitted ellipse aspect ratio are promising parameters for the evaluation of deformation.
The quarter-sawn specimens exhibited the largest MOE and MOR. The ray parenchyma cells aligned against the mechanical load may have contributed to the restriction of the cell deformation. The rift-sawn specimens exhibited the smallest MOE and MOR, possibly owing to the loading of the specimen in the in-plane off-axial direction, which induced the shear deformation of the cell wall.
For all three specimen types, according to the k-means clustering results for the cell deformation pattern, there was high probability of fracture occurrence in the tension part of the specimen, which exhibited large cell deformation. Therefore, the proposed method can be adapted to fracture prediction for wood specimens.
Wood is a natural composite, and its anatomical structures and mechanical properties are diverse. Therefore, the proposed approach with the combination of computer vision, machine learning, and multivariate analyses has a great potential in unraveling the relationships between morphology and mechanical behavior of wood, which remain uncertain.
Funding source: Japan Society for the Promotion of Science
Award Identifier / Grant number: Innovative area (No.18H05485)
Award Identifier / Grant number: JSPS Postdoctoral Fellowships for Research in Japa
-
Author contributions: SC and JS designed the research project; SC mainly conducted experiments and wrote the manuscript; TA, AY, JS supervised the work. All authors contributed to and approved the final version of the manuscript.
-
Research funding: This study was supported by Grants-in-Aid for Scientific Research on Innovative Area (grant number 18H05485) and JSPS Postdoctoral Fellowships for Research in Japan (grant number 22F22085) from the Japan Society for the Promotion of Science. We thank Edanz (https://jp.edanz.com/ac) for editing a draft of this manuscript.
-
Conflict of interest statement: The authors declare that they have no conflicts of interest regarding this article.
-
Data availability: All necessary codes in this study are available online at Github.com (https://github.com/pywood21/holz_202209).
References
Allan, D.B., Caswell, T., Keim, N.C., Van der Wel, C.M., and Verweij, R.W. (2021). Trackpy v0.5.0. (Version 0.5.0), Zenodo.Search in Google Scholar
Ando, K. and Onda, H. (1999a). Mechanism for deformation of wood as a honeycomb structure I: effect of anatomy on the initial deformation process during radial compression. J. Wood Sci. 45: 120–126, https://doi.org/10.1007/BF01192328.Search in Google Scholar
Ando, K. and Onda, H. (1999b). Mechanism for deformation of wood as a honeycomb structure II: first buckling mechanism of cell walls under radial compression using the generalized cell model. J. Wood Sci. 45: 250–253, https://doi.org/10.1007/BF01177734.Search in Google Scholar
Chaurasia, A. and Culurciello, E. (2017). IEEE visual Communications and image processing (VCIP), 10-13 December 2017: LinkNet: Exploiting encoder representations for efficient semantic segmentation. Institute of Electrical and Electronics Engineers (IEEE), New York.10.1109/VCIP.2017.8305148Search in Google Scholar
Chevalier, G. (2017). Make smooth predictions by blending image patches, such as for image segmentation, Github, Available at: <https://github.com/Vooban/Smoothly-Blend-Image-Patches>.Search in Google Scholar
Coelho, L.P. (2013). Mahotas: open source software for scriptable computer vision. J. Open Res. Software 1: e3, https://doi.org/10.5334/jors.ac.Search in Google Scholar
Crocker, J.C. and Grier, D.G. (1996). Methods of digital video microscopy for colloidal studies. J. Colloid Interface Sci. 179: 298–310, https://doi.org/10.1006/jcis.1996.0217.Search in Google Scholar
De Magistris, F. and Salmén, L. (2008). Finite element modelling of wood cell deformation transverse to the fibre axis. Nord. Pulp Pap. Res. J. 23: 240–246, https://doi.org/10.3183/npprj-2008-23-02-p240-246.Search in Google Scholar
Garcia-Pedrero, A., García-Cervigón, A., Olano, J.M., García-Hidalgo, M., Lillo-Saavedra, M., Gonzalo-Martín, C., Caetano, C., and Calderón-Ramírez, S. (2020). Convolutional neural networks for segmenting xylem vessels in stained cross-sectional images. Neural Comput. Appl. 32: 17927–17939, https://doi.org/10.1007/s00521-019-04546-6.Search in Google Scholar
Gibson, L.J. and Ashby, M.F. (1998). Cellular solids: structure and properties. Pergamon Press, New York.10.1017/CBO9781139878326Search in Google Scholar
Holmberg, S., Persson, K., and Petersson, H. (1999). Nonlinear mechanical behaviour and analysis of wood and fibre materials. Comput. Struct. 72: 459–480, https://doi.org/10.1016/S0045-7949(98)00331-9.Search in Google Scholar
Harada, T. (1999). Hiwadabuki to kokerabuki (in Japanese). Gakugei Shuppansha, Kyoto, Japan.Search in Google Scholar
Hwang, S. and Sugiyama, J. (2021). Computer based wood identification and its expansion and contribution potentials in wood science: a review. Plant Methods 17: 47, doi:https://doi.org/10.1186/s13007-021-00746-1.Search in Google Scholar PubMed PubMed Central
Hwang, S., Isoda, H., Nakagawa, T., and Sugiyama, J. (2021). Flexural anisotropy of rift-sawn softwood boards induced by the end-grain orientation. J. Wood Sci. 67: 14, https://doi.org/10.1186/s10086-021-01946-y.Search in Google Scholar
Li, X., Lu, Z., Yang, Z., and Yang, C. (2018). Anisotropic in-plane mechanical behavior of square honeycombs under off-axis loading. Mater. Des. 158: 88–97, https://doi.org/10.1016/j.matdes.2018.08.007.Search in Google Scholar
Lin, T.Y., Dollár, P., Girshick, R., He, K., Hariharan, B., and Belongie, S. (2017). IEEE Conference on computer Vision and pattern recognition (CVPR), 21-26 july 2017: Feature pyramid networks for object detection. Institute of Electrical and Electronics Engineers (IEEE), New York.10.1109/CVPR.2017.106Search in Google Scholar
Long, J., Shelhamer, E., and Darrell, T. (2015). IEEE Conference on computer Vision and pattern recognition (CVPR), 7-12 june 2015: Fully convolutional networks for semantic segmentation. Institute of Electrical and Electronics Engineers (IEEE), New York.10.1109/CVPR.2015.7298965Search in Google Scholar
Murata, K., Masuda, M., and Ichimaru, M. (1999). Analysis of radial compression behavior of wood using digital correlation method (in Japanese). Mokuzai Gakkaishi 45: 375–381.Search in Google Scholar
Murata, K. and Masuda, M. (2003). Analysis of strain distribution of softwood in transverse compression measured by digital image correlation method (in Japanese). J. Soc. Mat. Japan 52: 347–352.10.2472/jsms.52.347Search in Google Scholar
Müller, U., Gindl, W., and Teischinger, A. (2003). Effects of cell anatomy on the plastic and elastic behaviour of different wood species loaded perpendicular to grain. IAWA J. 24: 117–128, https://doi.org/10.1163/22941932-90000325.Search in Google Scholar
Pedregosa, F., Varoquaux, G., Gramfort, A., Michel, V., Thirion, B., Grisel, O., Blondel, M., Prettenhofer, P., Weiss, R., Dubourg, V., et al. (2011). Scikit-learn: machine learning in python. J. Mach. Learn. Res. 12: 2825–2830, https://dl.acm.org/doi/10.5555/1953048.2078195.Search in Google Scholar
Robert, J.R. (2010). Wood handbook. Wood as an engineering material. U.S. Dept. of Agriculture, Forest Service, Forest Products Laboratory, WI.Search in Google Scholar
Ronneberger, O., Fischer, P., and Brox, T. (2015). U-Net: convolutional networks for biomedical image segmentation. In: Medical image computing and computer-assisted intervention (MICCAI), Vol. 9351. Springer, Cham, LNCS, pp. 234–241. arXiv:1505.04597 [cs.CV].10.1007/978-3-319-24574-4_28Search in Google Scholar
Saiki, H. (1963). Studies on annual ring structure of coniferous wood II Demarcation between earlywood and latewood (in Japanese). Mokuzai Gakkaishi 9: 231–236.Search in Google Scholar
Van der Walt, S., Schönberger, J.L., Nunez-Iglesias, J., Boulogne, F., Warner, J.D., Yager, N., Gouillart, E., Yu, T., and the scikit-image contributors. (2014). Scikit-image: image processing in Python. PeerJ 2: e453, https://doi.org/10.7717/peerj.453.Search in Google Scholar PubMed PubMed Central
Vincent, L. and Soille, P. (1991). Watersheds in digital spaces: an efficient algorithm based on immersion simulations. IEEE Trans. Pattern Anal. Mach. Intell. 13: 583–598, https://doi.org/10.1109/34.87344.Search in Google Scholar
Watanabe, U., Norimoto, M., and Morooka, T. (2000). Cell wall thickness and tangential Young’s modulus in coniferous early wood. J. Wood Sci. 46: 109–114, https://doi.org/10.1007/BF00777356.Search in Google Scholar
Watanabe, U., Norimoto, M., Ohgama, T., and Fujita, M. (1999). Tangential Young’s modulus of coniferous early wood investigated using cell models. Holzforschung 53: 209–214, https://doi.org/10.1515/HF.1999.035.Search in Google Scholar
Watanabe, U., Fujita, M., and Norimoto, M. (2002). Transverse Young’s moduli and cell shapes in coniferous early wood. Holzforschung 56: 1–6, https://doi.org/10.1515/HF.2002.001.Search in Google Scholar
Wolny, A., Cerrone, L., Vijayan, A., Tofanelli, R., Barro, A.V., Louveaux, M., Wenzl, C., Strauss, S., Wilson-Sánchez, D., Lymbouridou, R., et al. (2020). Accurate and versatile 3D segmentation of plants tissues at cellular resolution. Elife 9: e56713, https://doi.org/10.7554/eLife.57613.Search in Google Scholar PubMed PubMed Central
Yokoyama, S. (2016). Restoration discussion of Saitama prefecture specified tangible cultural property Yakyu Inari shrine (in Japanese). AIJ J. Technol. Des. 22: 1143–1148, https://doi.org/10.3130/aijt.22.1143.Search in Google Scholar
Zhong, W., Zhang, Z., Chen, X., Wei, Q., Chen, G., and Huang, X. (2021). Multi-scale finite element simulation on large deformation behavior of wood under axial and transverse compression conditions. Acta Mech. Sin. 37: 1136–1151, https://doi.org/10.1007/s10409-021-01112-z.Search in Google Scholar
Supplementary Material
The online version of this article offers supplementary material (https://doi.org/10.1515/hf-2022-0096).
© 2022 the author(s), published by De Gruyter, Berlin/Boston
This work is licensed under the Creative Commons Attribution 4.0 International License.
Articles in the same Issue
- Frontmatter
- Original Articles
- Flexural behavior of wood in the transverse direction investigated using novel computer vision and machine learning approach
- Elasto-plastic material model of oak at two moisture content levels
- Evaluating wettability of vessels in poplar by Micro-CT imaging
- Volume fractal and surface fractal analysis of the pore structure of natural and heat-treated spruce wood using the mercury intrusion porosimetry test
- Effect of pressurized hot water extraction and esterification on the moisture properties and decay resistance of Scots pine (Pinus sylvestris L.) sapwood
- Improvement on dimensional stability and mold resistance of wood modified by tannin acid and tung oil
- Effect of plasma treatment on the surface characteristics and adhesive penetration performance of heat-treated wood