Factors influencing green strength of commercial natural rubber
-
Nghiem Thi Thuong
 ,
Phan Trung Nghia
and
Seiichi Kawahara
,
Phan Trung Nghia
and
Seiichi Kawahara

Abstract
The factors influencing the green strength of commercial solid rubbers were investigated in the present study through characterization of commercial natural rubber (NR). Various solid commercial rubbers such as standard Vietnam rubber (SVR10), standard Indonesia rubber (SIR10), India standard natural rubber (ISNR10), ribbed smoked sheets (RSS3), and FNR (commercial Sumitomo Rubber) were used as a source. Purification of the samples was carried out through acetone extraction and purified samples were characterized by nuclear magnetic resonance (NMR) and Fourier-Transform infrared spectroscopy. Degradation was found for SVR10, ISNR10, and SIR10 but not for RSS3 and FNR through the assignment of 13C-NMR signals. Acetone extraction was found to improve the green strength of commercial NR due to the removal of impurities. Linked fatty acids and proteins contributed to the upturn of stress at small strain. However, the network structure of degraded rubbers had an insignificant role in enhancing the green strength of commercial NR.
1 Introduction
Natural rubber (NR) possesses a very unique structural characteristic and chemical composition compared with other natural polymers. It consists of a very long sequence of cis-1,4-isoprene with two unknown terminal groups linking to nonrubber components such as protein and fatty acids through physical and chemical interactions [1]. Such linkages and interactions have been known to form naturally occurring cross-linking junctions or natural networks, which contribute to the high performance of NR, such as high green strength. However, whether these unique characteristics can be maintained during the processing of rubber from the latex state into the solid state is not thoroughly understood. In previous work, several low grades of commercial rubber have been found to be damaged and such damage definitely affects the mechanical properties of commercial rubbers [2].
Processing NR latex in the preparation of solid commercial rubbers has been known to cause significant changes in the mechanical properties of NR. Processing of NR was usually performed through many steps as described elsewhere [3]. The difference in the processing procedure of various grades of commercial rubbers is the coagulation method, such as auto- or chemically controlled coagulation and drying recipes, i.e. temperature and time. The coagulation procedure was known to affect the nonrubber component; however, drying at high temperature has a significant influence on the performance of commercial rubbers. This suggested that the structural characteristics of NR may be damaged due to degradation and result in the deterioration of the mechanical properties of NR.
In the present work, we aimed to achieve a better understanding of the relationship between structure and properties of NR by investigating the effect of structural characteristics, nonrubber components, and impurities on the green strength of commercial NRs. In this work, first, the rubber film was carefully prepared by using a polar solvent to increase the dissolubility of rubber in organic solvent. Its purpose was to obtain a homogenous film for mechanical testing. Then, purification of the samples was carried out by acetone extraction to remove impurities such as oils, resins, fatty acids, and others. Acetone extract content was determined to compare the impurities of each type of commercial rubber. Nitrogen content and fatty acid content were determined using the Kjeldahl method and Fourier-Transform infrared spectroscopy (FT-IR). Structural characteristic of the commercial NR was elucidated through carbon-13 nuclear magnetic resonance (13C-NMR) spectroscopy.
2 Materials and methods
2.1 Materials
Several commercial NRs such as standard Vietnam rubber (SVR10), standard Indonesia rubber (SIR10), India standard natural rubber (ISNR10), ribbed smoked sheet (RSS3), and FNR (from Sumitomo Company) were used in this work. Acetic acid, toluene, chloroform and methanol were provided from Nacalai Tesque, INC, Japan. Methyl stearate was purchased from Tokyo Chemical Industry, Japan. Kuraprene IR10 was provided from Zeon Corporation, Japan. Other chemical reagents are all analytical grade.
2.2 Preparation of rubber films and purification
The rubber films in this work were prepared by casting the toluene solution on Petri dishes. First, solid commercial rubbers were cut into small pieces, dried for 1 day, and dissolved in toluene (1–2 w/w%) for 1 day. Then, a small amount of acetic acid (0–3 wt.%) was added to promote the dissolution and to obtain homogenous mixtures and stirred for one more day. The solution was poured into a Petri dish and dried in a vacuum at room temperature. The thickness of the film was controlled to approximately 1 mm. The rubber film was further dried for approximately 3 days. Purification of the rubber film was done through acetone extraction at 80°C for 24 h under nitrogen atmosphere. The acetone-extracted film was dried in a vacuum at 30°C for 1 week before characterization.
2.3 Nonrubber components determination
Protein content was evaluated through measurement of nitrogen content. The measurement of nitrogen content was determined using the Kjeldahl method as described by the Rubber Research Institute of Malaysia [4]. Fatty acid content was determined through FT-IR analysis using the calibration curves. It was prepared using six mixtures of methyl stearate with synthetic rubber (Kuraprene IR10) from 0, 10, 20, 30, 40 to 50 mmol/kg rubber, respectively. The mixtures were dissolved into chloroform (2 wt.% solution) and cast onto a KBr disk. The FT-IR measurement was performed using a JASCO FT-IR 4100 spectrometer at 100 scans ranging from 400 to 4000 cm−1 at a resolution of 4 cm−1. The fatty acid content was determined based on the intensity ratio of the signal from 1730 to 1664 cm−1. The fatty acid content in the rubber samples was measured using similar methods.
2.4 Gel content measurement
Determination of gel content was carried out using a swelling method. Rubber of approximately 0.04 g was immersed in 40 ml dried toluene, and kept in the dark for 1 week. The gel fraction was collected after separation from the sol fraction by centrifugation. The gel content was calculated by weight ratios of dried gel and initial weight of the rubber sample.
2.5 Nuclear magnetic resonance spectroscopy
Rubber samples after acetone extraction were characterized through 13C-NMR spectroscopy. The measurement was performed in a 10 mm diameter tube in deuterated chloroform at 40,000 scans in a JEOL EX-400 at room temperature. The amount of rubber in the deuterated solvent required for the measurement was approximately 400 mg.
2.6 Green strength measurement
The green strength of the rubber samples was evaluated by uniaxial stretching. The tensile strength of the rubber film was measured at ambient temperature using a TOYOSEIKI Universal Tester, VG10E, Japan, at a constant strain rate (200 mm/min according) to the JIS No. 7. The thickness of the film was approximately 1 mm.
3 Results and discussion
3.1 NMR analysis
Figure 1 shows 13C-NMR spectra for RSS3, FNR, ISNR10, SIR10, and SVR10 after acetone extraction. Five characteristic signals for cis-1,4-isoprene units appeared at 23.4, 26.4, 32.2, 125.0, and 135.2 ppm, which were assigned to C5, C4, C1, C3, and C2 of cis-1,4-isoprene, respectively. A signal appeared at 39.8 ppm for RSS3 and FNR whereas two signals at 39.8 and 40.0 ppm appeared for ISNR10, SIR10, and SVR10. As reported by Eng et al. [5], the signals at 39.8 were assigned to the methylene proton of trans-1,4-isoprene unit in trans-trans sequence that belongs to the ω-terminal unit. However, the signal at 40.0 ppm was assigned to methylene proton of trans-1,4-isoprene unit in cis-trans sequence, which originated from cis-trans isomerization. This implies that a low level of cis-trans isomerization took place during rubber processing to prepare ISNR10, SIR10, and SVR10. The intensity of signals at 40.0 ppm was lower than that at 39.8 ppm for ISNR10 and SVR10. In contrast, the intensity of the two signals were similar to each other for SIR10. This suggested that the level of cis-trans isomerization in ISNR10 and SVR10 was similar to each other; however, it was lower than that in SIR10. In previous work [6], cis-trans isomerization in NR and other compounds were promoted by the action of heat, light, and various catalysts such as organic bromide and sulfur compounds. In the absence of such catalysts during the processing of NR, the occurrence of isomerization of ISNR10, SIR10, and SVR10 could be ascribed to the high drying temperature (more than 100°C). On the other hand, the small signals at 60.8 and 64.5 ppm appeared only in the 13C-NMR spectra for SIR10-AE and SVR10-AE. These signals were assigned to C2 and C3 of an epoxidized isoprene unit. This indicates that these samples undergo a small degree of oxidation.
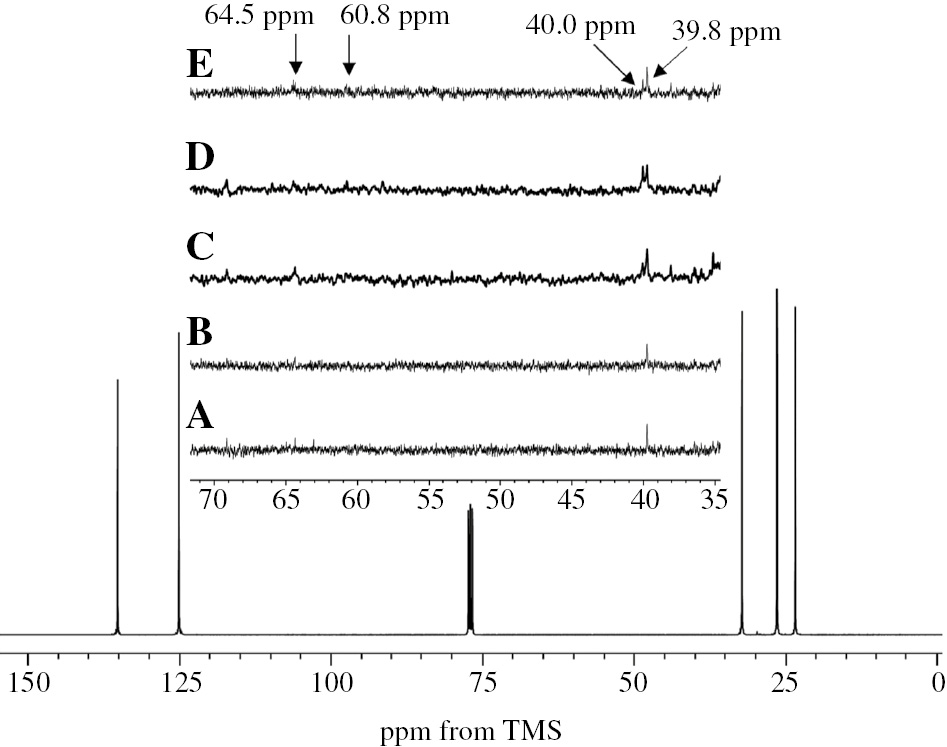
13C-NMR spectra for (A) RSS3, (B) FNR, (C) ISNR10, (D) SIR10, and (E) SVR10.
From the above structural characterization information, these five commercial rubbers could be classified into two categories: degraded and nondegraded commercial rubber on the basis of assignment from 13C-NMR spectroscopy.
3.2 Acetone extracts
Acetone extract content for the rubbers were shown in Table 1. The acetone extract contents for five commercial NRs were determined based on the weight loss during acetone extraction over the initial weight of approximately 1 g for each sample.
Acetone extract content for commercial NRs.
| Samples | Acetone extract content (wt.%) |
|---|---|
| FNR | 7.3 |
| SIR10 | 2.8 |
| ISNR10 | 2.1 |
| SVR10 | 3.8 |
| RSS3 | 1.6 |
As can be seen, the acetone extract content of RSS3 was the lowest (1.6 wt.%) and that of FNR was the highest (7.3 wt.%). As reported in previous work [3], NR usually contains approximately 2–4 wt.% of acetone-extracted compounds, including low molecular weight organic compounds such as free fatty acids, resin, and neutral lipids. The abnormally high acetone extract of FNR may be similar in origin as the solid rubber prepared from skim latex [1], which is rich in nonrubber components. Furthermore, in processing commercial NRs, some inert plasticizers such as naphthenic and rubber process oils were usually added to prepare low-viscosity NR (LV rubber). This LV rubber has the acetone extract from 6 to 8 wt.%. A similar amount of acetone extract of FNR and LV rubber suggests that FNR may contain much more acetone-extractable compounds similar to that of LV rubber [3].
3.3 Nonrubber components and gel
The linked fatty acid content, nitrogen content, and gel content of each commercial NR were tabulated in Table 2. It is expected that the linked fatty acids and proteins are related to the formation of naturally occurring cross-linking junctions, which form the gel fraction. Therefore, the high amount of nonrubber components should be proportional to the gel content. In the present work, ISNR10 has the lowest amount of nonrubber component despite the highest gel content. This ambiguity may be related to the destruction of the natural network in the rubber during processing.
Fatty acid content, nitrogen content, and gel content of samples after acetone extraction.
| Samples | Linked fatty acid content (mmol/kg rubber) | Nitrogen content (wt.%) | Gel content (wt.%) |
|---|---|---|---|
| SIR10 | 7.5 | 0.267 | 14.6 |
| ISNR10 | 7.7 | 0.209 | 34.8 |
| SVR10 | 11.4 | 0.392 | 13.4 |
| RSS3 | 8.4 | 0.412 | 11.8 |
| FNR | 14.9 | 0.575 | 18.5 |
3.4 Green strength of commercial rubbers
Figure 2 shows the stress-strain curves for RSS3, FNR, SVR10, ISNR10, and SIR10 before and after acetone extraction. It is clearly shown that after acetone extraction, the stress at break of the samples increased whereas the strain at break decreased. The acetone extraction seems to make rubber harder than before. Therefore, the difference in the stress-strain curves before and after acetone extraction suggesting that the mixed fatty acids and impurities did not contribute to the outstanding properties of NRs but play a role as plasticizers. Additionally, the upturn of the stress of the rubbers after acetone extraction appeared at smaller strain than that before acetone extraction. For instance, the upturn of stress of FNR occurred at a strain of 4; however, after acetone extraction, the stress started to increase abruptly at a strain of 1. The upturn of stress at small strain is attributed to the strain-induced crystallization of the rubbers due to linked fatty acids [7] and the upturn seems to be proportional to the linked fatty acids content, which increases from ISNR10, SIR10, RSS, SVR10, and FNR. Furthermore, the high number of impurities of rubbers (e.g. FNR) may suppress the strain-induced crystallization.
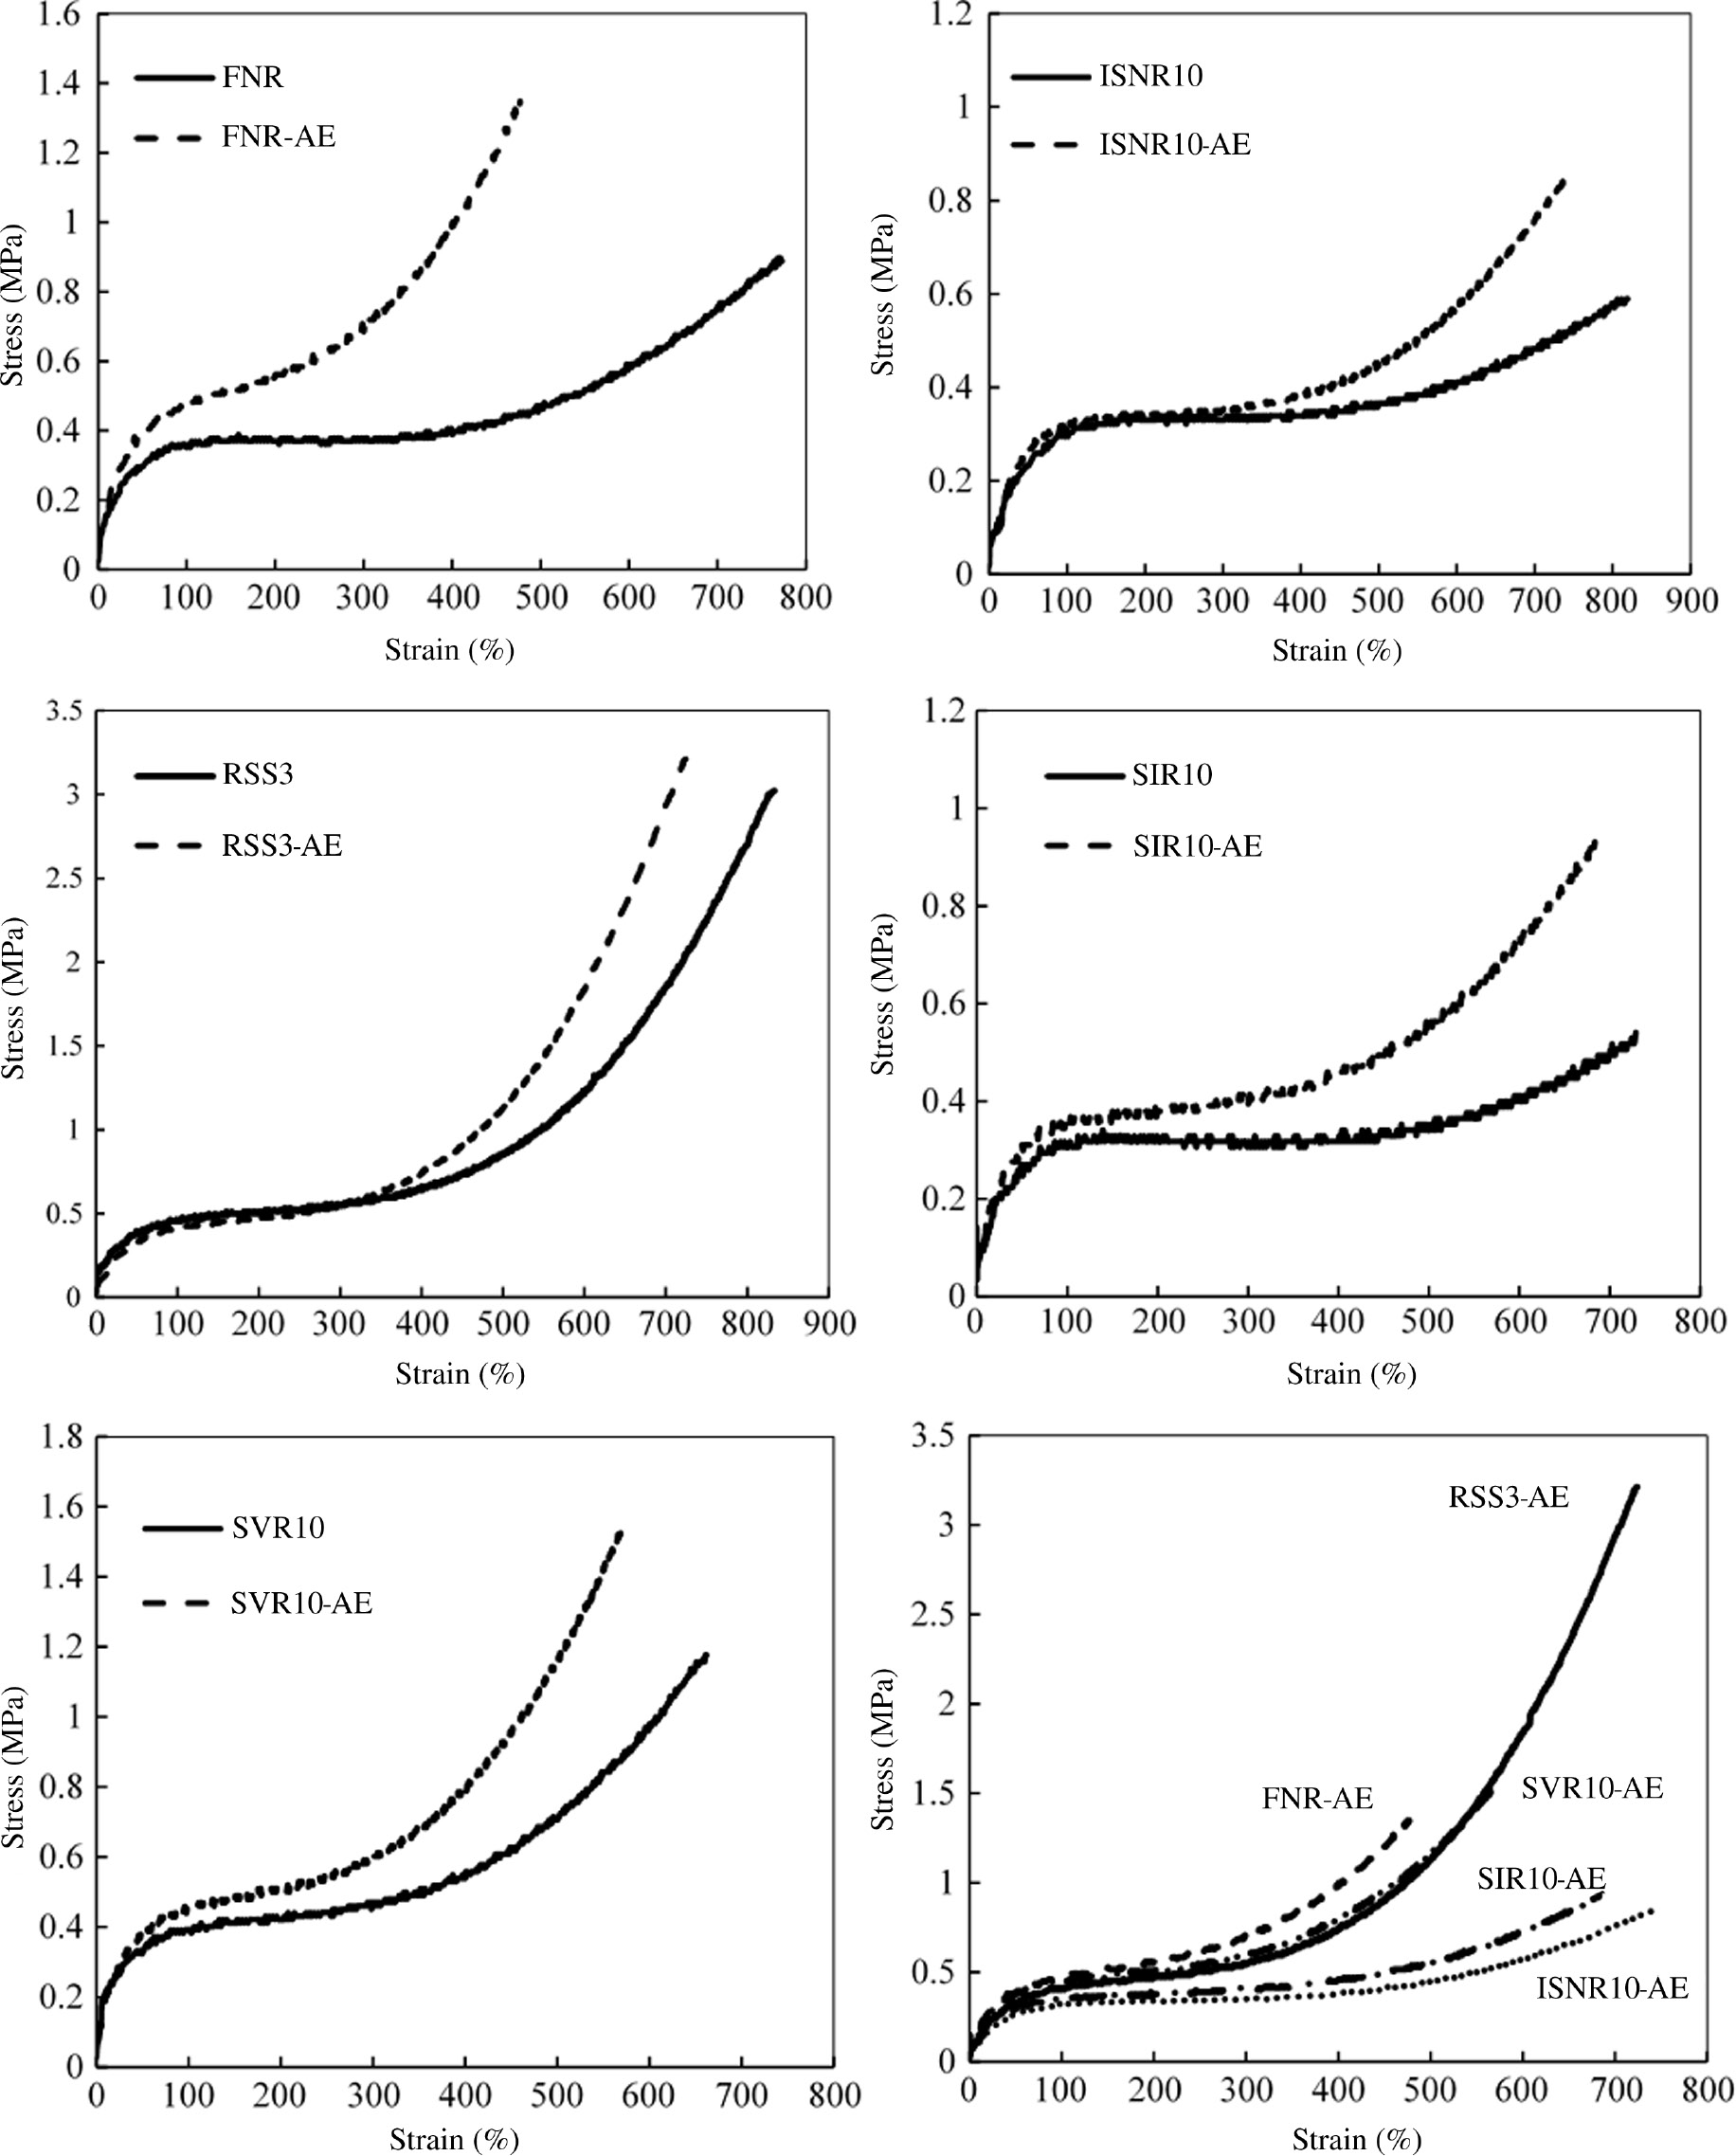
Stress-strain curves for RSS3, FNR, SVR10, ISNR10, and SIR10.
The values of stress at a strain of 1 were also shown in Table 3. It could be realized that the stress at strain of 1 was proportional to the nitrogen content of the rubbers, that is, the stress at a strain of 1 increased as the nitrogen content increased as shown in Figure 3. This demonstrated that the presence of naturally occurring proteins in NR accelerates the upturn of stress at low strain. The protein phase may play roles as the cross-linking sites and reinforcing filler in NR as mentioned in previous work [8]. This finding suggested that nitrogen content might serve as one of the important factors improving the mechanical properties of NR.
Stress at break, strain at break, and stress at strain of 1 of the rubbers.
| Samples | Stress at break (MPa) | Strain at break (%) | Stress at strain of 1 (MPa) |
|---|---|---|---|
| SIR10 | 0.92 | 680 | 0.36 |
| ISNR10 | 0.85 | 742 | 0.32 |
| SVR10 | 1.53 | 569 | 0.45 |
| RSS3 | 3.21 | 724 | 0.41 |
| FNR | 1.35 | 475 | 0.47 |
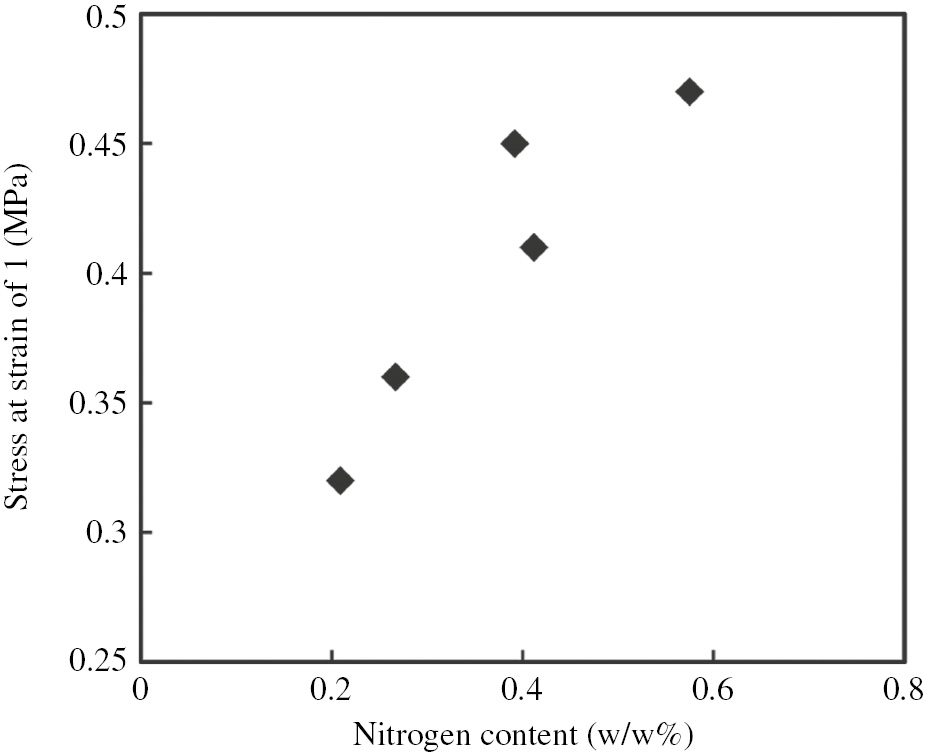
Plot of stress at strain of 1 versus nitrogen content of commercial NRs.
4 Conclusion
The green strength of commercial NR was found to improve after the removal of acetone-extractable compounds. This suggests that acetone-extractable compounds, i.e. impurities and free fatty acids, are supposed to play a role as plasticizers. Meanwhile, linked fatty acids and proteins are found to increase the green strength through strain-induced crystallization and filler effect, respectively, at small elongation or extension. Degradation of the rubbers during processing of commercial NR may result in the destruction of the natural network of the rubbers; therefore, the degraded samples have low green strength despite the high gel content.
Acknowledgments
This research was funded by the Development (NAFOSTED) under grant nos. 104.02-2017.35 and 104.02-2016.47.
References
[1] Sakdapipanich J, Rojruthai R. In Bio-technology, Molecular Studies and Novel Applications for Improved Quality of Human Life, Biochemistry, Genetics and Molecular Biology, Sammour RH, Ed., Intech: Rijeka, Croatia, 2012, pp 159–172.Search in Google Scholar
[2] Thuong NT, Yamamoto Y, Nghia PT, Kawahara S. Polym. Degrad. Stab. 2016, 123, 155–161.10.1016/j.polymdegradstab.2015.11.025Search in Google Scholar
[3] John C, Pete M, Eds., Processing of Natural Rubber, Food and Agriculture Organization of the United Nations: Italy, 2003, pp 1–129.Search in Google Scholar
[4] Rubber Research Institute of Malaysia, SMR Bull. No. 7, Part B.7, 1973, No. 17.Search in Google Scholar
[5] Eng AH, Kawahara S, Tanaka Y. Rubber Chem Technol. 1993, 67, 159–168.10.5254/1.3538662Search in Google Scholar
[6] Sakdapipanich JT, Kowitteearawut T, Kawahara S, Tanaka Y. J. Rubber Res, 2001, 4, 1–10.Search in Google Scholar
[7] Kawahara S, Isono Y, Kakubo T, Tanaka Y, Eng AH. Rubber Chem. Technol. 2000, 73, 39–46.10.5254/1.3547578Search in Google Scholar
[8] Toki S, Che J, Rong L, Hsiao BS, Amnuaypornsri S, Nimpaiboon A, Sakdapipanich J. Macromolecules 2013, 46, 5238–5248.10.1021/ma400504kSearch in Google Scholar
©2018 Walter de Gruyter GmbH, Berlin/Boston
Articles in the same Issue
- Frontmatter
- In this issue
- ASAM-6
- The 6th Asian Symposium on Advanced Materials: Chemistry, Physics and Biomedicine of Functional and Novel Materials (ASAM-6; Hanoi, Vietnam, September 27–30, 2017)
- Synthesis and characterization of (4-arm-star-PMMA)/PMMA-g-SiO2 hybrid nanocomposites
- Factors influencing green strength of commercial natural rubber
- Removal of arsenic from water using crumpled graphite oxide
- Adsorption behavior of Cd2+ ions using hydroxyapatite (HAp) powder
- Study on characteristics, properties, and morphology of poly(lactic acid)/chitosan/hydroquinine green nanoparticles
- Original articles
- Green synthesis and stabilization of earthworm-like gold nanostructure and quasi-spherical shape using Caesalpinia sappan Linn. extract
- Catalytic performance of Ag, Au and Ag-Au nanoparticles synthesized by lichen extract
- Comparative kinetics of the alkali-catalyzed sunflower oil methanolysis with co-solvent under conventional and microwave heating with controlled cooling
- Facile nitration of aromatic compounds using Bi(NO3)3·5H2O/MgSO4 under mechanochemical conditions
- Optimization of the treatment process of zinc leaching residue by using the response surface method
- A new green process to produce activated alumina by spray pyrolysis