A new green process to produce activated alumina by spray pyrolysis
-
Wang Long
 ,
Lv Guozhi
,
Lv Guozhi

Abstract
A green process that uses the spray pyrolysis method to prepare activated alumina is proposed in this research. The effects of spray temperature, carrier gas pressure, and AlCl3 solution concentration are experimentally investigated using pure reagents. The products were characterized by X-ray diffraction (XRD), scanning electron microscope (SEM), and specific surface area (BET) analyses. The results indicate that the spray temperature is the most important factor on the conversion ratio of alumina during the spray pyrolysis process. The conversion ratio of alumina achieved over 99% at the following optimal conditions: temperature of 1000°C, pressure of 0.3 MPa, and AlCl3 solution concentration of 10 wt%. The activated alumina with 8–20 nm particle size (γ-Al2O3+α-Al2O3) was prepared using the same process, which well met the requirement of the catalyst carrier. The green utilization of high-alumina fly ash and acid recycling can be achieved by using this process.
1 Introduction
High-alumina fly ash [1] is a type of industrial waste discharged from the high-alumina coal burning process employed in many electric power plants. The piling and storing treatment of high-alumina fly ash leads to the occupancy of vast lands [2] and the serious pollution of soil, air, and water. At present, China has over 50 billion tons of high-alumina coal reserves, from which 14 billion tons of high-alumina fly ash (alumina content >40%) are produced. The total bauxite resources in China, which are mostly low-grade (alumina content >45%), are 3.8 billion tons. The reserve of alumina within the high-alumina fly ash is more than thrice of that within the bauxite resources in China. The alumina content of the high-alumina fly ash is over 40 wt% and equivalent to the A12O3 content of low-grade bauxite [3], indicating that the high-alumina fly ash is a promising resource for the production of alumina [4]. The comprehensive utilization of coal fly ash has been studied since the 1970s [5] when the problems of energy crisis, resource exhaustion, and environmental contamination garnered public attention throughout the world [6]. Alkali sintering and acid leaching methods using the high-alumina fly ash as raw material have been proven to be effective for alumina production [7, 8]. The alkali process requires high energy consumption [9] and produces more solid wastes. In the traditional acid process, the AlCl3 solution has been treated by NaOH or NH3·H2O to obtain Al(OH)3, and then decomposed into Al2O3 by using the roasting process. However, the problems of water and acid recycling have limited the development of this method.
Currently, activated alumina is considered one of the most useful oxides [10] and has been used in many engineering applications, such as adsorbents [11], electrical materials [12], plasma spray coatings [13], wear-resistant composites [14], and catalyst support [15]. This is because activated alumina has a large surface area, pore size, and pore volume. The annual demand for activated alumina has grown steadily. In the traditional production process, the activated alumina is obtained by heating and the partial dehydration of Al(OH)3. However, the presence of the monohydrate results in a low specific surface rating to active the product, and the removal of the monohydrate is impractical [16].
Spray pyrolysis is a key area in the development of science and engineering. Compared with the conventional processes, spray pyrolysis [17] can greatly improve the factory production capacity by making the process shorter and by reducing the waste residue, water, acid, and alkali emissions. Spray pyrolysis has been widely researched in the area of oxide powder production [18], such as γ-Ga2O3-Al2O3 solids [19], Al2O3 nanoparticles [20], carbon nanowalls [21], tungsten oxide thin films [22], and alumina thin films [23]. Through the spray pyrolysis method, the composition and particle size can be easily controlled. However, few studies have been done on the preparation of activated alumina by using the spray pyrolysis technology. In order to solve the water and acid recycling problems during the alumina production process with acid leaching [24, 25], a spray pyrolysis method was presented in this research with AlCl3 solution as a raw material to prepare the activated alumina.
In this paper, the AlCl3 solutions were made from pure chemicals in order to verify the feasibility of the experiment. The properties of the activated alumina prepared by the proposed spray pyrolysis were investigated by the phase and apparent morphology analyses. The effects of the pyrolysis parameters on the reaction efficiency of activated alumina preparation from the AlCl3 solution were also experimentally studied.
2 Materials and methods
In this paper, AlCl3 (Sinopharm Chemical Reagent Co., Ltd., China) was used as the starting material for basic research, with water as the solvent. The tube furnace was connected to a programmable temperature controller, which was capable of controlling the heating ratio and the target temperature. Each AlCl3 solution (10, 20, and 30 wt%) was placed in the solution tank, which was kept at room temperature. Nitrogen was used as a carrier gas for the AlCl3 solutions of 0.1, 0.2, and 0.3 MPa. The AlCl3 solutions were then fed into the reactor by the pressure effect of flowing air through the flow control valve. The spray time was 10 min, and the sample sintering time was 30 min. On completion, the conversion of alumina, the ratio of the alumina content in the activated alumina to that in the activated alumina and alumina chloride, was calculated by measuring the chloride content using the titrimetric method. For the combinational effect trial, an L9(34) orthogonal test was designed with the following parameters: spray temperatures (800, 900 and 1000°C), carrier gas pressures (0.1, 0.2 and 0.3 Mpa), and AlCl3 solution concentrations of (10, 20, and 30 wt%) (Table 1). These factors and their corresponding levels are shown in Table 1. The orthogonal table with four factors and three levels is shown in Table 2. According to the results of the orthogonal test, the temperature single trials were also conducted to investigate the influence of the temperature on the products during the spray pyrolysis process.
Four factors and their corresponding levels in the study.
| Factors | Temperature (°C) | Concentration (wt%) | Pressure (MPa) | Error |
|---|---|---|---|---|
| Level 1 | 800 | 10 | 0.1 | 1 |
| Level 2 | 900 | 20 | 0.2 | 2 |
| Level 3 | 1000 | 30 | 0.3 | 3 |
The L9(34) orthogonal test with four factors and three levels.
| Treatments no. | Temperature (°C) | Concentration (wt%) | Pressure (MPa) | Error D |
|---|---|---|---|---|
| 1 | 800 | 10 | 0.1 | 1 |
| 2 | 800 | 20 | 0.2 | 2 |
| 3 | 800 | 30 | 0.3 | 3 |
| 4 | 900 | 10 | 0.2 | 3 |
| 5 | 900 | 20 | 0.3 | 1 |
| 6 | 900 | 30 | 0.1 | 2 |
| 7 | 1000 | 10 | 0.3 | 2 |
| 8 | 1000 | 20 | 0.1 | 3 |
| 9 | 1000 | 30 | 0.2 | 1 |
In order to study the results from the orthogonal tests, the range analysis was utilized in this study. Range analysis is a statistical method to determine the factors’ sensitivity to the experimental results according to the orthogonal experiment. Here, “range” is defined as the distance between the extreme values of the data. The greater the range is, the more sensitive the factor is. The calculation processes of the range analyses are, respectively shown in Eqs. (1–4)
where IXm stands for the sum of the experimental results containing the factor X with the m level,
The variance analysis was also utilized in this study. Variance analysis is a statistical method to determine the factors’ significance to the experimental results according to the orthogonal experiment. The calculation processes of the variance analyses are, respectively shown in Eqs. (5–8)
where m stands for the number of factor level, k stands for the number of experiment repetitions, T stands for the sum of the experimental results, SS stands for the mean sum of squares, DF stands for the degree of freedom, MS stands for the mean square, and F stands for the ratio of MSX and MSD.
Next, the phase composition was determined by using the PW3040/60 diffraction instrument with Cu Kα radiation. The X-ray diffraction (XRD) device is from Philips, Netherlands. The microscopic morphology was observed by a scanning electron microscope (SEM) (SU-8000, Japan). The BET specific surface areas of the products under different conditions were carried out by using a Specific Surface Area Analyzer (Model ASAP2020, US).
3 Results and discussion
3.1 Orthogonal test on the activated alumina production
The conversion ratio of the alumina was significantly affected by the combined temperature-pressure-concentration conditions (Table 3). The alumina in treatment 7 (1000°C, 0.3 MPa, and 10 wt%) has the highest conversion ratio of as high as 99.86%. The alumina in most treatments shows conversion ratios that are more the 98%, still much higher than 92% by other studies using existing alumina production methods [26]. The range calculations (Table 3) show that the optimal level combination of relevant factors is A3B1C3. From the data in Table 3, it can be concluded that RA(0.85)>RC(0.7)>RB(0.69), indicating that the order of importance of the factors is as follows: temperature>gas pressure>concentration.
Alumina conversion ratios and the range analyses results under different conditions.
| No. | Level combination | A | B | C | D | Conversion ratio (%) |
|---|---|---|---|---|---|---|
| 1 | A1B1C1D1 | 1 | 1 | 1 | 1 | 99.56 |
| 2 | A1B2C2D2 | 1 | 2 | 2 | 2 | 98.61 |
| 3 | A1B3C3D3 | 1 | 3 | 3 | 3 | 98.46 |
| 4 | A2B1C2D3 | 2 | 1 | 2 | 3 | 99.63 |
| 5 | A2B2C3D1 | 2 | 2 | 3 | 1 | 98.71 |
| 6 | A2B3C1D2 | 2 | 3 | 1 | 2 | 99.77 |
| 7 | A3B1C3D2 | 3 | 1 | 3 | 2 | 99.86 |
| 8 | A3B2C1D3 | 3 | 2 | 1 | 3 | 99.80 |
| 9 | A3B3C2D1 | 3 | 3 | 2 | 1 | 99.36 |
| I | 296.47 | 299.05 | 299.13 | 297.63 | ||
| II | 298.11 | 296.97 | 297.45 | 298.09 | ||
| III | 299.02 | 297.58 | 297.02 | 297.88 | ||
| 98.82 | 99.68 | 99.71 | 99.21 | |||
| 99.37 | 98.99 | 99.15 | 99.36 | |||
| 99.67 | 99.19 | 99.01 | 99.29 | |||
| Optimal levels | A3 | B1 | C3 | |||
| R | 0.85 | 0.69 | 0.7 | |||
| Important order | ACB |
A, temperature; B, AlCl3 solution concentration; C, gas pressure; D, error; 1, 2, 3 Three levels of these factors are shown in Table 1.
The variance analysis results are shown in Table 4. As shown in Table 4, the effect of temperature on the conversion ratio of the alumina during the spray pyrolysis process is more significant. Then, the temperature single-factor trials were conducted to investigate the influence of temperature on the products during the spray pyrolysis. The characterization of the products was especially conducted to investigate the effect of temperature on the products during the spray pyrolysis.
The variance analysis for the key performance indexes of the activated alumina.
| Source | SS | DF | MS | F |
|---|---|---|---|---|
| Temperature | 1.1134 | 2 | 0.5567 | 31.4520a |
| Pressure | 0.7622 | 2 | 0.3811 | 21.5311 |
| Concentration | 0.8288 | 2 | 0.4144 | 23.4124 |
| Error D | 0.0354 | 2 | 0.0177 |
SS, sum of squares; DF, degree of freedom; MS, mean square.
aSignificant difference [F0.05(2,2)<F <F0.01(2,2)].
3.2 Characterization of the activated alumina products in different temperatures
Results in Figure 1 indicate that the main diffraction peaks of standard γ-Al2O3 appear at crystal face (311), (400) and (440) [27]. When the pyrolysis temperature of the AlCl3 crystal reached 900°C, the characteristic peaks of the α-Al2O3 appear at the crystal faces (104), (110), (006) and (202). This is because 900°C is the crystal phase transition temperature of the alumina. Given that the γ-Al2O3 is the main phase of the activated alumina, the optimal pyrolysis temperature should be lower than 1000°C.
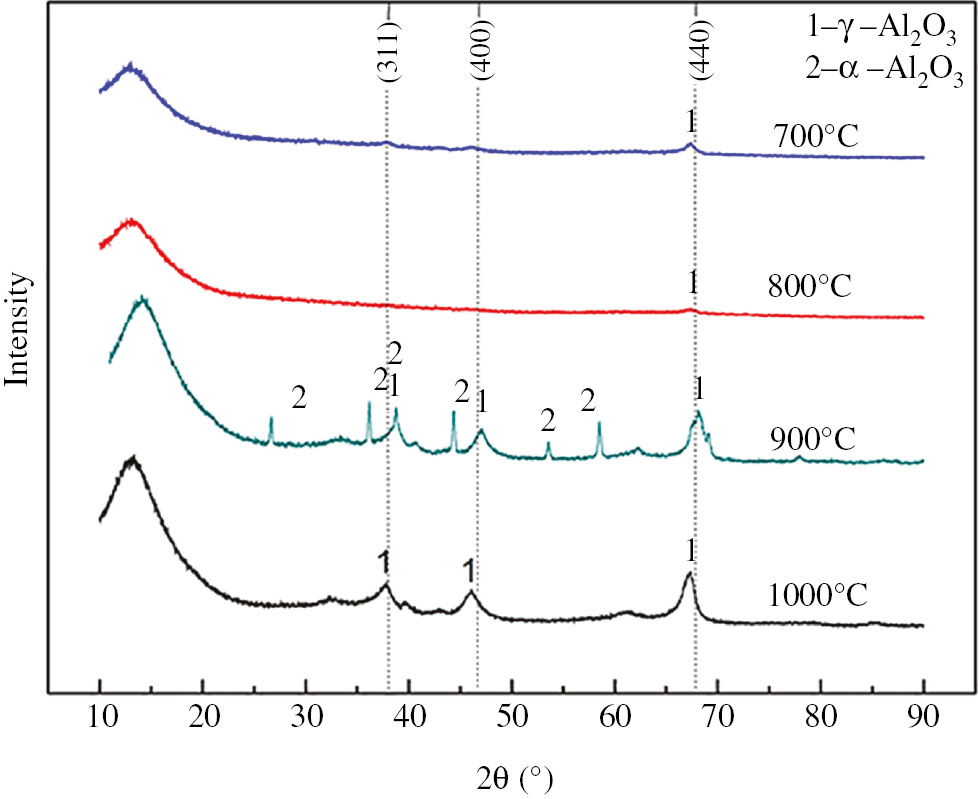
XRD patterns of the alumina products from the AlCl3 solution generated by the spray pyrolysis process.
Table 5 lists the nanoparticles sizes calculated with XRD data. The particle sizes were measured by using the Scherrer equation for XRD. The Scherrer formula is given by
Analysis of XRD patterns of alumina products.
| Temperature (°C) | hkl | 2θ (°) | H | FWHM (°) | Crystallite size (nm) |
|---|---|---|---|---|---|
| 700 | 440 | 67.1133 | 232.44 | 0.7680 | 8.8304 |
| 800 | 440 | 67.3963 | 857.72 | 0.2880 | 23.4488 |
| 900 | 440 | 66.5512 | 564.44 | 0.3419 | 12.3027 |
| 1000 | 440 | 67.1978 | 529.35 | 0.6298 | 10.7384 |
where D stands for the apparent particle size, β stands for the full-width half-maximum of the XRD line (additional peak broadening) in radians, λ stands for the wavelength used, and θ stands for half the scattering angle. The constant 0.9 in Eq. (9) depends slightly on the symmetry of the crystal.
The calculations showed that the γ-Al2O3 and the α-Al2O3 had the average grain sizes of about 13 and 12 nm, respectively. Hence, the crystal phase transition of the γ-Al2O3 and α-Al2O3 has little effect on the activated alumina granularity.
SEM images show that the activated alumina at the low-temperature sintering of 700°C has a lamellar structure (Figure 2A), but the products at other temperatures have a granular structure. In the spray pyrolysis process, the solid reactants precipitate first from the liquid phase and then transformed into round particles. With rising temperature, the pyrolysis products become irregular and result in rough surfaces. However, the formation of the lamellar structure is not observed. These results confirm that sintering under increasing temperature changes the product structure from a lamellar to an irregular structure with rough surfaces.
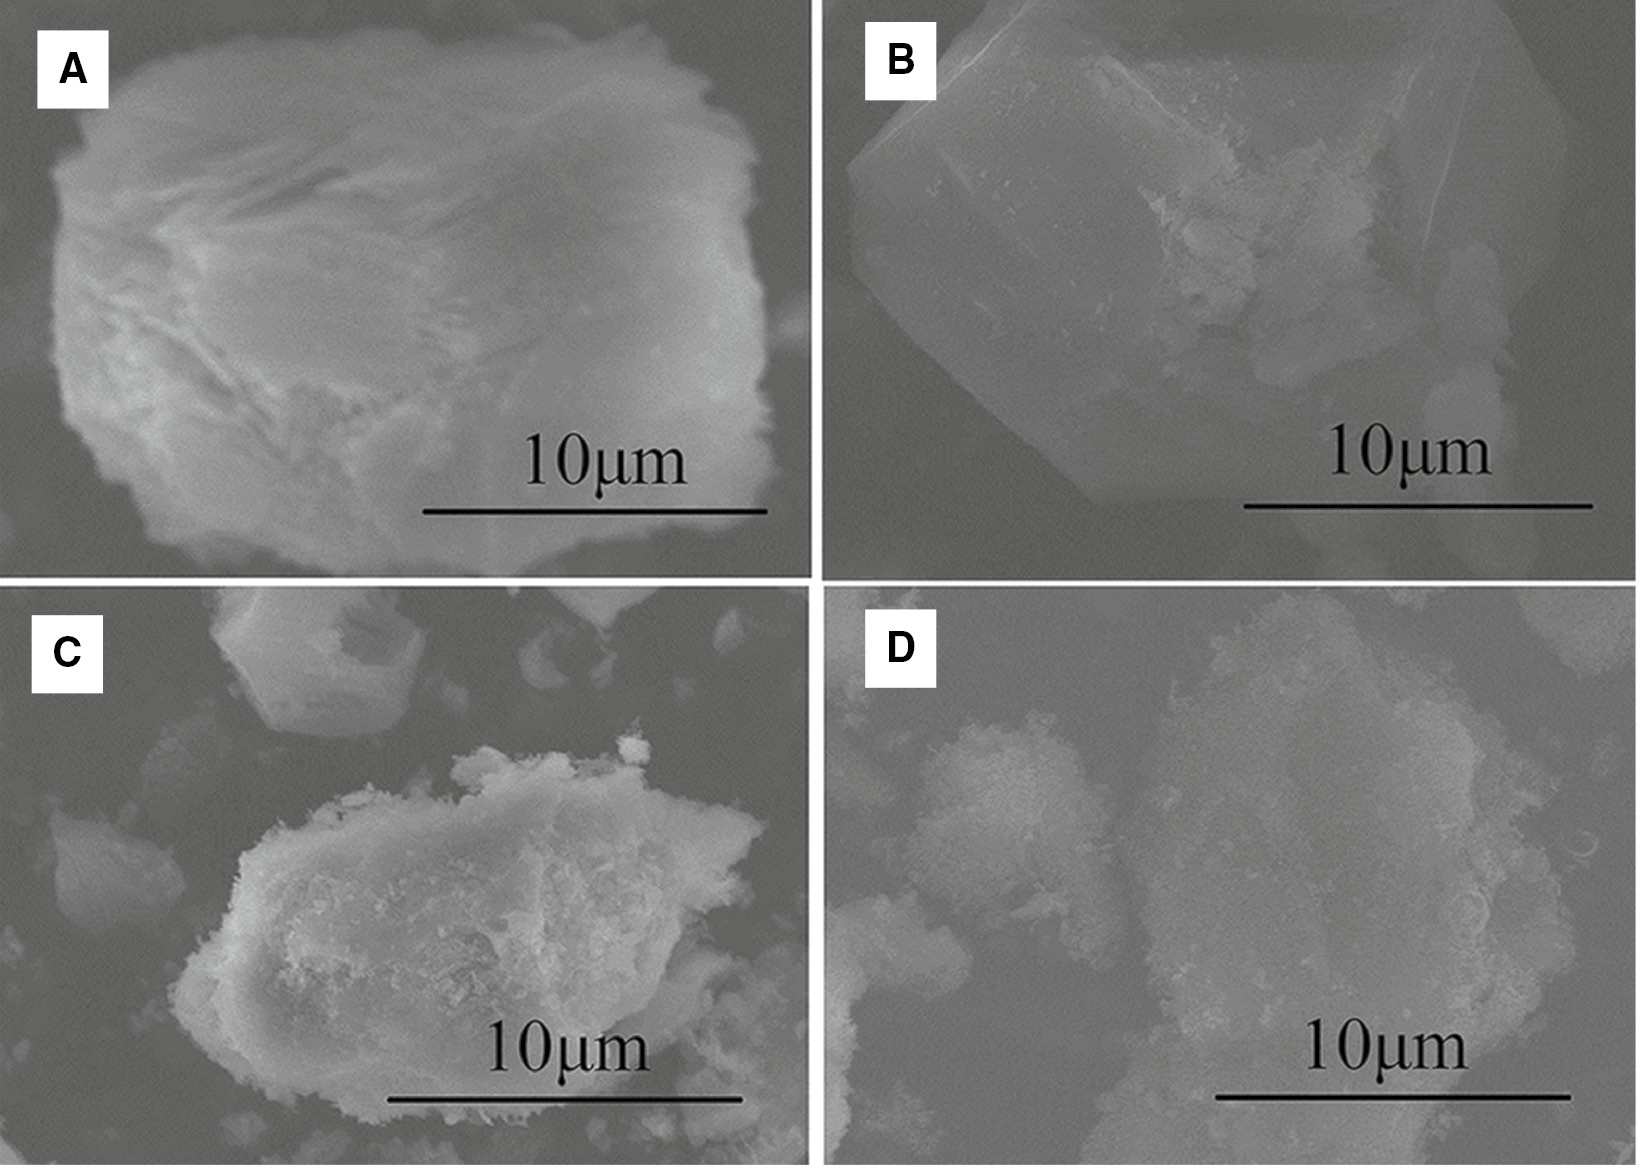
SEM images of the pyrolysis products (A) 700°C, (B) 800°C, (C) 900°C, (D) 1000°C.
The specific surface areas of the products under different temperatures range to 94–52.4 m2/g, the pore sizes range to 12.12–17.78 nm, and the pore volumes range to 0.2655–0.2128 cm3/g. The specific surface areas of the alumina products decrease as the pyrolysis temperatures increases, which is consistent with the SEM results (Figure 2). In the spray pyrolysis process, due to the special properties of the AlCl3 and the limited liquid surface tension, the specific surface areas of the products are less than that of the common activated alumina (>100 m2/g). The specific surface areas, pore sizes, andpore volumes of the products meet the requirements of the catalyst carrier, which are high purity (>92%), γ-Al2O3, big pore size (>7nm), and large pore volume (>0.1 cm3/g).
Based on the above results, the N2 adsorption-desorption isotherms of the pyrolysis products at 700°C and 900°C were investigated by using the Specific Surface Area Analyzer (Figure 3). From Figure 3, we can see that the adsorption volume of the pyrolysis products increases rapidly when the relative pressure exceeds 0.5. A significant hysteresis loop exists because the capillary condensation, adsorption isotherm, and desorption isotherm do not coincide. According to the classification of the adsorption-desorption isotherms by BDDT (Brunauer S., Deming L. S., Deming W. E. and Teller E classified the adsorption isotherms into five categories, called BDDT classification), the isotherm line belongs to the 4th category. The results show that the micropores and mesopores are distributed throughout the particles of the pyrolysis products. In addition, according to deBoer’s classification of the hysteresis loops, when the relative pressure is 0.9, the hysteresis speed of the desorption line in Figure 3B changes significantly, and when the relative pressure is 0.5, the desorption curve shown in Figure 3A has an inflection point as compared with that in Figure 3B. Both figures show that two pyrolysis products present different hysteresis loops. The hysteresis loop of the product produced at a temperature of 700°C is, therefore, classified as a hysteresis loop type H2 [28] with inkbottle-shaped and parallel-plate pores in the spray pyrolysis product, which coincides with the SEM results. The hysteresis loop of the product in 900°C is classified as type H3, which is associated with the slit-shaped pores. The results also show that with the increase of temperature, the spray pyrolysis technology can improve the specific surface area and increase the pore size of the activated alumina. These findings demonstrate the viability of the proposed process for the production of large pore-sized activated alumina adsorbents.
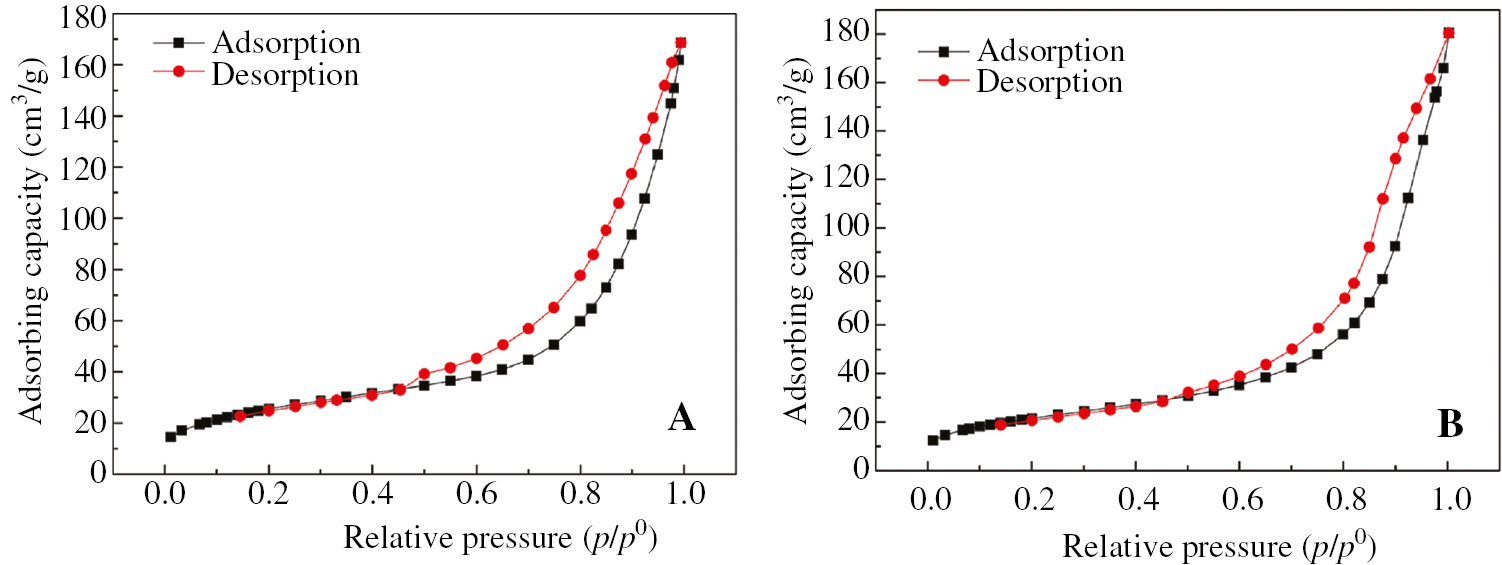
N2 sorption isotherm curves of the alumina products (A) 700°C, (B) 900°C.
4 Conclusions
The results of this study showed that temperature is the most influential factor on the alumina conversion ratio during the spray pyrolysis process. The conversion ratio, which was much higher than that achieved by other alumina production methods, reached above 99% at the following optimal conditions: of temperature of 1000°C, pressure of 0.3 MPa, and AlCl3 solution concentration of 10 wt%. According to the mineral phase analysis, the as-sprayed nanoparticle activated alumina consists of the γ-Al2O3 and α-Al2O3, and the γ-Al2O3 is the main phase of the activated alumina. The particles of the pyrolysis powders also show a granular structure. The characterizations of the products meet the requirement of catalyst carrier. Finally, the green utilization of high-alumina fly ash and acid recycling can be achieved by using this process.
Acknowledgments
We would like to acknowledge the support of the National Natural Science Foundation of China for funding Project Nos. U1202274, U1402271, 51004033, and 51374064. Project No. L2014096 was supported by the Science and Technology Research Projects of Education Department of Liaoning.
Conflict of interest statement: The authors declare that there is no conflict of interest regarding the publication of this article.
References
[1] Zhang XQ, Zhang TA, Feng W, Yan S, Sun J, Lv GZ. Light Met. 2015, 147–151.Search in Google Scholar
[2] Wu CY, Yu HF, Zhang HF. Trans.Nonferrous Met. Soc. China 2012, 22, 2282–2288.10.1016/S1003-6326(11)61461-1Search in Google Scholar
[3] Zhu XF, Zhang TA, Lv GZ, Liu Y, Zhao QY. Light Met. 2013, 239–244.Search in Google Scholar
[4] Li RB, Zhang TA, Li JJ, Li X, Nan WU. Electric Power 2013, 46, 40–46.10.1016/j.catcom.2013.05.020Search in Google Scholar
[5] Ahmaruzzaman M. Prog. Energy Combust. Sci. 2010, 36, 327–363.10.1016/j.pecs.2009.11.003Search in Google Scholar
[6] Lv GZ, Zhang TA, Zhang WG, Zhu XF, Liu Y, Wang L. Light Met. 2017, 115–120.10.1007/978-3-319-51541-0_17Search in Google Scholar
[7] Lv GZ, Zhang TA, Wang L, Si SD, Dou ZH, Liu Y. J. Cent. South Univ. 2014, 21, 4450–4455.10.1007/s11771-014-2448-8Search in Google Scholar
[8] Zhang TA, Lv GZ, Duo ZH, Nan XL, Song D, Li Y, He JC. Light Met. 2012, 510, 189–194.Search in Google Scholar
[9] Su SQ, Jing Y, Hong WM, Fan J, Yu QL, Ge L. Integr. Ferroelectr. 2011, 128, 155–162.10.1080/10584587.2011.576626Search in Google Scholar
[10] Cherkas NL, Cherkas SL. Crystallogr. Rep. 2016, 61, 285–290.10.1134/S106377451506005XSearch in Google Scholar
[11] Selishchev DS, Kolinko PA, Kozlov DV. Appl. Catal. A-Gen. 2010, 377, 140–149.10.1016/j.apcata.2010.01.030Search in Google Scholar
[12] Li J, Monaghan T, Masurtschak S, Bournias-Varotsis A, Friel RJ, Harris RA. Mat. Sci. Eng. A. 2015, 639, 474–481.10.1016/j.msea.2015.05.019Search in Google Scholar
[13] Yoo H, Kim HS, Hong BG, Sihn IC, Lim KH. J. Eur. Ceram. Soc. 2016, 36, 1581–1587.10.1016/j.jeurceramsoc.2016.01.032Search in Google Scholar
[14] Shi YL, Guo ZM, Hao JJ, Lin T, Zeng X. Adv. Mater. 2012, 482–484, 933–937.Search in Google Scholar
[15] Koh JH, Weber N, Virkar AV. Solid State Ionics. 2012, 220, 32–38.10.1016/j.ssi.2012.06.006Search in Google Scholar
[16] Takbiri M, Jozani KJ, Rashidi AM, Bozorgzadeh HR. Micropor. Mesopor. Mat. 2013, 182, 117–121.10.1016/j.micromeso.2013.08.025Search in Google Scholar
[17] Ingole RS, Lokhande BJ. J.Mater. Lett. 2016, 168, 95–98.10.1016/j.matlet.2016.01.040Search in Google Scholar
[18] Ji ZG, Zhao L, He ZP, Zhou Q, Chen C. J. Mater. Lett. 2006, 60, 1387–1389.10.1016/j.matlet.2005.11.057Search in Google Scholar
[19] Watanabe T, Miki Y, Masuda T, Deguchi H, Kanai H. Ceram. Int. 2017, 37, 3183.10.1016/j.ceramint.2011.05.085Search in Google Scholar
[20] Tok AIY, Boey FYC, Zhao XL. J. Mater. Process. Tech. 2006, 178, 270–273.10.1016/j.jmatprotec.2006.04.007Search in Google Scholar
[21] Zhang J, Khatri I, Kishi N, Mominuzzaman SM, Soga T. Thin Solid Films 2011, 519, 4162–4165.10.1016/j.tsf.2011.02.006Search in Google Scholar
[22] Tesfamichael T, Ahsan M, Notarianni M. Thin Solid Films 2014, 558, 416–422.10.1016/j.tsf.2014.02.084Search in Google Scholar
[23] Shamala KS, Murthy CS, Rao KN. Mater. Sci. Eng. B. 2004, 106, 269–274.10.1016/j.mseb.2003.09.036Search in Google Scholar
[24] Zhao AC, Zhang TA, Lv GZ, Tian W. Adv. Mater. Sci. Eng. 2016, 6, 1–6.10.1155/2016/2681038Search in Google Scholar
[25] Zhang TA, Dou ZH, Lv GZ, Liu Y. CN Patent CN101823742A, 2010.Search in Google Scholar
[26] Manivasakan P, Rajendran V, Rauta PR, Sahu BB. Powder Technol. 2011, 211, 77–84.10.1016/j.powtec.2011.03.037Search in Google Scholar
[27] Jaroniec AM, Solovyov LA. Langmuir. 2006, 22, 6757–6760.10.1021/la0609571Search in Google Scholar PubMed
[28] Tompsett GA, Krogh L, Griffin DW, Conner WC. Langmuir. 2005, 21, 8214–8125.10.1021/la050068ySearch in Google Scholar PubMed
©2018 Walter de Gruyter GmbH, Berlin/Boston
This article is distributed under the terms of the Creative Commons Attribution Non-Commercial License, which permits unrestricted non-commercial use, distribution, and reproduction in any medium, provided the original work is properly cited.
Articles in the same Issue
- Frontmatter
- In this issue
- ASAM-6
- The 6th Asian Symposium on Advanced Materials: Chemistry, Physics and Biomedicine of Functional and Novel Materials (ASAM-6; Hanoi, Vietnam, September 27–30, 2017)
- Synthesis and characterization of (4-arm-star-PMMA)/PMMA-g-SiO2 hybrid nanocomposites
- Factors influencing green strength of commercial natural rubber
- Removal of arsenic from water using crumpled graphite oxide
- Adsorption behavior of Cd2+ ions using hydroxyapatite (HAp) powder
- Study on characteristics, properties, and morphology of poly(lactic acid)/chitosan/hydroquinine green nanoparticles
- Original articles
- Green synthesis and stabilization of earthworm-like gold nanostructure and quasi-spherical shape using Caesalpinia sappan Linn. extract
- Catalytic performance of Ag, Au and Ag-Au nanoparticles synthesized by lichen extract
- Comparative kinetics of the alkali-catalyzed sunflower oil methanolysis with co-solvent under conventional and microwave heating with controlled cooling
- Facile nitration of aromatic compounds using Bi(NO3)3·5H2O/MgSO4 under mechanochemical conditions
- Optimization of the treatment process of zinc leaching residue by using the response surface method
- A new green process to produce activated alumina by spray pyrolysis