Microwave assisted adsorption based elution: a benign green process optimized by Box-Behnken modeling yields pure vasicine from Adhatoda vasica
-
Shankar Subramaniam
Shankar Subramaniam obtained his BTech (Hons) in Biotechnology from SASTRA University in 2010. He is currently pursuing his PhD in Biotechnology at SASTRA University. His area of interest is separation engineering and natural products.
Aravind Sivasubramanian obtained his PhD from University of Madras in 2004. He is currently working as Assistant Professor – III in SASTRA University in the field of natural products separation, purification and its related applications.


Abstract
Development of economical and rapid high yielding industrial processes for isolation of commercially important plant molecules have been in current industrial vogue. Adhatodavasica, a functional dietary supplemental plant, is found to harbor vasicine, a commercially important and physiologically active alkaloid. Attempts were made to increase the yields of vasicine by a viable “green” process – microwave assisted adsorption based elution (MAABE) with silica gel. Microwave (300 W) assisted extraction was done with 6% HCl/water (solid loading – 10%), which in 4 h yielded vasicine (8.8 mg/g of leaves, 0.88%). A Box-Behnken designed response surface methodology (RSM) optimized the extraction parameters to 9.31% solid loading, 6.64% HCl/water and 4.1 h, respectively. Further, adsorption based elution using silica gel and desorption with 70% ethanol/water yielded pure vasicine (1.12%) (recovery=93%, purity=95%). The adsorption isotherms studied to understand the adsorption mechanism suggested that the process followed the Langmuir theory. MAABE required less time and labor, in addition to its relative safety and as a “green” alternative process, to give high yields of commercially important vasicine.
1 Introduction
The modern world of medicine has witnessed phenomenal advances in discovery of biologically active molecules, especially from natural sources. In spite of their tremendous utility in therapy and prevention of diseases, they still could not be harnessed completely in the pharmaceutical realm. This is due to the inefficient and uneconomical processes developed for extraction of these molecules from their plant sources. Therefore, the pursuit for these natural molecules has led to commercial development of specialized processes in extraction and purification of metabolites and scaling up of these processes to the industrial scale. However, many of these molecules have low recovery through conventional processes, but high market demand [1]. The extraction of phytochemicals from plant matrices is a crucial step in process development and manufacturing of therapeutic phytochemical molecules in the realm of industrial and engineering chemistry.
One such highly demanded molecule of significant bioactivity is vasicine, a quinazoline alkaloid, found as a major metabolite from leaves of Adhatoda vasica. A. vasica has been traditionally used to treat cold, cough, chronic bronchitis, asthmatic problems, as a sedative expectorant, antispasmodic, and rheumatic painful inflammatory swellings [2]. Vasicine is an effective bronchodilator, and is used to manage respiratory problems along with vasicinone, another alkaloid found in A. vasica [3]. Other molecules from its leaves include vasicoline, adhatodine, vasicolinone and anisotine [4]. Vasicine is also being used as a dietary supplement (Morpheme remedies, Vasaka and Himalaya herbals, Vasaka) to treat allergic respiratory problems [5, 6]. Though this molecule has been long found in this plant, it is imperative to state that this molecule is found along with many other molecules of similar moiety, which makes its purification challenging. Since vasicine has its utility as a dietary supplement, the process which isolates it in pure form demands the use of less hazardous solvents and techniques. By contrast, conventional solvent extraction and column chromatography techniques use harmful solvents, in addition to providing less yield of metabolites and therefore, many novel extraction procedures are developed which are environmentally friendly and more efficient [7, 8]. Therefore, the requirement of efficient nonconventional processes is clear.
From the perspective of industrial chemistry, since plant materials have diverse chemical compounds based on polarity and solubility, extraction procedures can interact with other components of the plant matrix [9, 10]. Current trends have witnessed developments which limit damage to the environment by providing alternative and sustainable technologies that optimize the efficiency of material usage with minimum wastage. Microwave energy is one such “green” option which could be used to speed up the extraction processes. Many recent extraction processes use microwaves for efficient natural product isolation, since this causes effective mass transfer of solutes inside the cells to surrounding solvents [11]. In addition, the extractable levels of compounds are also affected by other factors including solvent composition, extraction time, extraction temperature, pH, solvent to solid ratio and the number of extraction steps [12–14]. Classical optimization protocols use the “one-factor-at-a-time” methodology, in which only one factor is varied at any given time while all others are kept constant. This approach is not only time consuming, but also expensive. In addition, possible interaction effects arising between variables cannot be evaluated and misleading inferences may be drawn. Response surface methodology (RSM) can, however, overcome these difficulties by allowing study for possible interaction effects between variables [15–17]. If adequately used, this potent tool can provide the best optimal conditions that might significantly improve a separation process [18].
To the best of our knowledge and based on literature search, no previous reports are available for development of similar microwave assisted extraction and adsorption assisted isolation of vasicine from A. vasica.
2 Materials and methods
2.1 Plant material and isolation of vasicine
Leaves of A. vasica were obtained from the medicinal plant farms in Thanjavur, India. The plant was authenticated by Dr. Jayendran, Department of Botany, Government Arts College, Ootacamund, India. A voucher specimen (JDB1512) was deposited in the Government Arts College. The leaves were shade dried, ground to a fine powder and used for extraction. Extracts were prepared by soaking 10 g of plant material in 100 ml of suitable solvents at room temperature for 24 h and repeated thrice with the residue. The extract was filtered through Whatman No. 1 filter paper, and then all the filtrates were pooled up successively and concentrated under vacuum by a Rotary evaporator (Buchi Rotavap R-210, Swiss). Based on high performance thin layer chromatography (HPTLC) profiling, the extract (methanol, Merck®, India) (12 g) which had the highest extractive value from leaves (100 g) was extracted through acid-base extraction. The extract was suspended in 5% HCl/water under reflux at 90°C for 1 h. Then, the extract was filtered through Whatman No. 1 filter paper and the filtrate was neutralized using liquor ammonia till pH 8. The precipitate formed was subjected to column chromatography with basic alumina (Merck®, India), and out of the subsequent fractions collected (1–13), fraction 4, 5 precipitated to afford vasicine. The precipitate was dissolved in absolute ethanol (Merck®, India), which gradually crystallized to give pure vasicine (420 mg).
2.2 Selection of extraction solvent
Some 10 g of dried plant material was soaked in 100 ml of respective solvents and the extract obtained was analyzed for target metabolites through HPTLC. The solvent which yielded the maximum amount of desired metabolites was taken for further modeling and RSM development. Water and 5% HCl in water were one of the solvents used in the extraction. Since, the motive of the current study is to extract maximum vasicine through environmentally friendly methodology, HCl in water was used as solvent for all further studies.
2.3 Selection of process parameters and experimental ranges
Before adopting a standardized experimental design protocol and development of the study by RSM based modeling, preliminary sets of tests were performed by following the classical “one variable at a time” approach to roughly select the applicable factors and the range of these factors in microwave assisted extraction. Firstly, the effect of microwave power using a multimode microwave device (Synthos 3000, Anton Paar, Austria) and microwave time on extraction were investigated, where five sets of plant material (1 g) containing 50 ml of 5% HCl/water kept in different microwave powers (300–900 W) each for times of 2–10 min. Secondly, we investigated the effect of solid/solvent ratio or solid loading where five sets of plant material (5–25%) containing 50 ml of 5% HCl/water were extracted in microwave (300 W) for 6 min. Next, we investigated the influence of %HCl in water ratio in the extraction process by considering 10 sets (2–20% of HCl in water) added to plant material (10%) extracted in microwave (300 W) for 6 min. Next, the influence of extraction time was studied where plant material (10%) in 6% HCl in water extracted in microwave (300 W) for 6 min was stirred using a magnetic stirrer at 200 rpm for different extraction times (1–24 h). The influence of agitation was then studied, where different sets containing the plant material were stirred at different agitation speeds (200–1000 rpm). The influential experimental parameters which depicted higher yield of vasicine obtained were analyzed by HPTLC and were further considered for systematic experimental design to find the optimum parameter, set through the RSM procedure.
2.4 Experimental design for RSM
Most influential parameters identified based on the preliminary experiments namely, solid loading (%), HCl/water (%), extraction time (3 factors) and three levels (-1, 0, +1) from their observed range were considered for the Box-Behnken method based experimental design to obtain the standard set of experiments for RSM based modeling and optimization. Three factors and three levels of Box-Behnken design generated 15 sets of experiments/runs which were carried out with three replicates, and the average is depicted in Table 1. To minimize the effects of inexplicable variability in the observed response due to inessential factors, the order of experiments was randomized. Experimental data thus obtained were fitted in a second-order polynomial model and regression coefficients were determined as in Eq. (1):
where, Y is the predicted response factor of the amount of vasicine (mg/g dry material [DM]), β0 is the intercept and βi, βii, βij and Xi are regression coefficients for linear effects, regression coefficients for squared effects, regression coefficients for interaction effects and the coded experimental levels of the parameters, respectively.
Box Behnken design setting of the independent variables and experimental results for the response variables, amount of vasicine.
| Experiments | Factors | Vasicine (mg/g DM) (Y1) | ||
|---|---|---|---|---|
| Solid loading (%) (X1) | HCl/water (%) (X2) | Extraction time (h) (X3) | ||
| 1 | 10 (0) | 6 (0) | 4 (0) | 11.2 |
| 2 | 15 (1) | 4 (-1) | 4 (0) | 7.2 |
| 3 | 15 (1) | 6 (0) | 2 (-1) | 7 |
| 4 | 15 (1) | 8 (1) | 4 (0) | 8.8 |
| 5 | 10 (0) | 8 (1) | 6 (1) | 8.6 |
| 6 | 10 (0) | 4 (-1) | 6 (1) | 7.5 |
| 7 | 5 (-1) | 6 (0) | 2 (-1) | 7.4 |
| 8 | 10 (0) | 4 (-1) | 2 (-1) | 7 |
| 9 | 5 (-1) | 8 (1) | 4 (0) | 9.3 |
| 10 | 5 (-1) | 4 (-1) | 4 (0) | 7.9 |
| 11 | 10 (0) | 6 (0) | 4 (0) | 11 |
| 12 | 10 (0) | 8 (1) | 2 (-1) | 9 |
| 13 | 5(-1) | 6 (0) | 6 (1) | 8.6 |
| 14 | 15 (1) | 6 (0) | 6 (1) | 6.6 |
| 15 | 10 (0) | 6 (0) | 4 (0) | 11 |
Values in parentheses are coded form of variables.
DM, Dry material.
2.5 Analysis of response variables
Commercial grade vasicine (Sigma-Aldrich) was used as the standard for the experiments. The amount of vasicine obtained in each experimental run was the response variable taken. The amount was quantified by HPTLC densitometric analysis, which was performed on aluminum-backed plates (20×20 cm) coated with 0.2 mm layer of silica gel 60 F254 (E-Merck, Germany). Sample application was done as 6 mm bands using a CAMAG automatic TLC sampler 4 (ATS4) applicator (Switzerland) fitted with a CAMAG microliter syringe. A constant application rate of 150 nl/s was maintained. The linear ascending technique was used to develop the plates to a distance of 80 mm with solvent system (ethyl acetate:methanol, 8:2 (%, v/v) with a few drops of ammonia) as the mobile phase in the CAMAG automatic developing chamber 2, which was previously saturated with mobile phase vapor for 30 min at 25°C. Developed plates were scanned using a CAMAG TLC scanner 4, and visualized under UV light at 254 nm and 365 nm. The scanned images were later processed for densitometric analysis using VisionCATS v1.4.0. Validation of the proposed HPTLC method was done based on guidelines of the International Conference on Harmonization [19]. A concentration of 100–800 ng/spot was checked for linearity of both the compounds, the concentration was plotted against peak area and a concentration curve was obtained. Specificity of this method was confirmed by analyzing the Rf values of spots of extracted vasicine and comparing those with standards. The HPTLC analysis for samples obtained from different RSM runs and the final optimized run were done using similar conditions used for standards. 1H Nuclear magnetic resonance (NMR) and 13C NMR spectra were determined on a Bruker-300 NMR spectrometer and chemical shifts were expressed as parts per million against Trimethylsilane (TMS) as internal reference. For Fourier transform infrared (FTIR) analysis, 1 mg of compounds was ground along with 100 mg of potassium bromide (KBr – pre-ground and desiccated at 500°C for 12 h) and the disc was prepared by the hydraulic pressure method. FTIR (Perkin Elmer) analysis was performed at a wave number range of 400–4000 cm-1. The final purity of extracted compounds was analyses using an High Performance Liquid Chromatography–Diode Array Detection (HPLC-DAD) system. An Agilent 1200 Series HPLC system (Waldbronn, Germany) with a G1315D diode-array detector was used. Samples (20 μl) were injected into a Phenomenex Kinetex XB-C18 column (75 mm×3 mm, 2.6 μm). The mobile phase consisted of 10 mm ammonium formate (NH4COOH) in water:acetonitrile (98:2) (A) and 10 mm ammonium formate (NH4COOH) in water:acetonitrile (2:98) (B). The flow rate was maintained at 1.0 ml/min.
2.6 Adsorption based elution studies
2.6.1 Selection of adsorbent:
Initially, commercial activated carbon (particle size: 200–325) and silica gel (60–120 mesh) were selected for adsorption studies. Since efficient adsorption was observed only in silica gel, further optimization studies were done with silica gel. Three grades of silica gel (60–120, 100–200 and 230–400 mesh) were used for the experiments and the grade that separated the vasicine with maximum recovery and purity was used for further studies.
2.6.2 Adsorption based elution:
Adsorption experiments were done with optimized microwave assisted extracts. Briefly, plant material suspended in HCl/water at optimized conditions was subjected to microwave energy at 300 W for 6 min. The microwave treated suspension was stirred at 200 rpm for 4 h. Then, the suspension was filtered with Whatman No. 1 filter paper under vacuum to remove the insolubles. The filtrate was neutralized with dilute NaOH (sodium hydroxide) up to pH 8 which created turbid insolubles. To this suspension, silica gel (10%) was added and the extract was kept in an orbital shaker at 200 rpm for 30 min. Then, the silica gel was allowed to settle and the top liquid was discarded. The silica gel was washed with water repeatedly to remove sticky mass loosely stuck with the silica. Then, the silica was dried under vacuum using a rotary evaporator. To the dried silica which contained adsorbed plant metabolites, hydro-alcohol (70% ethanol in water) was added and kept in the orbital shaker for 30 min. Then, the desorbed silica was allowed to settle and the top layer containing the metabolites was aspirated and evaporated under vacuum to yield pure vasicine.
2.6.3 Isotherm studies:
The neutralized extract (NE) (turbid suspension) was taken at various initial concentrations. The initial concentrations (Ci) of NE and vasicine were obtained by HPTLC densitometric analysis. Precisely 50 ml of NE solution of known initial concentration (Ci: 50–500 mg/l) was shaken at the constant agitation speed (200 rpm) with silica (20 g/l) for a specific duration of 30 min in a thermostatic orbital incubator shaker (Labtech, India). After equilibration, the final concentrations (Ce) were estimated again using HPTLC. A similar experiment under identical conditions was done with pure vasicine (Sigma-Aldrich) (50 mg/l) dissolved in 5% HCl/water (v/v) and appropriately diluted with the same solvent to the required initial concentrations (Ci: 50–500 mg/l). The isotherm models with single solute (vasicine) and multisolute (NE) were compared and difference and adsorption capacities were observed. The various experimental conditions are given in Table 1. The amounts adsorbed (in mg/g) were calculated using the following relationship: amount adsorbed (qe)=(Ci-Ce)/m, where Ci and Ce are the initial and final concentrations (in mg/l) of vasicine, respectively, and m is the mass of silica (in mg/l).
2.7 Statistical analysis
Results obtained were expressed as the mean±standard deviation of the replications. Results obtained in the experimental run generated by Box-Behnken design were expressed as mean of replicates. RSM based model fitting and statistical analysis was performed using Design Expert (release 9.0.3.1; State-Ease, Inc., Minneapolis, MN, USA). An analysis of variance (ANOVA) was performed to determine the significant levels defined at p<0.05, p<0.01 and p<0.001.
Extractions were performed in replicates at all points in the study design. The corresponding extracts were analyzed for the dependent variables (responses): amount of vasicine (Y1). Mean values were analyzed using least-square regression and fitted to the generalized second-order polynomial model [(Eq. 1)] to all of the dependent Y response variables. Response surface plots were developed using reduced fitted polynomial models which allow the relationship between the experimental levels and the response of each factor to be examined and the optimum conditions to be recognized.
3 Results and discussion
3.1 Selection of extraction solvent
Extraction was initially performed using different solvents based on polarity. Pure solvents in the increasing order of their polarity were selected for study, as solubility of metabolites varies with polarity. Since vasicine (Figure 1) is an alkaloid with an alkaline nature, dilute acidic solvents such as hydrochloric acid (5–10%) in water were used. As pure water extract had no appreciable yield of vasicine it was excluded from further studies. The maximum amount of extract and metabolites were obtained in methanol, therefore it was selected for conventional isolation of metabolites. Exhaustive extraction using methanol from leaves yielded methanolic extract which was analyzed for amount of vasicine through HPTLC. The amount was found to be 1.2% (w/w) in leaves of A. vasica, which corresponds to previous reports [20]. HCl (5%) in water used in extraction yielded a significant amount of vasicine (0.32%), but this was lower than methanolic extracts. The purity was also less (65–70%). Since water based extraction is “green” and safe, studies were advanced to optimize the yield and purity of vasicine through use of this process.
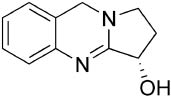
Vasicine.
3.2 Isolation of molecules
To find the yield obtained through conventional isolation methods, column chromatography was performed and the vasicine crystallized was analyzed for its yield and purity. The fractions collected led to the isolation of pure vasicine as characterized by NMR spectroscopy. The spectral data (Figure 2) were compared and confirmed with previous studies [21]. As the opted extraction process produced a low yield of vasicine, further studies were done to optimize the extraction efficiency and recovery of these metabolites through microwaves and RSM.

Structural elucidation of vasicine. (A) Fourier transforms infrared (FTIR) spectra of vasicine.

Structural elucidation of vasicine. (B) Proton and carbon nuclear magnetic resonance (NMR) of vasicine.
3.3 Selection of variables and experimental ranges
Microwaves are electromagnetic waves with frequency ranging from 300 MHz to 300 GHz. The application of microwaves in extraction of compounds is strictly limited to conversion of electromagnetic energy into heat energy [22]. In the current study, 5% HCl in water was taken as a solvent to solubilize vasicine from plant matrix into solvent to be later purified. The problem with this is that vasicine is water insoluble and does not easily diffuse out of plant matrix (leaves). Therefore, HCl was added in water to increase its solubility (due to increased acidity) and microwave energy was applied to pull out vasicine into solvent. The process of extraction was tried initially with regular heating (Soxhlet) and it had a larger time duration (around 24 h) to completely extract the vasicine from the plant matrix. However, microwave assisted extraction depicted similar yields with 6 min of irradiation, the reason being that plant leaves of A. vasica are thick and fleshy and therefore require much time for conventionally (externally) applied heat to weaken the sturdy plant tissues to yield vasicine. The larger time required in this case is due to the time consumed for energy transfer through conduction through external material (plant tissue surface) in the presence of thermal gradients, whereas microwave irradiation delivers energy directly to materials (plant cells inside tissues) through molecular interactions with the electromagnetic field, which gets converted to thermal energy [23]. The energy consumption in the developed process is therefore far less compared to the conductive heating process to isolate vasicine from its plant matrix. The yield of vasicine with respect to microwave power and time of irradiation is shown in Figure 3. Observations depict that extraction yield increases until 6 min of irradiation and then becomes stationary. Microwave irradiation at 300 W and 450 W power yielded the same amount of vasicine. However, with increase in microwave power, the leaves were rapidly degraded due to higher localized heat, which decreased the extraction efficiency. Thus, microwave power and time of irradiation were fixed at 300 W for 6 min. Microwaves have the unique ability to penetrate into the plant matrix directly and cause localized heating. The temperature can be adjusted by adjusting microwave power. This highly localized heating causes the solutes inside the plant matrix to selectively migrate to the surrounding solvents at a higher mass transfer rate. In addition, the severe mechanical stress and localized pressure build up inside the plant cells disrupt them, causing more solute to escape. Thus, microwave power nullifies the mass transfer limitations generally caused during the extraction process [11]. These dynamic features make microwaves more applicable in phyto-molecule isolation of current commercial processes [24, 25].
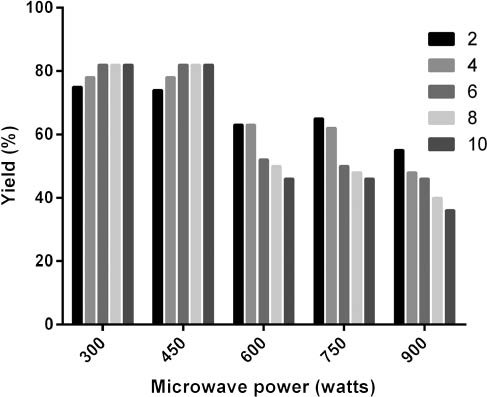
Effect of microwave energy on extraction yield of vasicine. Plot shows yield (%) of vasicine recovered from total vasicine available in plant matrix by applying different microwave energy (W) for different irradiation durations (2–10 min).
Initially, the influence of solid loading (%) in extraction process was studied. The maximum yield obtained was 88% yield at 10% solid (Figure 4A). The yield % (88%) was found in comparison with the total amount of vasicine present in plant material (1.2%). It was observed that the extraction yield increases as the solid amount increases, with the highest obtained at 10%, which decreased with further increase in solid. This was due to the fact that the more solid could promote a decrease in concentration gradient because of less available solvent for extraction. Higher solvent availability increases diffusion rate allowing maximum extraction [26–28]. A previous report suggested that extraction yield from dry peel powders of pomegranate was increased while increasing solvent-solid ratios [29]. The extractive ability becomes constant above a certain solvent-solid ratio, which suggests the reach of maximum concentration gradient. Next, the effect of % HCl in water on extraction was investigated. The maximum yield obtained was 88% at 6% of HCl in water (Figure 4B). The extraction of alkaloid compounds from a sample/material is directly related to the compatibility of the compounds with the solvent system according to the principle “like dissolves like” [30]. Change in HCl content in water changes acidity which affects the solubility of alkaline compounds (alkaloids). The focus of the present study was maximum recovery of vasicine, which made 6% HCl/water solvent system ideal for extraction. Finally, impact of extraction time in yield of metabolites from plant material was studied (Figure 4C). The amount of metabolites increased along with time, but became constant over a time limit. This might be due to the fact that the maximum extractive value is reached over the time duration and hence no further mass transfer of solute from plant material is possible. The maximum time required to reach maximum yield of metabolites is 4 h, which is relatively sooner than any conventional extraction process which involves a minimum of 24–48 h. The effect of agitation signified linearity in observations and became stationary from 200 rpm (Figure 4D). These observations signify the fact that the process is rapid in addition to minimizing the costs of operation of process.

Effect of different influential parameters on yield of vasicine. Plot depicts that except for agitation (following linearity), all other parameters affect the extraction process.
3.4 Extraction optimization by RSM
3.4.1 HPTLC analysis
The amount of vasicine obtained in each optimization step and RSM experimental runs was analyzed and quantified by HPTLC. The HPTLC method was developed and validated for effective quantification of vasicine in each sample obtained during process optimization. The mobile phase was ethyl acetate:methanol, 8:2 (%, v/v) with a few drops of ammonia, which resulted in a sharp significantly resolved peak at Rf values of 0.62. The calibration plot of the peak area was obtained against the area of vasicine and was linear in the range of 100–800 ng/spot. The linear regression equations were Y=14.6x+4338, where Y is the response (area) and x is the concentration of metabolite. The correlation coefficient (R2) was 0.98 and was highly significant (p<0.01).
Peaks of vasicine from different process samples were identified by comparing their spots at their respective Rf=0.62 value with those obtained by chromatography of the standards under the same conditions. The content of metabolites was later quantified using regression equations.
3.4.2 Statistical analysis
Using the Box-Behnken experimental design, the second-order polynomial quadratic response equation [Eq. (1)] was used to establish a mutual link between the studied parameters. An empirical mutual relationship between the response dependent variables and independent parameters based on the coded factors was established according to the equation below.
The Box-Behnken matrix and experimental results for recovery of vasicine from acid-base extraction process are summarized in Table 1. Analysis of variance was used to assess the statistical significance of the quadratic model [31, 32]. The suitability and significance of the studied model could be better evaluated by utilizing ANOVA. The models were checked using a numerical method that used the correlation coefficient (R2) and the adjusted R2 (R2adj). Each model should account for the observed variability in the obtained data, which is depicted by R2. It is suggested that for a good statistical model, the R2 value should be in the range of 0–1.0, much nearer to 1.0 for better fit. R2adj is described to modify the R2 by taking into account the number of predictors in the given model. The results of ANOVA for amount of vasicine are depicted in Tables 2 and 3; statistical observations demonstrate that the regression model has a high coefficient of determination (R2=0.991), indicating that 99.1% of the variations in the extraction process of metabolites could be explained by the independent factors. Also, the R2adj (0.977) value explains the significance of the model [33]. There seems to be no significant difference between R2 and R2adj values which is desirable for the model. “Adeq precision” measures the difference between signals to noise ratio, which for this model is 23.24. Since, it is >4.0, it is considered as an adequate desirable value [34]. In addition, a low coefficient of variation was observed (2.72%) which is usually desired, indicating good reliability for the experiments carried out in the process. ANOVA in Table 4 demonstrates the results of the lack of fit test for the models, which describes the variation in the data around the fitted model. In the present case, the F-value for lack of fit test is 6.06 which is not significant and implies that the models sufficiently describe the obtained data. Also, in the present study F-values are greater and p values are much less, with few exceptions depicted in Table 3, which implies that the coefficients obtained are significant in the model.
Analysis of variance for response surface quadratic model.
| Source | DF | SS | MS | F-value |
|---|---|---|---|---|
| Model | 9 | 32.87 | 3.65 | 67.84 |
| A | 1 | 1.62 | 1.62 | 30.09 |
| B | 1 | 4.65 | 4.65 | 86.4 |
| C | 1 | 0.1 | 0.1 | 1.88a |
| A2 | 1 | 10.62 | 10.62 | 197.25 |
| B2 | 1 | 4.23 | 4.23 | 78.65 |
| C2 | 1 | 14.34 | 14.34 | 266.41 |
| AB | 1 | 0.01 | 0.01 | 0.19a |
| AC | 1 | 0.64 | 0.64 | 11.89b |
| BC | 1 | 0.2 | 0.2 | 3.76a |
All values are significant at 1%, bsignificant at 5%, anot significant.
A – solid loading (%), B – HCl/water (%), C – extraction time.
DF, Degrees of freedom; MS, mean square; SS, sum of squares.
Regression coefficients of the predicted second-order model for the response variables, amount of vasicine.
| Model parameters | Regression coefficient | SE |
|---|---|---|
| Intercept | 11.07 | 0.13 |
| A | -0.45 | 0.082 |
| B | 0.76 | 0.082a |
| C | 0.11 | 0.082 |
| A2 | -1.7 | 0.12 |
| B2 | -1.07 | 0.12 |
| C2 | -1.97 | 0.12 |
| AB | 0.05 | 0.12a |
| AC | 0.4 | 0.12b |
| BC | 0.23 | 0.12a |
| S.E | 0.11 | |
| R2 | 0.991 | |
| Adj-R2 | 0.977 | |
| CV% | 2.72 | |
| Adeq Precision | 23.24 |
All values are significant at 1%, bsignificant at 5%, anot significant.
CV, Coefficient of variance; R2, coefficient of multiple determinations; SE, standard error.
Analysis of variance for the lack of fit testing for vasicine.
| Source | DF | SS | MS | F-value |
|---|---|---|---|---|
| Lack of fit | 3 | 0.24 | 0.081 | 6.06a |
| Pure error | 2 | 0.027 | 0.013 | |
| Total error | 5 | 0.27 | 0.54 |
aNot significant.
DF, Degrees of freedom; MS, mean square; SS, sum of squares.
The coefficients and standard error are depicted in Table 3. The corresponding F-values for coefficients indicate that the %HCl/water (X2) produces the largest effect in extracting vasicine in the process (F-value: 86.4, p<0.0001). This was followed by solid loading (%) (F-value: 30.09, p<0.0001). This is required for an experimental analysis to check the adequacy of the applied model which can ensure an excellent estimation of real conditions [35]. This is depicted by Figure 5, which shows comparison between experimental and predicted data. It demonstrates good agreement between the axes (R2=0.991). Also, less difference between R2 and R2adj for both the responses indicates experimental values are in good agreement with the predicted values.

Plot of predicted response vs. the calculated response for vasicine.
3.4.3 The combined effect of operational factors
A three-dimensional response surface and contour graph were plotted based on the obtained model equation to evaluate the interaction among the operational factors and to determine the optimum values of each parameter [36]. The effects of solid loading (%), %HCl/water, and extraction time on recovery of vasicine are shown in Figure 6. These plots show how low and high values of operational factors influence extraction response variables. In all of the plots of Figure 6, the yield of metabolites increases with increase in factor levels up to moderate level (0) and then decreases. For example, in Figure 6A, interaction between solid loading (%) (A) and %HCl/water (B) is plotted, where yield of metabolites increases as A increases from 0–10 and then decreases when it extends to 10. Similarly, as the solvent-solid ratio (B) reaches 6%, the yield reaches maximum and then decreases. This phenomenon is seen for all of the surfaces drawn based on interaction effects of different factors.

Response surface plots for yield of vasicine showing effect of operational parameters.
3.4.4 Optimization of operational factors
Usually, the numerical optimization method is used for optimization in which a desirable value for each input factor and response can be selected [33]. Optimizations can be set to establish an output value for a given set of conditions by selecting possible input optimizations, including range, maximum, minimum, target or none (for responses). The input parameters were entered as specific range values, whereas the response was designed to achieve a maximum value. Using these conditions, the maximum achieved amount of vasicine was 11.23 mg/g DM at 9.31% solid loading, 6.64%HCl/water and 4.1 h of extraction at 300 W of microwave power for 6 min and 200 rpm of agitation during extraction. This result indicates an acceptable fit among the obtained data and the desirability of the model at all points. An additional experiment was carried out to confirm the amount of metabolites yielded at optimized conditions. The value obtained was 11.22 mg/g DM for vasicine. This was in accordance to predicted values as in Table 5.
Optimum conditions obtained from response surface modeling and one variable at a time methods.
| Variable name | Optimum values obtained | ||
|---|---|---|---|
| Response surface modelling | One variable at a time | ||
| X1 | Solid loading | 9.31% | 10% |
| X2 | HCl/water | 6.64% | 6% |
| X3 | Extraction time | 4.1 h | 4 h |
| X4 | Microwave power | NC | 300 W |
| X5 | Microwave time | NC | 6 min |
| X6 | Agitation | NC | 200 rpm |
| Predicted valuesa | |||
| Vasicine (mg/g DM) | 11.23±0.03 | – | |
| Observed valuesb | |||
| Vasicine (mg/g DM) | 11.22±0.03 | 3.5–8.8 | |
aMean±95% confidence interval, bmean±standard deviation (n=3).
DM, Dry material; NC, Not considered.
3.5 Adsorption based elution
Vasicine is usually found along with other alkaloids in A. vasica, and its purification thus becomes difficult. Moreover, the alkaline nature of the molecule prolongs elution time through column chromatography. The current process was developed to rapidly isolate pure vasicine from the pool of other molecules. Silica gel is a weakly acidic, considerably inert adsorbent that has long been used to separate plant metabolites through column chromatography. Since vasicine is alkaline it binds reversibly to silica by weak ionic forces. Out of three grades of silica used in the current study, silica at 100–200 mesh worked well in isolating vasicine. It was observed that silica at 60–120 mesh did not adsorb vasicine completely (due to less surface area) and 230–400 mesh did not desorb it completely (due to very large surface area leading to strong adsorption). Thus, further studies were advanced with silica (100–200 mesh). Next, the amount of adsorbent was determined, which depicted that silica gel at 20 g/l was best in extracting pure vasicine. Above 20 g/l, the yield of vasicine remained the same (Figure 7B). Next, adsorption and desorption times were optimized which depicted that both at 30 min yielded maximum yield of vasicine. Above those values, the adsorption and desorption profiles remained the same (Figure 7C). Desorption was done with 70% ethanol/water, a considerably safe solvent for desorption of vasicine. Next, the effect of agitation on the time of desorption and yield was studied, where increase in agitation decreased the time of desorption, but affected the purity of vasicine isolated. It was observed that other impurities or undesired molecules were also rapidly eluted from adsorbent matrix along with vasicine. Therefore, agitation at 200 rpm for 30 min was fixed to achieve high yields of vasicine without compromising purity (Figure 7D). From the above studies it became clear that none of the factors nonlinearly influenced the adsorption process, as all of the factors became linear at one point of experimental observations. Thus, these factors were not considered for response surface based modeling and optimization.

Adsorption studies. (A) Equilibrium adsorption isotherms for adsorption of vasicine and vasicine in extract (VNE) onto silica gel, Ce – final concentration of molecule in solution after adsorption (mg/l), Qe – amount of molecule adsorbed by adsorbent (mg/g); (B) effect of adsorbent amount on yield of vasicine; (C) effect of time on adsorption and desorption; and (D) effect of agitation on desorption time and yield of vasicine.
Even though it became clear that adsorption based elution did isolate vasicine with significant purity, its mechanism of adsorption was required to be unraveled. Thus, adsorption isotherms were studied with both pure vasicine and extract containing a known amount of vasicine. The current isotherm studies depict the kinetics of adsorption of vasicine in extract (multisolute interactions). Figure 7A gives conventional plots of the liquid phase pigment concentration vs. solid phase pigment concentration. The adsorption data obtained were correlated to two commonly used equilibrium isotherm models: Langmuir [Eq. (3)] and Freundlich [Eq. (4)] [37]:
where Ce and qe in Eqs. (3) and (4) are the solution and surface concentration for the molecule, respectively, KL and Qmax are Langmuir constants, and Kf and n are Freundlich constants.
It is obvious that adsorption rates and kinetics vary for a solute molecule in a single solute and multisolute systems. Since solvent extracts from plant matrices contain a combination of molecules, it is vital to advocate that vasicine follows the adsorption kinetics governing the multisolute systems. For this, isotherms were analyzed for both vasicine individually and extract containing vasicine. It was determined that the amount of vasicine in extract was 12% (HPTLC). Subsequently, the amount of vasicine adsorbed to silica was reduced by 25% in extract system than in single system (vasicine alone). Isotherm studies show that adsorption of vasicine as a single solute is better than in multisolute system. This is due to predominance of other molecules that are available in the extract (~88%) that compete during the adsorption process. This smaller ratio of vasicine with respect to other undesired molecules and impurities in total concentration, assists in successful desorption of pure vasicine firstly from the adsorbent pores with no elution of other pigments at 70% ethanol in water (v/v). Isotherm studies indicate that the adsorption model satisfies the Langmuir theory where the number of adsorption sites on silica is restricted and that the vasicine, along with other pigments, forms a monomolecular layer on the adsorbent (silica) at the saturated condition of adsorption. The current adsorption kinetics do not follow the Freundlich equation [Eq. (4)]. This is substantiated by the correlation coefficient (r2) values which are higher for Langmuir (0.99) than Freundlich (<0.9) isotherms [38]. The isothermal parameters are given in Table 6.
Parameters for Langmuir and Freundlich equilibrium isotherm models.
| Parameter | Vasicine | VNE |
|---|---|---|
| Langmuir isotherm | ||
| Q (mg/g) | 49.02 | 37.74 |
| KL (l/g) | 8.12 | 2.64 |
| R | 0.99 | 0.99 |
| Freundlich isotherm | ||
| Kf (l/g) | 1.52 | 1.3 |
| N | 1.78 | 1.76 |
| R | 0.78 | 0.84 |
R – correlation coefficient.
VNE, Vasicine in neutralized extract.
Extraction of natural compounds, especially alkaloids, is tough due to their low abundance in plant tissues which makes application of newly developed green technologies difficult in isolating them with significant yield and purity. Considering the difficulty in development of such processes, the current process, microwave assisted adsorption based elution (MAABE), considerably follows the general principles of green chemistry stated by Anastas and Warner [39], such as reusability (silica), complete usage of raw material (leaves), environmentally friendly (solvents), minimum toxicity (solvents), minimum use of solvents, efficient energy consumption, use of ambient conditions (temperature and pressure), renewable raw material (A. vasica is an easy growing interim crop and an invasive plant in some parts of India) and minimum byproducts formed making the developed process “green” compared to existing processes in the realm of natural product separation engineering.
The extract obtained during different stages of the process is depicted in Figure 8. The final yield of vasicine was 1.12% evidently substantiating a significant increase compared to initial yields of 0.42%, as given in Table 7. The optimized yields obtained depict an increase of 93.34% in total yield of vasicine. Since leaves of A. vasica contained 1.2% of vasicine, total recovery of vasicine obtained from the current process was determined. The final recovery obtained was 93.34%, which is very significant for any developed separation process. In comparison, the recovery obtained through conventional chromatography was a mere 35%. The final purity of vasicine obtained from the optimized run of the developed process was analyzed by HPLC-DAD and was found to be 95.17% (Figure 9). A similar adsorption based elution process was developed by us for isolation of acetyl shikonin from A. nobilis, using activated carbon as adsorbent and aqueous isopropanol as desorbing solution [8]. However, the current study deals with an alkaloid (vasicine) to be extracted from a much complex plant matrix (thick leaves). The former process will work in extracting the vasicine (alkaline) with low yields due to the neutral pH of activated carbon, whereas MAABE utilizes dilute acid to initially extract vasicine and exploits the weak acidic property of silica to adsorb alkaline vasicine, which then is selectively desorbed using aqueous ethanol. The commercially viable isolation process of vasicine used currently in industries includes many stages such as alcohol extraction for 72 h, then acid-base extraction for 2–24 h (including an acid, organic solvent, and a base), then extraction with an organic solvent (chloroform), and finally precipitation using organic solvent mixtures (an ether and acetone) [40]. The solvents used in the process are environmentally harmful, the time consumed is enormous (80–96 h) and the purity obtained for vasicine is 80%, whereas the process developed in the current study uses green solvents (6% HCl and 70% ethanol) and extracts vasicine with a purity of 95% within 5 h with a fewer number of stages. Thus, MAABE works fine for extracting commercially important alkaloids which otherwise are very difficult to isolate using conventional and currently available processes. The developed process with planned design and scale up could be easily commercialized as an economically viable, high yielding, and rapid batch isolation process for efficient recovery of commercially important vasicine from leaves of A. vasica.

Extraction scenario at different stages of microwave assisted adsorption based elution (MAABE). (From left to right) 6% HCl/water extract of leaves filtered after microwave and 4 h agitated batch extraction, neutralized extract containing precipitated compounds (including vasicine), silica gel adsorbed extract, semi-dry pure precipitated vasicine after desorption (becomes yellowish white after complete drying).
Recovery of metabolites from response surface modeling and conventional extraction methods.
| Methodology | Yield (%) | Increase in yield (%) | Recovery (%) |
|---|---|---|---|
| Conventional extraction | 0.42 | – | 35 |
| Optimized through one variable at a time | 0.88 | 52.2 | 73.34 |
| Optimized through RSM | 1.12 | 61.8 | 93.34 |

High performance liquid chromatography (HPLC) analysis of vasicine (purity=95.17%) extracted through microwave assisted adsorption based elution (MAABE).
4 Conclusions
In the present study, vasicine (a dietary supplement) was isolated by a “green” process – MAABE. Exhaustive conventional solvent extraction resulted in low yield of pure vasicine (0.42%) compared to its availability in leaves (1.2%). Classical optimization studies performed in the process increased the yield to 0.88% at 10% solid loading, 6% HCl/water, 4 h extraction time, 300 W microwave power for 6 min of irradiation at 200 rpm agitation followed by adsorption based elution. The amount of vasicine from A. vasica was then optimized by Box-Behnken experimental design in a batch mode extraction process. ANOVA demonstrated a high correlation coefficient (R2=0.991), indicating a good fit between the second order regression model and the experimental observations. Optimal conditions obtained through RSM, which yielded a maximized amount of vasicine of 11.2 mg/g DM, included 9.31% solid loading, 6.64% HCl/water and 4.1 h of extraction. Adsorption based elution was done to further purify the molecule from other impurities, which yielded 95% pure vasicine at 1.12% yield using 20 g/l of silica (100–200 mesh), which adsorbed extract containing vasicine during stirring (200 rpm) for 30 min. This was followed by selective desorption using 70% ethanol/water for 30 min (200 rpm) which efficiently desorbed vasicine leaving other impurities in the adsorbent. Adsorption isotherms depicted that adsorption of vasicine follows the Langmuir theory. It is thus suggested that MAABE could be efficiently used to extract vasicine in better yields through a “green” economical rapid batch extraction process.
About the authors

Shankar Subramaniam obtained his BTech (Hons) in Biotechnology from SASTRA University in 2010. He is currently pursuing his PhD in Biotechnology at SASTRA University. His area of interest is separation engineering and natural products.

Aravind Sivasubramanian obtained his PhD from University of Madras in 2004. He is currently working as Assistant Professor – III in SASTRA University in the field of natural products separation, purification and its related applications.
Acknowledgments
The authors thank the management, SASTRA University, Thanjavur, India for the infrastructure and necessary facilities and also for the research funding through the T.R. Rajagopalan funds. Senior Research fellowship provided to Shankar Subramaniam, by CSIR, New Delhi, India (09/1095/ (0010)/2015-EMR-I) is gratefully acknowledged.
References
[1] Antoinette YO, Darci JT, Erin EC. Chem. Sci. 2006, 2, 760.Search in Google Scholar
[2] Chopra RN. Indigenous Drugs of India, Academic Publishers: Kolkata, 1982.Search in Google Scholar
[3] Suthar AC, Katkar KV, Patil PS, Hamarpurkar PD, Mridula G, Naik VR, Mundada GR, Chouhan VS. J. Pharm. Res. 2009, 2, 1893.Search in Google Scholar
[4] Singh A. Therapeutic monograph-Adhatoda vasica, Ind-swift Ltd.: Mohali, Chandigarh, 2007.Search in Google Scholar
[5] Morphene Remedies (http://www.ayurvediccure.com/natural-supplement/vasaka/). Accessed on 20.11.2015.Search in Google Scholar
[6] Himalaya Healthcare (http://himalayawellness.com/products/pharmaceuticals/vasaka.htm). Accessed on 20.11.2015.Search in Google Scholar
[7] Shankar S, Anbumathi P, Aravind S. RSC Adv. 2014, 5, 7479.10.1039/C5RA15697ASearch in Google Scholar
[8] Shankar S, Anbumathi P, Aravind S. RSC Adv. 2015, 5, 6265–6270.10.1039/C4RA13570ASearch in Google Scholar
[9] Serrano J, Goni I, Saura-Calixto F. Food. Res. Int. 2007, 40, 15–21.10.1016/j.foodres.2006.07.010Search in Google Scholar
[10] Sun-Waterhouse D, Wen I, Wibisono R, Melton LD, Wadhwa S. Int. J. Food. Sci. Technol. 2009, 44, 2644–2652.10.1111/j.1365-2621.2009.02097.xSearch in Google Scholar
[11] Noelia F, Emma C, Herminia. J. Chem. Technol. Biotechnol. 2014, 90, 590.10.1002/jctb.4519Search in Google Scholar
[12] Umar IA, Lee SC, Ramlan A. Green Process. Synth. 2015, 4, 399–410.Search in Google Scholar
[13] Wang J, Sun B, Cao Y, Tian Y, Li X. Food Chem. 2008, 106, 804–810.10.1016/j.foodchem.2007.06.062Search in Google Scholar
[14] Karacabey E, Mazza G. J. Agric. Food Chem. 2008, 56, 6318–6325.10.1021/jf800687bSearch in Google Scholar PubMed
[15] Singh Y, Garg R, Kumar S. Green Process. Synth. 2015, 4, 421–431.10.1515/gps-2015-0056Search in Google Scholar
[16] Seyed MSA, Teymor TH, Barat G, Gholamhasan N, Stefano M, Giancarlo C. Green Process. Synth. 2015, 4, 259–267.Search in Google Scholar
[17] Libo Z, Wenqian G, Tu H, Jing L, Jinhui P, Shaohua Y, Guo L, Yuhang L. Green Process. Synth, 2016, 5, 15–22.10.1515/gps-2015-0077Search in Google Scholar
[18] Boubakri A, Hafiane A, Bouguecha SAT. J. Ind. Eng. Chem. 2014, 20, 3163–3169.10.1016/j.jiec.2013.11.060Search in Google Scholar
[19] International Conference on Harmonisation (ICH). Switzerland, ICH, 2010.Search in Google Scholar
[20] Wikipedia (http://en.wikipedia.org/wiki/Justicia_adhatoda). Accessed on 20.11.2015.Search in Google Scholar
[21] Balawant SJ, Bai Y, Mohindar SP, Kellie KD, William PS. J. Nat. Prod. 1994, 57, 953–962.10.1021/np50109a012Search in Google Scholar
[22] Zill-e-Huma Vian MA, Fabiano-Tixier AS, Elmaataoui M, Dangles O, Chemat F. Food Chem. 2011, 127, 1472–1480.10.1016/j.foodchem.2011.01.112Search in Google Scholar
[23] Farid C, Giancarlo C. Microwave-assisted Extraction for Bioactive Compounds: Theory and Practice, Springer Science and Business Media: Berlin, Germany, 2012.Search in Google Scholar
[24] Dang YY, Zhang H, Xiu ZL. J. Chem. Technol. Biotechnol. 2014, 89, 1576–1581.10.1002/jctb.4241Search in Google Scholar
[25] Mäki-Arvela P, Hachemi I, Murzin DY. J. Chem. Technol. Biotechnol. 2014, 89, 1607–1626.10.1002/jctb.4461Search in Google Scholar
[26] Cacace JE, Mazza G. J. Food. Eng. 2003, 59, 379–389.10.1016/S0260-8774(02)00497-1Search in Google Scholar
[27] Al-Farsi MA, Chang YL. Food. Chem. 2007, 108, 977–985.10.1016/j.foodchem.2007.12.009Search in Google Scholar
[28] Chalermchat Y, Fincan M, Dejmek P. J. Food Eng. 2004, 64, 229–236.10.1016/j.jfoodeng.2003.10.002Search in Google Scholar
[29] Wenjuvan P, Zhongli MH. J. Food. Eng. 2010, 99, 16–23.10.1016/j.jfoodeng.2010.01.020Search in Google Scholar
[30] Zhang ZS, Li D, Wang LJ, Ozkan N, Chen XD, Mao ZH, Yang ZH. Sep. Purif. Technol. 2007, 57, 17–24.10.1016/j.seppur.2007.03.006Search in Google Scholar
[31] Soltani RDC, Rezaee A, Godini H, Khataee AR, Hasanbeiki A. Chem. Ecol. 2012, 29, 72–85.10.1080/02757540.2012.704913Search in Google Scholar
[32] Campos JL, Garrido-Fernandez JM, Mendez R, Lema JM. Bioresour. Technol. 1999, 68, 141–148.10.1016/S0960-8524(98)00141-2Search in Google Scholar
[33] Amini M, Younesi H, Bahramifar N, Lorestani AAZ, Ghorbani F, Daneshi A, Sharifzadeh M. J. Hazard. Mater. 2008, 154, 694–702.10.1016/j.jhazmat.2007.10.114Search in Google Scholar
[34] Mannan S, Fakhrul-Razi A, Alam MZ. J. Environ. Sci. 2007, 19, 1416.10.1016/S1001-0742(07)60231-9Search in Google Scholar
[35] Zhang Z, Zheng H. J. Hazard. Mater. 2009, 172, 1388–1393.10.1016/j.jhazmat.2009.07.146Search in Google Scholar PubMed
[36] Senthilkumar SR, Dempsey M, Krishnan C, Gunasekaran P. Bioresour. Technol. 2008, 99, 7781–7787.10.1016/j.biortech.2008.01.058Search in Google Scholar
[37] Allen SJ, McKay G, Khader KY. Environ. Pollut. 1989, 2, 39.10.1016/0269-7491(89)90120-6Search in Google Scholar
[38] Al-Degs Y, Khraisheh MAM, Allen SJ, Ahmad MN, Walker GM. Chem. Eng. J. 2007, 128, 163–167.10.1016/j.cej.2006.10.009Search in Google Scholar
[39] Anastas PT, Warner JC. Green Chemistry: Theory and Practice, Oxford University Press: London, 1988.Search in Google Scholar
[40] Sunil KC, Guru DB, Prem DD, Sachin S. EP 1487837 B1, 2002.Search in Google Scholar
©2016 by De Gruyter
This article is distributed under the terms of the Creative Commons Attribution Non-Commercial License, which permits unrestricted non-commercial use, distribution, and reproduction in any medium, provided the original work is properly cited.
Articles in the same Issue
- Frontmatter
- In this issue
- Original articles
- Regioselective alkylation of 1,2,4-triazole using ionic liquids under microwave conditions
- A continuous flow process for the green and sustainable production of N-alkyl imidazoles
- Microwave-assisted one-pot syntheses of 4-aminoquinazolines
- Microwave assisted adsorption based elution: a benign green process optimized by Box-Behnken modeling yields pure vasicine from Adhatoda vasica
- Pretreatment of arsenic-bearing gold ore with microwave-assisted alkaline leaching
- Synthesis and mechanical behaviour of green metal matrix composites using waste eggshells as reinforcement material
- Efficient green synthesis of monomethine cyanines via grinding under solvent-free conditions
- Green chemistry preparation of MgO grit like nanostructures: efficient catalyst for the synthesis of 4H-pyrans and α,α′-bis(substituted-benzylidene) cycloalkanone derivatives
- An improved method for aldol condensation catalyses by Amberlyst A-26 OH: application in the synthesis of pseudoionone derivative, 11,15-dimethylhexadeca-8,10,14-trien-7-one
- Synthesis and characterization of amorphous Al2O3 and γ-Al2O3 by spray pyrolysis
- Synergetic surface modification effect of argon and oxygen for diamond films by MPCVD
- Optimization of process variables in the synthesis of butyl butyrate using amino acid-functionalized heteropolyacids as catalysts
- A new and facile method for the functionalization of a Merrifield resin with terpyridines: application as a heterogeneous catalyst for the synthesis of biaryls in environmentally friendly solvents
- Conference announcements
- International Conference on Green Chemistry and Sustainable Engineering (Rome, Italy, 20–22 July, 2016)
- International MicroNanoConference (Amsterdam, The Netherlands, December 13–14, 2016): where science and business discuss microfluidics, photonics and nanoinstrumentation