New invasion or expansion: evaluating the genetic relationships of Bactrocera dorsalis (Diptera: Tephritidae) among detections in Florida
-
Terrance N. Todd
 ,
Gary J. Steck
,
Gary J. Steck

Abstract
Bactrocera dorsalis (Hendel) (Diptera: Tephritidae), the oriental fruit fly, is a highly invasive species that has occasionally been detected in Florida, where conditions are highly favorable for the establishment of this pest. In 2015, a major infestation of B. dorsalis was detected in the Redland agricultural area of Miami-Dade county. Other detections of this pest have occurred in various locations in Florida, including the Redland area, before and after 2015. Questions arose whether any of these detections were related to the major infestation in Redland in 2015, possibly as one or more small, scattered populations that went undetected over time only to resurge as better conditions arose. To address this question, the genetic variation of the 2015 Redland outbreak was characterized using microsatellite DNA and by sequencing a portion of the mitochondrial cytochrome oxidase I (COI) gene. Population structure analyses and exclusion testing was performed on flies captured in years immediately preceding and after 2015 using microsatellites to determine (1) if flies were inconsistent with a shared source and (2) if the 2015 population could be excluded as source of subsequent captures. The COI sequences of the flies also were compared to determine if the 2015 outbreaks could explain variation in subsequent years. Results from this study found that flies captured before and after 2015 were not related to the population eradicated in Redland in 2015. Therefore, we concluded that flies captured in Florida between 2014 and 2021 were not part of any single, continuous breeding population that persisted over months.
Resumen
Bactrocera dorsalis (Hendel) (Diptera: Tephritidae), la mosca oriental de la fruta, es una especie altamente invasora que ocasionalmente se ha detectado en Florida, donde las condiciones son muy favorables para el establecimiento de esta plaga. En 2015, se detectó una infestación importante de B. dorsalis en el área agrícola de Redland en el condado de Miami-Dade. Se han detectado otros casos de esta plaga, antes y después del 2015, en varios lugares de Florida, incluido el área de Redland. Existen dudas de si alguna de estas detecciones estaba relacionada con la infestación principal en Redland en 2015, posiblemente producto de una o más poblaciones pequeñas y dispersas que pasaron desapercibidas con el tiempo, sólo para resurgir a medida que se presentaron mejores condiciones. Para abordar esta duda, la variación genética del brote de Redland del 2015 se caracterizó utilizando microsatélites de ADN y secuenciando una porción de la subunidad I del gen citocromo oxidase (COI), que está localizada en el ADN mitocondrial. Se realizaron análisis de estructura poblacional y pruebas de exclusión en moscas capturadas en años inmediatamente anteriores y posteriores a 2015 utilizando microsatélites para determinar: (1) si las moscas eran inconsistentes con un origen común y (2) si la población del 2015 podría excluirse como origen de capturas posteriores. También se compararon las secuencias COI de las moscas para determinar si los brotes del 2015 podrían explicar la variación en los años posteriores. Los resultados de este estudio encontraron que las moscas capturadas antes y después de 2015 no estaban relacionadas con la población erradicada en Redland en 2015. Por lo tanto, concluimos que las moscas capturadas en Florida entre 2014 y 2021 no forman parte de ninguna población continua reproductora que se mantuvo durante muchos meses.
1 Introduction
The oriental fruit fly, Bactrocera dorsalis (Hendel) (Diptera: Tephritidae), is a highly polyphagous pest native to Asia that can invade many agricultural areas around the world (Aketarawong et al. 2007; Peterson and Denno 1998; Stephens et al. 2007; Zeng et al. 2019). Accidental introduction of this species can have a devastating effect on economically important crops in areas with climates similar to those in its natural range (Drew and Hancock 1994; Ekesi et al. 2016; Stephens et al. 2007). With the continuous, widespread movement of fruits and vegetables that serve as hosts for this insect, commercial trade and international travel have been suggested as contributing mechanisms for its spread (Aketarawong et al. 2007, 2014; Malacrida et al. 2007; Qin et al. 2018; Turner et al. 2021). B. dorsalis has been observed throughout the Asia-Pacific region over the last century, from Pakistan to China, and across the Pacific being established in Hawaii as early as 1946 (Clarke et al. 2019; Stephens et al. 2007; Wan et al. 2012). This pest also has become established in Africa, being reported in Kenya in 2003 and the northern part of South Africa in 2004 (DeVillers et al. 2016; Manrankhan et al. 2015). It is now reported from approximately 40 African countries (DeVillers et al. 2016).
Based on climatic models, Florida is vulnerable to the establishment of this pest with preferred habitat and optimal climatic conditions similar to those in the pest’s natural range (Stephens et al. 2007). To mitigate the risk of accidental introductions, in addition to the safeguards at ports of entries, surveillance programs are implemented to detect incursions early. The Florida Department of Agriculture and Consumer Services (FDACS) and the United States Department of Agriculture, Animal and Plant Health Inspection Service, Plant Protection and Quarantine (USDA-APHIS-PPQ) collaborate on a fruit fly surveillance program. B. dorsalis has been detected in Florida 16 times between 1964 and 2014 (Clark et al. 1996; Steck et al. 2019). Thirty-six flies were detected during this period, and as only a few flies were captured during most detection events, the trapped numbers usually did not meet the threshold requirement to trigger an eradication program (Steck et al. 2019). However, in 2015, 45 male B. dorsalis were captured in a single trap located in the Redland Agricultural area of Miami-Dade county (Steck et al. 2019). The following day, larvae were discovered in mango, Mangifera indica L. (Anacardiaceae), at the same site indicating a breeding population existed. This triggered a major eradication program conducted in 2015–2016 to prevent the establishment of this pest in Florida (Steck et al. 2019). A total of 158 flies were reported from that 2015 to 2016 outbreak (Steck et al. 2019). The pest was declared eradicated in Florida on 13 February 2016. Subsequentially, after the eradication program ended, nine additional detections of B. dorsalis occurred in Florida in the years 2016–2021.
Although B. dorsalis was declared eradicated after the Redland infestation, the source of the infestation was unknown, as were the sources for each of the subsequent detection events. Were each of the detection events an independent invasion or part of a nascent population of fruit flies that may have established at undetectable levels? To date, a formal comparison of genetic diversity of this pest in Florida has not been published. Population genetics of the outbreak could be used to test source estimation hypotheses for flies captured subsequent to eradication (Barr et al. 2014a,b; San Jose et al. 2018; Shi et al. 2012). Steck et al. (2019) suggested that these post-eradication captures most likely represented multiple independent invasions that were independent of the earlier 2015 outbreak based on unpublished cytochrome c oxidase I (COI) sequence data. In this paper we report those and additional data to address the question.
In this study, we characterized the genetic diversity of B. dorsalis in Florida based on flies captured in the years 2014–2021. DNA sequences of the COI gene were used to measure variation in the insect’s mitochondrial genome, and nine simple sequence repeat (SSR) loci were used to estimate variation in the insect’s nuclear genome. The specific goals of the project were to estimate genetic variability of the 2015 outbreak population and to test possible sources of the flies captured after eradication. In addition to the outbreak population, genotypes of one fly captured in Florida in 2014 and 10 flies captured in Florida in the years 2016–2021 were compared to the Redland population genetic structure to test if these flies shared a common source. Exclusion tests were performed on the post-eradication detections to examine the Florida 2015 outbreak as a source for subsequent detections. The flies also were compared to B. dorsalis populations from Hawaii to determine if that could be the source for the Florida detections.
2 Materials and methods
2.1 Specimens and DNA extractions
A total of 127 B. dorsalis captured in traps in Florida between 25 August 2014 and 16 August 2021 representing 10 different detection events (Table 1, Figure 1 [map]) were included in the study. The 115 B. dorsalis captured in Redland, Miami-Dade county between 27 August 2015 and 10 October 2015, were classified as the Redland outbreak population. Two additional flies trapped in Miami-Dade county (Palmetto Bay and Miami) in 2015 were treated as separate detection events from the Redland population for initial analyses. The study also included additional flies from Florida captured in 2014 (N = 1), 2016 (N = 1), 2017 (N = 3), 2018 (N = 4), and 2021 (N = 1). The flies from Florida were morphologically identified as B. dorsalis by Gary Steck. Legs from each fly were removed and used for DNA extraction using the DNeasy Blood and Tissue Kit (Qiagen, Valencia, California, USA) as described in Barr et al. (2012). To support morphological identification, flies were analyzed using internal transcribed spacer 1 (ITS1) region sequences as reported in Barr et al. (2021) (data not shown). ITS1 is used for distinguishing B. dorsalis from Bactrocera carambolae Drew & Hancock (Boykin et al. 2014; Drew and Hancock 1994).
Bactrocera dorsalis detection events in Florida. Locations and number of oriental fruit flies found in the state of Florida between 2014 and 2021. A detection event was declared if one or more flies were detected in an 81-square mile delimitation zone and more than one life cycle had occurred between captured flies.
| Capture site | Voucher code | Dates collected | No. flies | No. COI sequences | No. SSR genotypes |
|---|---|---|---|---|---|
| Broward county, Plantation | E2014-6069 | 25 Aug 2014 | 1 | 1 | 18 |
| Miami-Dade county, Palmetto Bay | E2015-4798 | 17 Aug 2015 | 1 | 1 | 18 |
| Miami-Dade county, Redland | See supplemental data | 27 Aug 2015–10 Oct 2015 | 114 | 112 | 1,948 |
| Miami-Dade county, Miami | E2015-5172 | 8 Sep 2015 | 1 | 1 | 18 |
| Pinellas county, St. Petersburg | E2016-3335-1 | 1 Jul 2016 | 1 | 1 | 18 |
| Lake county, Mount Dora | E2017-132-1 | 12 Jan 2017 | 1 | 1 | 18 |
| Pinellas county, Clearwater | E2017-2251-1 | 6 Jun 2017 | 1 | 1 | 18 |
| Broward county, Weston | E2017-2956 | 26 Jul 2017 | 1 | 1 | 16 |
| Miami-Dade county, Redland | E2018-2988-1 | 1–26 Jun 2018 | 4 | 4 | 70 |
| E2018-3065-1 | |||||
| E2018-3066-1 | |||||
| E2018-3480-1 | |||||
| Seminole county, Casselberry | E2021-4133-1 | 16 Aug 2021 | 1 | 1 | 16 |
-
All DNA extractions are maintained at the USDA-APHIS S&T IMMDL facility and all vouchered specimens are held with the FDACS/DPI.
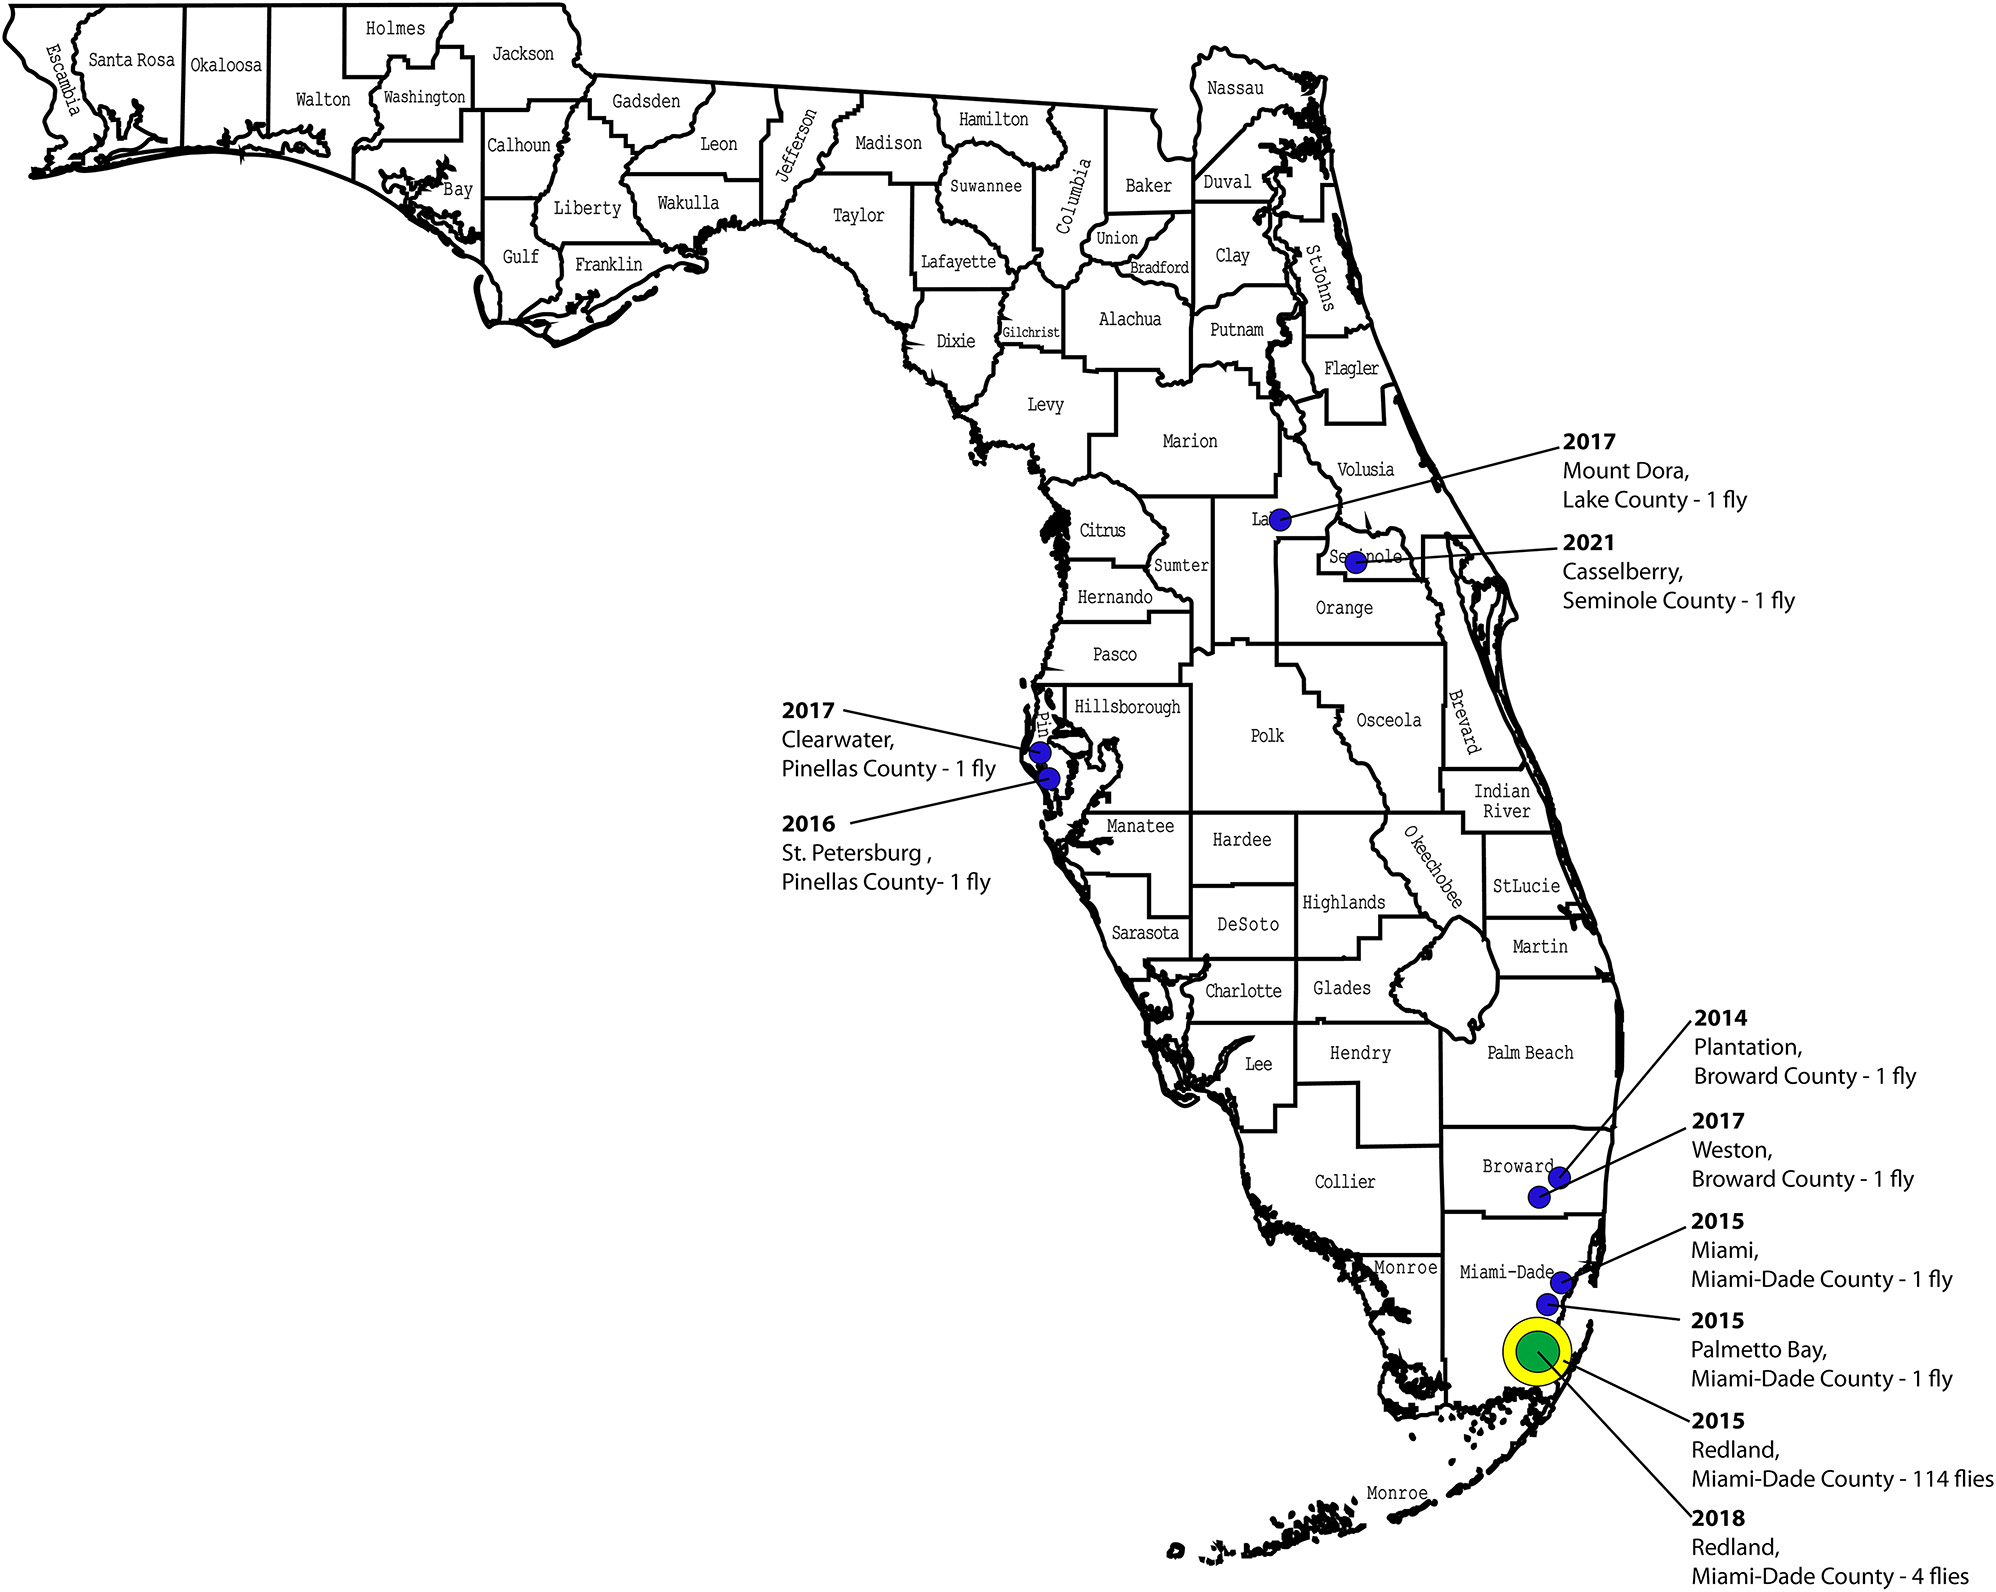
Collection locations of oriental fruit flies in Florida from 2014 to 2021. Location, year and number of flies detected is provided for each detection.
To compare the Florida 2015 outbreak population to other fly populations, 352 B. dorsalis collected from four Hawaiian islands and 24 fruit flies originating from southeast Asia were selected as reference populations (Table 2). The Hawaiian populations were selected to provide an estimate of SSR diversity using an introduced population and source exclusion. The flies from southeast Asia were included to provide an independent measure of SSR diversity of individual flies from more diverse potential source populations. Each of these flies had DNA extracted from the whole body. However, only legs were provided for the flies captured in Florida. The legless bodies were kept as vouchers by the Florida Department of Agriculture and Consumer Services.
Reference populations for captured oriental fruit flies in Florida between 2014 and 2021.
| Population | Sampling site | (n) |
|---|---|---|
| Hawaiʻi | 90 | |
| South Kona | 30 | |
| Waimea Municipal Watershed Reservoir | 31 | |
| Kalōpā State Recreation Area | 29 | |
| Maui | 88 | |
| Kahului | 8 | |
| ʻIao Valley State Park | 16 | |
| Honoapiʻilani Hwy Mile Marker 12 | 16 | |
| Kaʻeleku Cave | 16 | |
| Kula Agriculture Park | 16 | |
| Kaupo General Store | 16 | |
| O’ahu | 91 | |
| Kahuku Agricultural Park | 23 | |
| Mākaha Valley (Waiʻanae Mountains) | 16 | |
| ʻEwa Beach | 20 | |
| Hahaʻione Valley | 20 | |
| Honolulu | 12 | |
| Kaua’i | 94 | |
| CTAHR Agriculture Research Center, Kauaʻi County | 16 | |
| Kuilau Ridge Trail | 16 | |
| Hulemalu Road, Lihue | 22 | |
| Common Ground (Guava Kai Plantation) | 20 | |
| Polihale State Park | 20 | |
| Southeast Asia | 24 | |
| Cambodia; Krong Koh Kong | 12 | |
| Laos; Luang Namtha | 4 | |
| Thailand; Chiang Mai | 8 | |
| Redland, Florida 2015 outbreak | 113 | |
| Captures 17 Aug–7 Sept 2015 | 78 | |
| Captures 8–22 Sept 2015 | 29 | |
| Captures 23 Sept–13 Oct 2015 | 6 |
-
A single fly was excluded from the Redland 2015 reference population (captures 17 Aug–7 Sep 2015) and was instead used for assignment testing.
2.2 COI analysis
DNA samples of flies from Florida were analyzed for the COI gene using a protocol reported in Barr et al. (2014a). Reactions were performed in 25 µl volumes containing 1 µl of template (or water for the negative control), 2.5 µl of 10X Ex Taq buffer (Takara Bio Inc., Kyoto, Japan), 2 µl of dNTP (2.5 mM each, Takara Bio Inc.), 0.125 µl of Ex TaqHS DNA polymerase (5 U/µl, Takara Bio Inc.), and 1 µl of each primer (at 10 µM working concentration). Polymerase chain reactions (PCR) were performed using cycling conditions of 3 min at 94 °C followed by 39 cycles of 20 s at 94 °C, 20 s at 53 °C, and 30 s at 72 °C, and a final extension of 5 min at 72 °C. The amplified fragment is referred to as the C3p790 fragment in Barr et al. (2014a) and includes a 790 bp region of the 3′ portion of the gene. The primers for the PCR were HCO-2198RC [5′-TGATTTTTTGGTCACCCTGAAGTTTA-3′] and PAT-K508 [5′-TCCAATGCACTAATCTGCCATATTA-3′].
PCR products were visualized using 1.2 % agarose gels of TAE buffer (BioRad, Hercules, California, USA) and purified with ExoSAP-IT (ThermoFisher, Applied Biosystems, Waltham, Massachusetts, USA) prior to Sanger DNA sequencing. The amplicons were sequenced using the two PCR primers and ABI BigDye® Terminator v.3.1 chemistry at commercial centers Functional Biosciences (Madison, Wisconsin, USA) or GeneWiz (South Plainfield, New Jersey, USA). The forward and reverse sequences were assembled into contigs using the program Sequencher v5 (Genecodes, Ann Arbor, Michigan, USA) and aligned using MEGA7 (Kumar et al. 2016). Templeton, Crandall, and Sing (TCS) haplotype networks of the COI data were generated using PopART v1.7 (Clement et al. 2002; Leigh and Bryant 2015; Templeton et al. 1992). Tajima’s D statistic was estimated using Arlequin v3.5. Sequence data were submitted to NCBI GenBank (OP243539–OP243560).
2.3 SSR analysis
A total of nine microsatellites, 618A, BO-D48 (Li et al. 2007), BD1, BD19, BD39, BD42, BD76, BD85B (Aketarawong et al. 2006), and MS5 (Dai et al. 2004) were used, end-labeled with either 6-carboxyfluorescein (6-FAM) (ThermoFisher, Applied Biosystems, Waltham, Massachusetts, USA) or VIC® (ThermoFisher, Applied Biosystems, Waltham, Massachusetts, USA) dye set. Polymerase chain reactions were performed in 15 µl reactions containing 1 µl DNA template, 1.5 µl of 10X buffer, 1.2 µl 25 mM dNTP mix, 0.3 µl of labeled 5′ primer (10 nmol; Applied Biosystems), 0.3 µl of unlabeled 3′ primer (10 nmol Eurofins Genomics LLC, Louisville, Kentucky, USA), and 0.08 µl taqDNA Polymerase (TaKaRa Ex Taq Hot Start Polymerase, Takara Bio USA, San Jose, California, USA). Amplification was performed on Applied Biosystem’s Gene Amp 9700 thermocyclers. Cycling conditions were 94 °C for 5 min followed by 39 cycles of 1 min at 94 °C, 1 min at 55 °C, 1 min at 72 °C, and a final extension at 72 °C for 30 min. An aliquot (10 µl) of PCR product was visualized on a 2.0 % TAE agarose gel pre-stained with ethidium bromide (0.4 μg/ml final concentration). Documentation of gels was performed using the GelDocItTS2 Imager (Analytik Jena GmbH, UVP, Beverly, Massachusetts, USA) and VisionWorksLS Imaging Software v 7.1 (Analytik Jena GmbH, UVP, Beverly, Massachusetts, USA). An aliquot (2 µl) of the remaining PCR product was diluted 1:10 in water for fragment analysis. Fragment analysis was performed on an ABI 3730XL DNA Analyzer with the ABI Data Collection Program (v 2.0) provided by Functional Bioscience (Madison, Wisconsin, USA).
PeakScanner v2.0 (ThermoFisher, Applied Biosystems, Waltham, Massachusetts, USA) was used to determine fragment size, and binning was performed using Microsatellite Toolkit v3.1 (Park 2001) and Tandem (Ruby v1.08) (Matschiner and Salzburger 2009). Population differentiation was determined by F st (Weir and Cockerham 1984) for all reference populations using Arlequin (Excoffier and Lischer 2010), and a Bayesian Markov Chain Monte Carlo (MCMC) based approach was implemented using STRUCTURE v2.3.4 (Pritchard et al. 2000) using 25 independent runs (K = 2–5) with 100,000 generation burn-in over 1,000,000 generations. Individual B. dorsalis flies detected before and after the 2015 Redland event and an outgroup of flies representing the southeast Asian population were then compared to the Hawaiian and the 2015 Redland outbreak collection using Geneclass2 (Piry et al. 2004). Assignment tests also were performed on a fly collected from the 2015 Redland outbreak (E2015-4798) as a reference point and the two flies collected in 2015 from Miami-Dade county in Palmetto Bay and Miami to determine if the Redland outbreak site could be excluded as a source.
To observe if changes occurred in allele and homozygosity values over the outbreak, the Redland population was divided into three temporal lifecycles: f1 (17 August–7 September 2015), f2 (8–22 September 2015), and f3 (23 September–13 October 2015). This division of cycles was based on generational life cycles of B. dorsalis (Borchert et al. 2011). The allele frequency of each division was estimated using Arlequin and changes in heterozygosity were estimated.
3 Results
3.1 COI analysis
COI sequences were successfully generated from 124 of the 127 extraction samples. After editing, the sequence length of data records was 765 bp and comparison in an alignment detected no evidence of insertions or deletions or disruptions to reading frame of translated amino acids. These 124 records included nine distinct COI sequence haplotypes (Table 3). A TCS network of the nine haplotypes is presented in Figure 2. The greatest distance between any two sequences in the network is 13 mutational steps and an uncorrected p-distance of 0.017.
Observed cytochrome oxidase I haplotypes found in captured oriental fruit flies in Florida between 2014 and 2021. Accession number in GenBank provided for reference.
| Haplotype | Florida populations | GenBank |
|---|---|---|
| C3p01 | Broward county: Weston (2017, N = 1) | OP243550 |
| Seminole county: Casselberry (2021, N = 1) | ||
| C3pX326 | Miami-Dade county: Redland (2015, N = 98) | OP243540 |
| Miami-Dade county: Palmetto Bay (2015, N = 1) | ||
| Miami-Dade county: Miami (2015, N = 1) | ||
| C3pX357 | Miami-Dade county: Redland (2015, N = 11) | OP243541 |
| C3pX358 | Broward county: Plantation (2014, N = 1) | OP243539 |
| C3pX359 | Miami-Dade county: Redland (2015, N = 3) | OP243543 |
| C3pX364 | Pinellas county: St. Petersburg (2016, N = 1) | OP243547 |
| C3pX369 | Lake county: Mount Dora (2017, N = 1) | OP243548 |
| C3pX371 | Pinellas county: Clearwater (2017, N = 1) | OP243549 |
| C3pX373 | Miami-Dade county: Redland (2018, N = 4) | OP243551 |

TCS haplotype network of the cytochrome oxidase I data generated from Bactrocera dorsalis collected in Florida in 2014–2021. The haplotypes are presented as circles and each circle size represents the number of flies with that haplotype. The black circles represent hypothetical haplotypes that connect the sampled haplotypes. Mutation (substitution) steps are represented by the lines in between haplotypes. The figure was generated using TCS method in PopArt (http://popart.otago.ac.nz).
The 112 samples that represent the Redland outbreak population in 2015 included three haplotypes. The most common haplotype was the C3pX326 (N = 98) followed by C3pX357 (N = 11), and C3pX359 (N = 3). The two additional flies detected in 2015 from Palmetto Bay and Miami shared the C3pX326 haplotype. Consequently, these 114 flies from Miami-Dade county in 2015 were treated as the 2015 outbreak population. The estimated mean diversity of the 2015 outbreak population was d = 0.001 (S.E. 0.001) using p-distance and 1,000 bootstraps. The data set had seven segregating sites, Theta of 0.00170, and nucleotide diversity of 0.00127. Estimates of Tajima’s D statistic were not significant (p > 0.10).
The single fly collected in Broward county in 2014 had a haplotype sequence (C3pX358, Table 3) that was not previously reported but was only one mutation different from a haplotype (C3p02) frequently collected in Hawaiian populations of B. dorsalis (Barr et al. 2014b). The 2014 haplotype has not been reported in previous studies including amongst any flies captured in Florida. The flies trapped in Florida from 2016 to 2021 do not share haplotype sequences with the 2015 outbreak flies. The four flies detected in 2016 and 2017 had distinct haplotypes from each other. The St. Petersburg fly trapped in 2016 had a new haplotype (C3pX364) separated by at least four mutations from the other flies trapped in Florida. This haplotype has not been reported in previous studies. The three flies captured in 2017 each had unique haplotypes. The flies from Lake county and Pinellas county had new haplotypes. The flies from Broward county (2017) and Seminole county (2021) had the haplotype (C3p01), which is common to Hawaii (Barr et al. 2014b), found frequently in California (Barr et al. 2014b), and reported from China and Tahiti (San Jose et al. 2018). The four flies trapped in 2018 all shared the C3pX373 haplotype, which has not been previously reported.
Based on the Barr et al. (2014b) study, Hawaii can be excluded as a possible source for 122 (out of 124) of the flies in the study including all the flies collected in the years 2015, 2016, and 2018, but Asia and Africa are not excluded as possible sources of these flies. Only three flies had DNA consistent with the Hawaiian populations: the flies caught in 2014 and 2017 from Broward county and the 2021 fly from Seminole county. Failure to exclude Hawaii suggests a link with that source, but alternative regions also are possible, such as Tahiti and Asia where similar types have been reported. Prior studies have reported high COI genetic variation for B. dorsalis and a lack of structure needed to reliably exclude or assign the origin of flies from Asia (Barr et al. 2014a; Garzón-Orduña et al. 2019; San Jose et al. 2018). Consistent with these prior results, the Florida flies include seven COI haplotypes that have not been previously reported.
3.2 SSR population structure of reference populations
PCR of the SSR markers for the reference populations was highly successful with 99.4 % of all 3,364 PCR reactions producing results for analysis (Table 4). A total of 65 alleles across nine loci was detected. A total of 487 B. dorsalis originating from the state of Hawaii (N = 352), southeast Asia (N = 24), and captured during the Redland 2015 infestation (N = 111) were successfully genotyped and was used as reference populations for comparing diversity and performing tests of structure. The Hawaiian reference collection includes four sub-populations of the Big Island (Hawaiʻi), Maui, Oʻahu, and Kauaʻi (Tables 3 and 4). The Redland 2015 reference population did not include the two flies found in Palmetto Bay and Miami in 2015 (Table 1). The southeast Asia individuals were used to examine heterozygosity values but not to test structure based on a priori collection data because that reference population represents a composite of flies from multiple collections and likely not a single natural population. All individuals were included in Structure models to sort according to genetic similarity.
Observed genetic diversity seen across reference populations for oriental fruit flies in Florida, Hawaii and southeast Asia. Table provides breakdown of number of alleles and mean expected (Exp Het.) and observed (Obs Het.) heterozygosity in reference populations used to determine assignment for captured oriental fruit flies in Florida in 2015.
| Locus | Hawaiʻi (N = 87) | Maui (N = 91) | Oʻahu (N = 92) | Kauaʻi (N = 82) | SE Asia (N = 24) | Redland (N = 111) | Mean alleles | S.D. | Total alleles |
|---|---|---|---|---|---|---|---|---|---|
| BD1 | 3 | 4 | 3 | 3 | 8 | 4 | 4.167 | 1.941 | 8 |
| BD19 | 2 | 2 | 2 | 2 | 6 | 1 | 2.500 | 1.761 | 6 |
| BD42 | 2 | 2 | 2 | 2 | 6 | 5 | 3.167 | 1.835 | 7 |
| BD76 | 3 | 3 | 3 | 3 | 5 | 1 | 3.000 | 1.265 | 5 |
| BoD48 | 4 | 3 | 4 | 3 | 8 | 4 | 4.333 | 1.862 | 8 |
| MS5 | 3 | 3 | 3 | 4 | 9 | 5 | 4.500 | 2.345 | 9 |
| 618A | 3 | 3 | 3 | 3 | 3 | 5 | 3.333 | 0.816 | 6 |
| BD85B | 4 | 3 | 3 | 3 | 6 | 5 | 4.000 | 1.265 | 7 |
| BD39 | 3 | 3 | 3 | 3 | 8 | 4 | 4.000 | 2.000 | 9 |
| Exp Het. | 0.48617 | 0.48752 | 0.52507 | 0.55837 | 0.66085 | 0.09654 | |||
| Obs Het. | 0.41238 | 0.44986 | 0.43631 | 0.51300 | 0.50451 | 0.12101 | |||
| S.D. | 0.17852 | 0.15765 | 0.15420 | 0.09307 | 0.16244 | 0.27274 |
B. dorsalis individuals originating from Asia show the highest diversity of alleles (x = 6.56), followed by the fruit flies collected during the Redland outbreak in 2015 (x = 4.57). However, heterozygosity was low (0.12) in the flies captured in Redland in comparison to Hawaii (
Population pairwise F st values for reference populations for oriental fruit flies in Florida, Hawaii, and southeast Asia. Reference populations arranged by distance. All values were found to be significant (p < 0.001).
| Hawaiʻi | Maui | Oʻahu | Kauaʻi | SE Asia | Redland | |
|---|---|---|---|---|---|---|
| Hawaiʻi | – | |||||
| Maui | 0.01871 | – | ||||
| Oʻahu | 0.02711 | 0.02682 | – | |||
| Kauaʻi | 0.03139 | 0.02775 | 0.01412 | – | ||
| SE Asia | 0.17977 | 0.18191 | 0.16741 | 0.10831 | – | |
| Redland | 0.29530 | 0.27428 | 0.28191 | 0.23299 | 0.17692 | – |
3.3 SSR Bayesian structure analysis of individuals from each detection event
In addition to the Redland reference flies, 11 flies captured in Florida from 2014 to 2018 were included in SSR analyses. Two of the four flies collected from Miami Dade county in June 2018 failed to produce adequate PCR fragments for analysis. There was also difficulty in producing SSR fragments of the BD1 locus with >40 % of the Florida flies failing. This could be due to low DNA yield from the extraction process. BD1 was able to amplify a PCR fragment from all the Hawaiian reference DNA samples and Asian outgroup, all of which had DNA extracted from whole bodies. PCR fragments were obtained for nine specimens using the remaining eight markers. This set of nine flies includes the Palmetto Bay and Miami flies trapped in 2015 within the same county as the Redland flies. Structure analysis of SSR profiles from a data set including the 487 reference individuals and the nine additional Florida collections is reported in Figure 3.
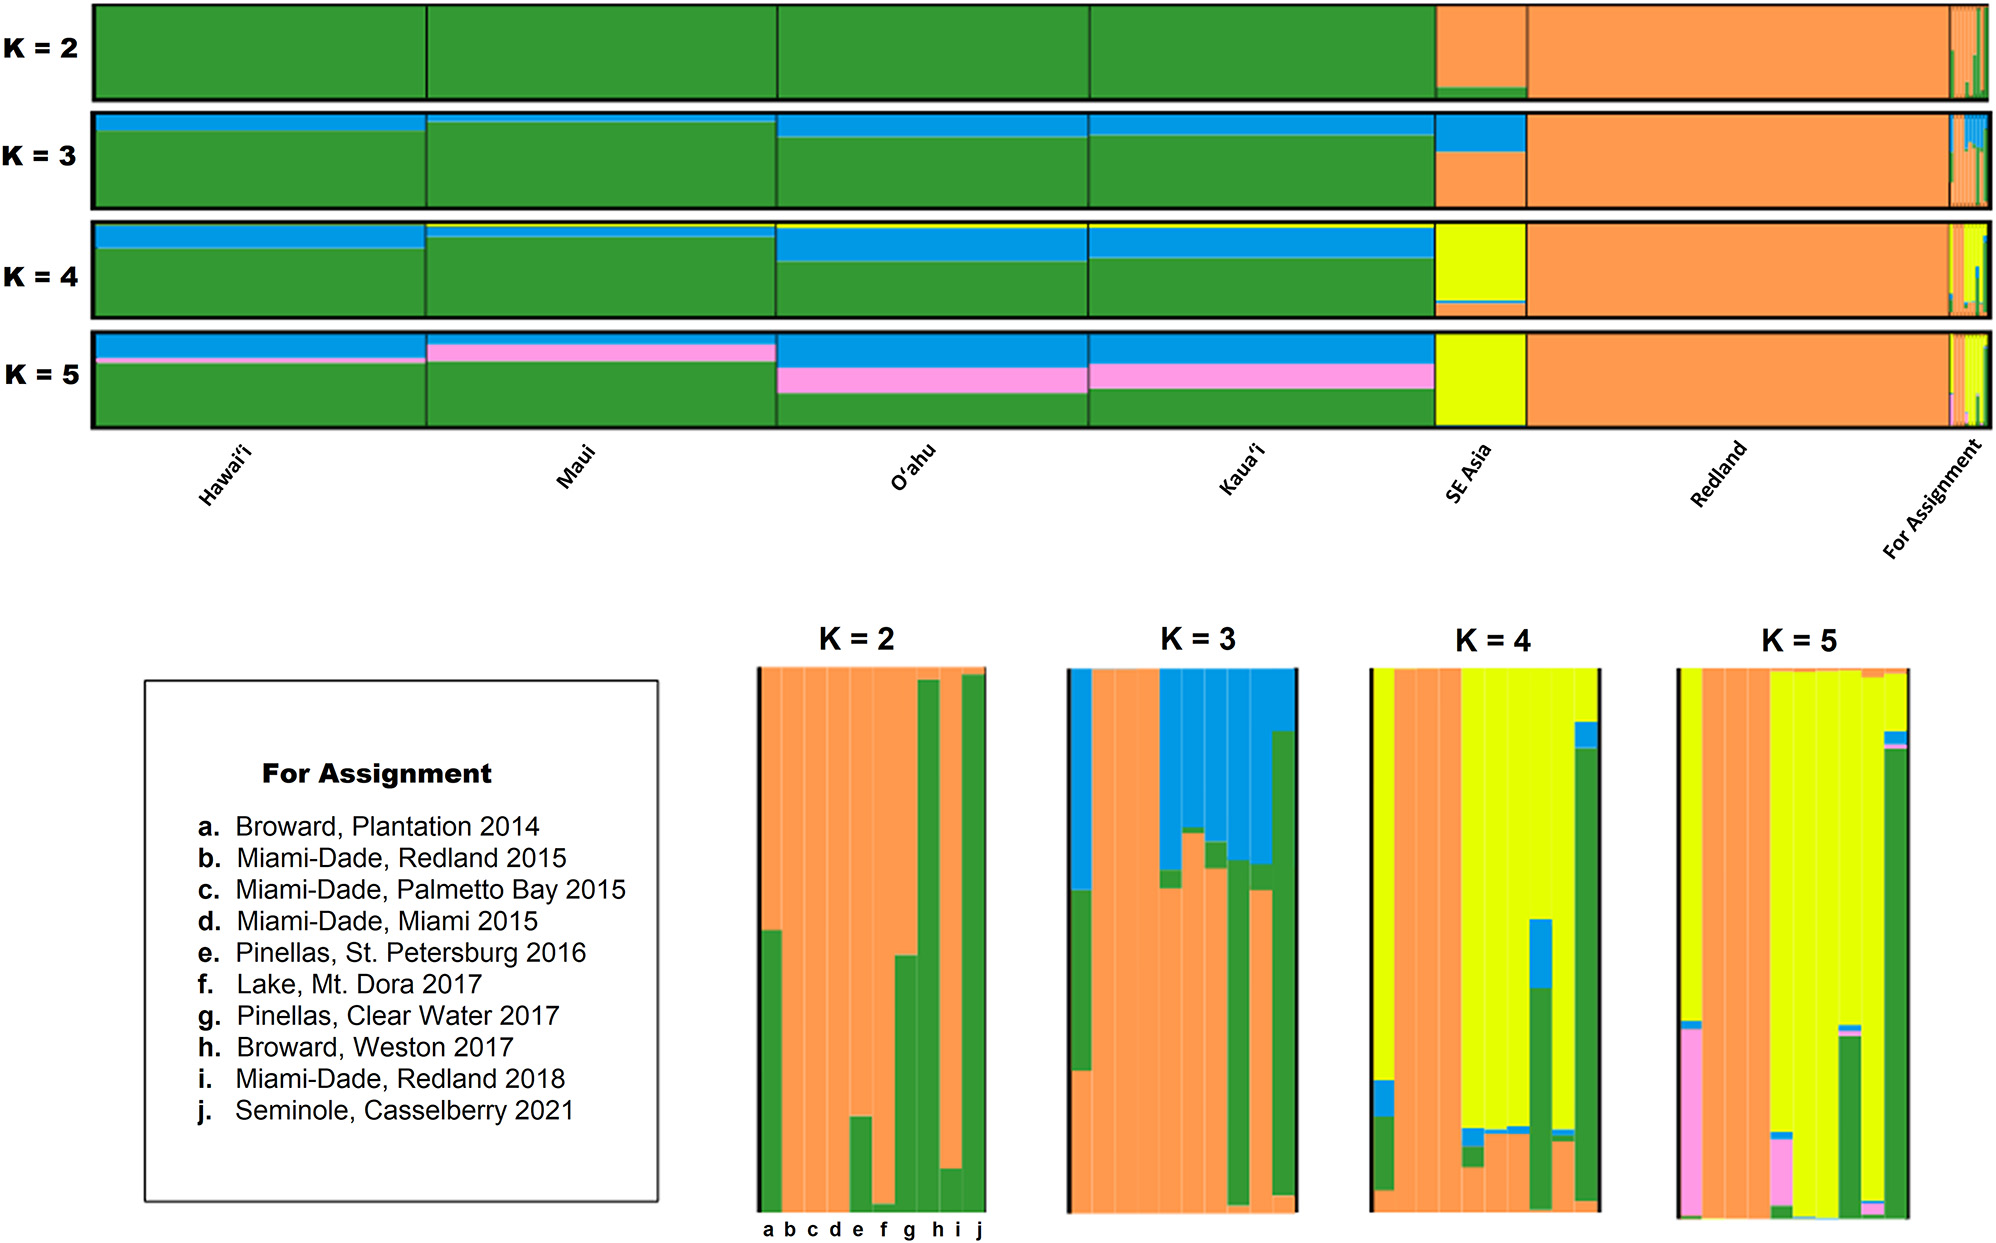
Bayesian clustering pattern for Bactrocera dorsalis reference population and flies captured between 2014 and 2021 in Florida. (Top) Assignment probabilities assuming an admixture ancestry model with independent allelic frequencies. Used a LocPrior distribution and organized data based on geographic distance and estimate (K = 2–5) in STRUCTURE v2.3.4 (Pritchard et al. 2002) for the Hawaiian Islands, southeast Asia and the Redland outbreak and each individual fly for population assignment. (Bottom) A blow up of the captured oriental fruit flies analyzed independent of reference population and compared to reference populations. Based on the observations seen in the assignment test, none of the other captured flies observed in the other capture events could possibly be a direct descendent of the flies detected during the Redland detection event of 2015.
Bayesian analysis using STRUCTURE was performed including all individuals. Sample sites were divided into six groups (Hawaiʻi n = 90; Maui n = 88; Oʻahu n = 91; Kauaʻi n = 94; southeast Asia n = 24; and Redland n = 113). Population (K) was estimated to be between 2 and 5. In all estimates of K, Hawaiʻi strongly separated out as a single unique population with variations observed between the four islands. In contrast, at the lowest population estimates (K = 2) Redland and samples from southeast Asia had a structure consistent with a single population.
The genetic similarity observed between Redland and the small composite collection of specimens used to represent southeast Asia tends to indicate a shared heritage at lower K values. However, this might not have any biologically significance as the Hawaiian population is strongly structured relative to the other flies in the dataset. At higher K values (K > 3), Redland begins to separate away from the representative southeast Asian flies and begins exhibiting a structure consistent with a single population. By using these higher K values, we can then compare individual capture events to Hawaiian Islands and Redland. The representative Redland 2015 fly (E2015-4996) and the two flies collected outside the Redland quarantine zone in 2015 (Palmetto Bay (E2015-4798) and Miami (E2015-5172)) were tested and found to 100 % match to flies collected in Redland at K = 1–4 (Figure 3). Flies from the other seven detection events did not exhibit enough shared alleles to allow grouping with flies found during the Redland detection event. One fly (E2017-2956) had high similarity to flies found on the Hawaiian Islands when K was set at 2 and 3, but less similarity under higher values of K. Finally, the fly collected in 2021 (E2021-4133-1) was highly similar to the population observed on the Hawaiian Islands across all values of K indicating a shared relationship.
3.4 SSR assignment tests for captured flies
SSR first generation assignment tests (Paetkau et al. 2004) were performed for 10 fruit flies detected in Florida before, during, and after the 2015 Redland outbreak (Table 6). One fly from Broward county, Plantation (E2014-6069) was captured before the infestation (and could not be progeny of the outbreak), two flies were captured during the outbreak (but outside Redland area), and seven detections were made after the Redland infestation was declared eradicated. In 2018, four flies were captured within close proximity of the Redland infestation of 2015, but only one fly (E2018-3066-1) yielded high quality SSR results for all alleles, and was the only fly used in assignment testing.
Assignment test for oriental fruit flies captured in Florida between 2014 and 2021. SSR individual assignment tests were performed using Paetkau et al. (2004) probability computation using Monte-Carlo resampling with 10,000 simulated individuals; p > 0.05. Regions that cannot be excluded are in bold. However, the genetic diversity present throughout the natural range of Bactrocera dorsalis is not completely represented in these analyses to allow us to exclude southeast Asia as a source. There may be a population in the native range that matches the flies found in these detection events.
| Fly collection location (year) | Figure 3. code | Hawaiʻi | Maui | Oʻahu | Kauaʻi | SE Asia | Redland |
|---|---|---|---|---|---|---|---|
| Broward county, Plantation (2014) | a | 0.0000 | 0.0015 | 0.0172 | 0.0014 | 0.0018 | 0.0000 |
| Miami-Dade county, Redland (2015) | b | 0.0000 | 0.0001 | 0.0000 | 0.0005 | 0.0257 | 0.0725 |
| Miami-Dade county, Palmetto Bay (2015) | c | 0.0000 | 0.0006 | 0.0016 | 0.0076 | 0.0781 | 0.0792 |
| Miami-Dade county, Miami (2015) | d | 0.0000 | 0.0001 | 0.0001 | 0.0007 | 0.0082 | 0.8939 |
| Pinellas county, St. Petersburg (2016) | e | 0.0000 | 0.0000 | 0.0000 | 0.0011 | 0.0754 | 0.0000 |
| Lake county, Mount Dora (2017) | f | 0.0000 | 0.0000 | 0.0000 | 0.0001 | 0.0173 | 0.0000 |
| Pinellas county, Clearwater (2017) | g | 0.0000 | 0.0001 | 0.0001 | 0.0145 | 0.1127 | 0.0007 |
| Broward county, Weston (2017) | h | 0.3875 | 0.4781 | 0.2412 | 0.2159 | 0.0060 | 0.0011 |
| Miami-Dade county, Redland (2018) | i | 0.0008 | 0.0040 | 0.0071 | 0.0271 | 0.4894 | 0.0163 |
| Seminole county, Casselberry (2021) | j | 0.0680 | 0.0738 | 0.0849 | 0.0780 | 0.0049 | 0.0001 |
As expected, a Redland source could not be rejected for the first 2015 Redland fly captured for first generation assignment tests using Geneclass2. A Redland 2015 source also was not rejected for the two flies collected in 2015 from Palmetto Bay and Miami. The other tested flies all had the Redland reference population rejected as the probable source (familial genetic relationship) with statistical significance (p < 0.05).
The Broward county fly captured in 2014 (E2014-6069) predates the Redland outbreak and would be excluded as possible progeny of that outbreak. The assignment tests demonstrated that the four Hawaiian populations also are excluded as a source of this fly. Although the analysis rejects southeast Asia as a source for this fly, that Asian reference data set is not representative of the true variability of southeast Asia and cannot be used to exclude it as a source. Therefore, a southeast Asian source is possible for this fly. Although provided in Table 6, the rejection or failure to reject the southeast Asia population as the source is not based on sufficient sampling. Therefore, this value is not reported or interpreted for other flies in this section.
The Broward county fly from 2017 (E2017-2956) did not have Hawaii excluded as a source. This is consistent with the mitochondrial data that was a match to a Hawaiian source. The exclusion tests performed here do not include adequate material to exclude other sources such as Asia, Africa, and the Pacific islands for this fly.
Finally, four detections of B. dorsalis occurred north of Miami-Dade county and were genetically different from the 2015 outbreak. For the two flies from Pinellas county (St. Petersburg 2016, Clearwater 2017) and the fly from Lake county (Mount Dora 2017), Hawaii was rejected as a source. For the most recent detection, the 2021 detection in Seminole county (E2021-4133-1), Hawaii was not rejected as a source. This fly had a COI sequence that is commonly observed in Hawaii.
4 Discussion
In this paper, we provide the first genetic analysis of the B. dorsalis from Florida describing the 2015 outbreak in Redland plus previous and subsequent detection events. We demonstrated that the outbreak population was relatively diverse compared to Hawaiian B. dorsalis populations when using COI and SSR genetic data sets. Three COI haplotypes were observed in the Redland 2015 outbreak flies, suggesting that at least three females were present to contribute to the genetic variation observed in the outbreak. The predominant haplotype, C3pX324, has been observed in B. dorsalis larvae intercepted from passenger baggage at several ports of entry throughout the United States, seen 29 times in a total of 10 ports between 2012 and 2018 (unpublished data). This genetic type also has been reported from flies collected in Asia (i.e., Cambodia, China, Thailand, and Bangladesh) (San Jose et al. 2018). It is not possible to determine what geographic area in Asia might be the most likely source using these data if the flies originated from this region. Collections from Africa were also not available, so Africa cannot be excluded either, as it not known if this haplotype exists there. The COI genetic types reported from the Redland outbreak were distinct from diversity in Hawaii. Consequently, Hawaii was excluded as a source for this outbreak based on methods of Barr et al. (2014b). The SSR data also detected a genetic separation between the 2015 outbreak and Hawaiian populations of B. dorsalis. The STRUCTURE analysis of SSR data clustered all flies from the 2015 outbreak into a single population, supporting a single source hypothesis for the introduction.
The molecular data support the hypothesis that the 2015 outbreak was from one introduction event and that previous and subsequent detections in Florida have been the result of independent incursions. Reintroduction of the pest into California also has been reported using DNA methods (Barr et al. 2014a). The observed COI haplotypes found in these captures demonstrated non-overlapping genetic diversity between the flies captured in 2015 in Redland versus flies captured in other years. At least three detection events could not exclude Hawaii as a potential source using COI data, with one occurring pre-invasion (2014) and two post-invasion (2017 and 2021). The flies from 2014 to 2017 were captured in the same county, but were separated by several years, with the later (2017) capture more resembling B. dorsalis from Hawaii than the 2014 fly based on Bayesian clustering of the SSR data. Hawaii was not excluded as a potential source of the 2017 fly using exclusion testing of SSR data. The fly collected in Broward county in 2014 did resemble flies collected from Hawaii using pairwise assignment testing, but Hawaii was excluded as a source of the fly based on an exclusion test. The third fly with COI data matching Hawaiian populations was from Seminole county (2021) but it did not have SSR data generated for comparison. Hawaii is not the only potential source of flies with the C3p01 COI type, and as noted in our current study additional analysis of other geographic sources using genomic markers will be needed to refine source estimation methods. Failure to exclude Hawaii does not mean that it is the source of these three detections.
The other detection events of B. dorsalis in 2016, 2017, and 2018 have Hawaii excluded as a source. These events also appear to represent independent introductions based on COI and SSR data. The only flies that share genetic similarity are the four flies from the Miami-Dade county Redland collections in June 2018. These four flies represent one detection event.
Additional support for a reintroduction hypothesis of B. dorsalis into Florida is from trapping methods and records. While conditions in Florida are favorable for rapid expansion of invading populations (Stephens et al. 2007), new detections were limited to single or two captures per event. Since the 2015 Redland outbreak, there has not been a detection event involving more than four flies being detected over multiple life cycles within a surveillance or delimitation zone.
Acknowledgments
Florida Department of Agriculture and Consumer Services – Division of Plant Industry; U.S. Department of Agriculture; USDA-APHIS-S&T, PQ-017541.refe
-
Research ethics: Not Applicable.
-
Author contributions: The authors have accepted responsibility for the entire content of this manuscript and approved its submission. All authors contributed to research, writing and editing of this manuscript.
-
Competing interests: The use or mention of a trademark or proprietary product does not constitute an endorsement, guarantee, or warranty of the product and does not imply its approval to the exclusion of other suitable products by the U.S. Department of Agriculture, an equal opportunity employer. All other authors state no conflict of interest.
-
Research funding: Funding provided by USDA-APHIS-S&T, PQ-017541.
-
Data availability: The raw data can be obtained on request from the corresponding author.
References
Aketarawong, N., Bonizzoni, M., Malacrida, A.R., Gasperi, G., and Thanaphum, S. (2006). Seventeen novel microsatellite markers from an enriched library of the pest species Bactrocera dorsalis sensu stricto. Mol. Ecol. Notes 6: 1138–1140, https://doi.org/10.1111/j.1471-8286.2006.01463.x.Search in Google Scholar
Aketarawong, N., Bonizzoni, M., Thanaphum, S., Gomulski, L.M., Gasperi, G., Malacrida, A.R., and Gugliemino, C.R. (2007). Inferences on the population structure and colonization process of the invasive oriental fruit fly, Bactrocera dorsalis (Hendel). Mol. Ecol. 16: 3522–3532, https://doi.org/10.1111/j.1365-294x.2007.03409.x.Search in Google Scholar
Aketarawong, N., Gugliemino, C., Karam, N., Falchetto, M., Manni, M., Scolari, F., Gomulski, M., Gasperi, G., and Malacrida, A.R. (2014). The oriental fruit fly Bactrocera dorsalis s.s. in East Asia: disentangling the different forces promoting the invasion and shaping the genetic make-up of populations. Genetica 142: 201–213, https://doi.org/10.1007/s10709-014-9767-4.Search in Google Scholar PubMed
Barr, N.B., Hauser, M., Belcher, J., Salinas, D., Schuenzel, E., Kerr, P., and Gaimari, S. (2021). Use of ITS-1 to identify Bactrocera dorsalis and Bactrocera occipitalis (Diptera: Tephritidae): a case study using flies trapped in California from 2009 to 2018. Fla. Entomol. 104: 96–106, https://doi.org/10.1653/024.104.0205.Search in Google Scholar
Barr, N.B., Islam, M.S., De-Meyer, M., and McPheron, B.A. (2012). Molecular identification of Ceratitis capitata (Diptera: Tephritidae) using DNA sequences of the COI barcode region. Ann. Entomol. Soc. Am. 105: 339–350, https://doi.org/10.1603/an11100.Search in Google Scholar
Barr, N., Ruiz-Ace, R., and Armstrong, K. (2014a). Using molecules to identify the source of fruit fly invasions. In: Shelly, T., Epsky, N., Jang, E.B., Reyes-Flores, J., and Vargas, R. (Eds.). Trapping tephritid fruit flies: lures, area-wide programs, and trade implications. Springer, New York, USA, pp. 321–378.Search in Google Scholar
Barr, N.B., Ledezma, L.A., Leblanc, L., San Jose, M., Rubinoff, D., Geib, S., Fujita, B., Bartels, D.W., Garza, D., Kerr, P., et al.. (2014b). Genetic diversity of Bactrocera dorsalis (Diptera, Tephritidae) on the Hawaiian Islands: implications for the introduction pathway into California. J. Econ. Entomol. 107: 1946–1958, https://doi.org/10.1603/ec13482.Search in Google Scholar
Borchert, D., Hoffman, K., and Vargas, R. (2011). Bactrocera dorsalis, oriental fruit fly life-cycle model review, Internal Report. United States Department of Agriculture Animal and Plant Health Inspection Service Plant Protection and Quarantine, Raleigh, NC, California Department of Food and Agriculture, Sacramento, CA, United States Department of Agriculture Agricultural Research Service, Oahu, HI.Search in Google Scholar
Boykin, L.M., Schutze, M.K., Krosch, M.N., Chomic, A., Chapman, T.A., Englezou, A., Armstrong, K.F., Clarke, A.R., Hailstones, D., and Cameron, S.L. (2014). Multi-gene phylogenetic analysis of the southeast Asian pest members of the Bactrocera dorsalis species complex (Diptera: Tephritidae) does not support current taxonomy. J. Appl. Entomol. 138: 235–253, https://doi.org/10.1111/jen.12047.Search in Google Scholar
Clark, R.A., Steck, G.J., and Weems, H.V. (1996). Detection, quarantine, and eradication of fruit flies in Florida. In: Rosen, D., Bennett, F.D., and Capinera, J.L. (Eds.). Pest management in the subtropics: integrated pest management – a Florida perspective. Intercept Ltd., Andover, UK, pp. 29–54.Search in Google Scholar
Clarke, A.R., Li, Z.-H., Qin, Y.-J., Zhao, Z.-H., Liu, L.-J., and Schutze, M.K. (2019). Bactrocera dorsalis (Hendel) (Diptera: Tephritidae) is not invasive through Asia: it’s been there all along. J. Appl. Entomol. 143: 797–801, https://doi.org/10.1111/jen.12649.Search in Google Scholar
Clement, M., Snell, Q., Walker, P., Posada, D., and Crandall, K. (2002). TCS: estimating gene genealogies. Parallel Distr. Process. Symp., Int. Proc. 2: 184, https://doi.org/10.1109/ipdps.2002.1016585.Search in Google Scholar
Dai, S.M., Lin, C.C., and Chang, C. (2004). Polymorphic microsatellite DNA markers from the oriental fruit fly Bactrocera dorsalis (Hendel). Mol. Ecol. Notes 4: 629–631, https://doi.org/10.1111/j.1471-8286.2004.00732.x.Search in Google Scholar
DeVillers, M., Hattingh, V., Kriticos, D.J., Brunel, S., Vayssières, J.F., Sinzogan, A., Bilah, M.K., Mohamed, S.A., Mwatawala, M., Abdelgader, H., et al.. (2016). The potential distribution of Bactrocera dorsalis: considering phenology and irrigation patterns. Bull. Entomol. Res. 106: 19–33, https://doi.org/10.1017/s0007485315000693.Search in Google Scholar
Drew, R.A. and Hancock, D.L. (1994). The Bactrocera dorsalis complex of fruit flies (Diptera: Tephritidae: Dacinae) in Asia. Bull. Entomol. Res. 2: 1–68, https://doi.org/10.1017/s1367426900000278.Search in Google Scholar
Ekesi, S., Meyer, M.D., Mohamed, S.A., Virgilio, M., and Borgemeister, C. (2016). Taxonomy, ecology, and management of native and exotic fruit fly species in Africa. Annu. Rev. Entomol. 61: 219–238, https://doi.org/10.1146/annurev-ento-010715-023603.Search in Google Scholar PubMed
Excoffier, L. and Lischer, H.E.L. (2010). Arlequin suite version 3.5: a new series of programs to perform population genetics analyses under Linux and Windows. Mol. Ecol. Resour. 10: 564–567, https://doi.org/10.1111/j.1755-0998.2010.02847.x.Search in Google Scholar PubMed
Garzón-Orduña, I.J., Geib, S.M., and Barr, N.B. (2019). The genetic diversity of Bactrocera dorsalis (Diptera: Tephritidae) in China and neighboring countries: a review from published studies. J. Econ. Entomol. 112: 2001–2006, https://doi.org/10.1093/jee/toz073.Search in Google Scholar PubMed
Kumar, S., Stecher, G., and Tamura, K. (2016). MEGA7: molecular evolutionary genetics analysis version 7.0 for bigger datasets. Mol. Biol. Evol. 33: 1870–1874, https://doi.org/10.1093/molbev/msw054.Search in Google Scholar PubMed PubMed Central
Leigh, J.W. and Bryant, D. (2015). POPART: full-feature software for haplotype network construction. Methods Ecol. Evol. 6: 1110–1116, https://doi.org/10.1111/2041-210x.12410.Search in Google Scholar
Li, W.F., Yang, L., Tang, K., Ling, Z., and Liang, G.W. (2007). Microsatellite polymorphism of Bactrocera dorsalis (Hendel) populations in China. Acta Entomol. Sin. 12: 1255–1262.Search in Google Scholar
Malacrida, A.R., Golumski, L.M., Bonizzoni, M., Bertin, S., Gasperi, G., and Gugliel, C.R. (2007). Globalization and fruit fly invasion and expansion: the medfly paradigm. Genetica 131: 1–9, https://doi.org/10.1007/s10709-006-9117-2.Search in Google Scholar PubMed
Manrankhan, A., Vener, J.H., and Hattingh, V. (2015). The progressive invasion of Bactocera dorsalis (Diptera: Tephritidae) in South Africa. Biol. Invasions 17: 2803–2809, https://doi.org/10.1007/s10530-015-0923-2.Search in Google Scholar
Matschiner, M. and Salzburger, W. (2009). TANDEM: integrating automated allele binning into genetics and genomics workflows. Bioinformatics 25: 1982–1983, https://doi.org/10.1093/bioinformatics/btp303.Search in Google Scholar PubMed
Paetkau, D., Slade, R., Burden, M., and Estoup, A. (2004). Genetic assignment methods for the direct, real-time estimation of migration rate: a simulation-based exploration of accuracy and power. Mol. Ecol. 13: 55–65, https://doi.org/10.1046/j.1365-294x.2004.02008.x.Search in Google Scholar PubMed
Park, S. (2001). Excel Microsatellite Toolkit v3.1. Animal Genomics Lab, University College, Dublin, Ireland.Search in Google Scholar
Peterson, M.A. and Denno, R.F. (1998). The influence of dispersal and diet breadth on patterns of genetic isolation by distance in phytophagous insects. Am. Nat. 152: 428–446, https://doi.org/10.1086/286180.Search in Google Scholar PubMed
Piry, S., Alaperire, A., Cornuet, J.M., and Paetkau, D. (2004). Software for genetic assignment and first-generation migrant detection. J. Hered. 95: 536–539, https://doi.org/10.1093/jhered/esh074.Search in Google Scholar PubMed
Pritchard, J.K., Stephens, M., and Donnelly, P. (2000). Inference of population structure using multilocus genotypic data. Genetics 155: 945–959, https://doi.org/10.1093/genetics/155.2.945.Search in Google Scholar PubMed PubMed Central
Qin, Y.J., Krosh, M.N., Schutze, M.K., Zhang, Y., Wang, X.X., Prabhakar, C.S., Susanto, A., Hee, A.K.W., Ekesi, S., Badii, K., et al.. (2018). Population structure of a global agricultural invasive pest, Bactrocera dorsalis (Diptera: Tephritidae). Evol. Appl. 11: 1990–2003, https://doi.org/10.1111/eva.12701.Search in Google Scholar PubMed PubMed Central
San Jose, M., Doorenweerd, C., Leblanc, L., Barr, N., Geib, S., and Rubinoff, D. (2018). Tracking the origins of fly invasions; using mitochondrial haplotype diversity to identify potential source populations in two genetically intertwined fruit fly species (Bactrocera carambolae and Bactrocera dorsalis (Diptera: Tephritidae). J. Econ. Entomol. 111: 1–13, https://doi.org/10.1093/jee/toy272.Search in Google Scholar PubMed
Shi, W., Kerdelhue, C., and Ye, H. (2012). Genetic structure and inferences on potential source areas for Bactrocera dorsalis (Hendel) based on mitochondrial and microsatellite markers. PLoS One 7: e37083, https://doi.org/10.1371/journal.pone.0037083.Search in Google Scholar PubMed PubMed Central
Steck, G.J., Fox, A.J., Carrillo, D., Dean, D., Roda, A., Epsky, N.D., and Smith, T.R. (2019). Oriental fruit fly eradication in Florida 2015–2016: program implementation, unique aspects, and lessons learned. Am. Entomol. 65: 108–121, https://doi.org/10.1093/ae/tmz023.Search in Google Scholar
Stephens, A.E.A., Kriticos, D.J., and Leriche, A. (2007). The current and future potential geographical distribution of the oriental fruit fly, Bactrocera dorsalis (Diptera: Tephritidae). Bull. Entomol. Res. 97: 369–378, https://doi.org/10.1017/s0007485307005044.Search in Google Scholar PubMed
Templeton, A.R., Crandall, K.A., and Sing, C.F. (1992). A cladistic analysis of phenotypic associations with haplotypes inferred from restriction endonuclease mapping and DNA sequence data. III. Cladogram estimation. Genetics 132: 619–633, https://doi.org/10.1093/genetics/132.2.619.Search in Google Scholar PubMed PubMed Central
Turner, R.M., Brockerhoff, E.G., Bertelsmeier, C., Blake, R.E., Caton, B., James, A., MacLeod, A., Nahrung, H.F., Pawson, S.M., Plank, M.J., et al.. (2021). Worldwide border interceptions provide a window into human-mediated global insect movement. Ecol. Appl. 31: e02412, https://doi.org/10.1002/eap.2412.Search in Google Scholar PubMed
Wan, X., Yinghong, L., and Zhang, B. (2012). Invasion history of the oriental fruit fly, Bactrocera dorsalis, in the Pacific-Asia region: two main invasion routes. PLoS One 7: e36176, https://doi.org/10.1371/journal.pone.0036176.Search in Google Scholar PubMed PubMed Central
Weir, B.S. and Cockerham, C.C. (1984). Estimating F-statistics for the analysis of population structure. Evolution 38: 1358–1370, https://doi.org/10.2307/2408641.Search in Google Scholar
Zeng, Y., Reddy, G.V.P., Li, Z., Qin, Y., Wang, Y., Pan, X., Jiang, F., Gao, F., and Zhao, Z.H. (2019). Global distribution and invasion pattern of oriental fruit fly, Bactrocera dorsalis (Diptera: Tephritidae). J. Appl. Entomol. 143: 165–176, https://doi.org/10.1111/jen.12582.Search in Google Scholar
© 2024 the author(s), published by De Gruyter on behalf of the Florida Entomological Society
This work is licensed under the Creative Commons Attribution 4.0 International License.
Articles in the same Issue
- Research Articles
- Implementing sanitation practices against the hibiscus bud weevil Anthonomus testaceosquamosus (Coleoptera: Curculionidae)
- Evaluation of potential natural enemies of hibiscus mealybug, Nipaecoccus viridis (Hemiptera: Pseudococcidae) in Florida citrus
- Phenology of Nipaecoccus viridis (Hemiptera: Pseudococcidae) in Florida citrus groves
- Florida’s agricultural inspection stations: focus on intercepting invasive Hemiptera in interstate truck shipments
- Taxonomy, hosts, and distribution of an emerging invasive mealybug, Phenacoccus miruku (Hemiptera: Coccomorpha: Pseudococcidae), in Florida
- New invasion or expansion: evaluating the genetic relationships of Bactrocera dorsalis (Diptera: Tephritidae) among detections in Florida
- Ant community composition in a citrus grove reveals eastern expansion in Florida of the South American big-headed ant (Hymenoptera: Formicidae)
- Scientific Notes
- Invasive Chinese tallow tree serves as a new host for four scale insect species
- First report of a predatory mite in association with Floracarus perrepae (Acariformes: Eriophyidae), a biological control agent for Old World climbing fern in Florida